OLAP cube

An OLAP cube is a term that typically refers to multi-dimensional array of data. OLAP is an acronym for online analytical processing,[1] which is a computer-based technique of analyzing data to look for insights. The term cube here refers to a multi-dimensional dataset, which is also sometimes called a hypercube if the number of dimensions is greater than 3.
Terminology
A cube can be considered a multi-dimensional generalization of a two- or three-dimensional spreadsheet. For example, a company might wish to summarize financial data by product, by time-period, and by city to compare actual and budget expenses. Product, time, city and scenario (actual and budget) are the data's dimensions.[2]
Cube is a shortcut for multidimensional dataset, given that data can have an arbitrary number of dimensions. The term hypercube is sometimes used, especially for data with more than three dimensions. A cube is not a "cube" in the strict mathematical sense, as all the sides are not necessarily equal. But this term is used widely.
Slicer is a term for a dimension which is held constant for all cells so that multi-dimensional information can be shown in a two-dimensional physical space of a spreadsheet or pivot table.
Each cell of the cube holds a number that represents some measure of the business, such as sales, profits, expenses, budget and forecast.
OLAP data is typically stored in a star schema or snowflake schema in a relational data warehouse or in a special-purpose data management system. Measures are derived from the records in the fact table and dimensions are derived from the dimension tables.
Hierarchy
The elements of a dimension can be organized as a hierarchy,[3] a set of parent-child relationships, typically where a parent member summarizes its children. Parent elements can further be aggregated as the children of another parent.[4]
For example, May 2005's parent is Second Quarter 2005 which is in turn the child of Year 2005. Similarly cities are the children of regions; products roll into product groups and individual expense items into types of expenditure.
Operations
Conceiving data as a cube with hierarchical dimensions leads to conceptually straightforward operations to facilitate analysis. Aligning the data content with a familiar visualization enhances analyst learning and productivity.[4] The user-initiated process of navigating by calling for page displays interactively, through the specification of slices via rotations and drill down/up is sometimes called "slice and dice". Common operations include slice and dice, drill down, roll up, and pivot.

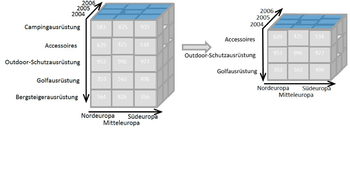
Slice is the act of picking a rectangular subset of a cube by choosing a single value for one of its dimensions, creating a new cube with one fewer dimension.[4] The picture shows a slicing operation: The sales figures of all sales regions and all product categories of the company in the year 2005 and 2006 are "sliced" out of the data cube.
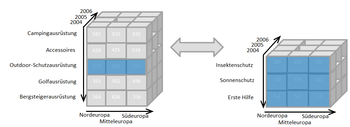
Dice: The dice operation produces a subcube by allowing the analyst to pick specific values of multiple dimensions.[5] The picture shows a dicing operation: The new cube shows the sales figures of a limited number of product categories, the time and region dimensions cover the same range as before.
Drill Down/Up allows the user to navigate among levels of data ranging from the most summarized (up) to the most detailed (down).[4] The picture shows a drill-down operation: The analyst moves from the summary category "Outdoor-Schutzausrüstung" to see the sales figures for the individual products.
Roll-up: A roll-up involves summarizing the data along a dimension. The summarization rule might be computing totals along a hierarchy or applying a set of formulas such as "profit = sales - expenses".[4]
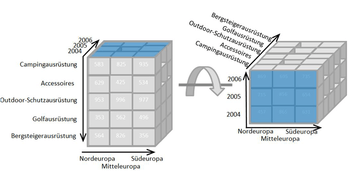
Pivot allows an analyst to rotate the cube in space to see its various faces. For example, cities could be arranged vertically and products horizontally while viewing data for a particular quarter. Pivoting could replace products with time periods to see data across time for a single product.[4][6]
The picture shows a pivoting operation: The whole cube is rotated, giving another perspective on the data.
Mathematical definition
In database theory, an OLAP cube is[7] an abstract representation of a projection of an RDBMS relation. Given a relation of order N, consider a projection that subtends X, Y, and Z as the key and W as the residual attribute. Characterizing this as a function,
- f : (X,Y,Z) → W,
the attributes X, Y, and Z correspond to the axes of the cube, while the W value into which each ( X, Y, Z ) triple maps corresponds to the data element that populates each cell of the cube.
Insofar as two-dimensional output devices cannot readily characterize three dimensions, it is more practical to project "slices" of the data cube (we say project in the classic vector analytic sense of dimensional reduction, not in the SQL sense, although the two are conceptually similar),
- g : (X,Y) → W
which may suppress a primary key, but still have some semantic significance, perhaps a slice of the triadic functional representation for a given Z value of interest.
The motivation[7] behind OLAP displays harks back to the cross-tabbed report paradigm of 1980s DBMS. The resulting spreadsheet-style display, where values of X populate row $1; values of Y populate column $A; and values of g : ( X, Y ) → W populate the individual cells "southeast of" $B2, so to speak, $B2 itself included.
See also
References
- ↑ "Just What Are Cubes Anyway? (A Painless Introduction to OLAP Technology)". Msdn.microsoft.com. Retrieved 2012-07-25.
- ↑ "Cybertec releases OLAP cubes for PostgreSQL". PostgreSQL. 2006-10-02. Retrieved 2008-03-05.
- ↑ "Oracle9i Data Warehousing Guide hierarchy". Lorentz Center. Retrieved 2008-03-05.
- 1 2 3 4 5 6 "OLAP and OLAP Server Definitions". The OLAP Council. 1995. Retrieved 2008-03-18.
- ↑ "Glossary of Data Mining Terms". University of Alberta. 1999. Retrieved 2008-03-17.
- ↑ "Computer Encyclopedia: multidimensional views". Answers.com. Retrieved 2008-03-05.
- 1 2 Gray, Jim; Bosworth, Adam; Layman, Andrew; Priahesh, Hamid (1995-11-18). "Data Cube: A Relational Aggregation Operator Generalizing Group-By, Cross-Tab, and Sub-Totals". Proc. 12th International Conference on Data Engineering. IEEE. pp. 152–159. Retrieved 2008-11-09.
External links
- Daniel Lemire (December 2007). "Data Warehousing and OLAP - A Research-Oriented Bibliography". Retrieved 2008-03-05.
- The RDF Data Cube Vocabulary