Data warehouse
In computing, a data warehouse (DW or DWH), also known as an enterprise data warehouse (EDW), is a system used for reporting and data analysis, and is considered a core component of business intelligence.[1] DWs are central repositories of integrated data from one or more disparate sources. They store current and historical data and are used for creating analytical reports for knowledge workers throughout the enterprise. Examples of reports could range from annual and quarterly comparisons and trends to detailed daily sales analysis.
The data stored in the warehouse is uploaded from the operational systems (such as marketing or sales). The data may pass through an operational data store for additional operations before it is used in the DW for reporting.
Types of systems
- Data mart
- A data mart is a simple form of a data warehouse that is focused on a single subject (or functional area), hence they draw data from a limited number of sources such as sales, finance or marketing. Data marts are often built and controlled by a single department within an organization. The sources could be internal operational systems, a central data warehouse, or external data.[2] Denormalization is the norm for data modeling techniques in this system. Given that data marts generally cover only a subset of the data contained in a data warehouse, they are often easier and faster to implement.
| Data warehouse | Data mart |
|---|---|
| enterprise-wide data | department-wide data |
| multiple subject areas | single subject area |
| difficult to build | easy to build |
| takes more time to build | less time to build |
| larger memory | limited memory |
Types of data marts
- Dependent data mart
- Independent data mart
- Hybrid data mart
- Online analytical processing (OLAP)
- OLAP is characterized by a relatively low volume of transactions. Queries are often very complex and involve aggregations. For OLAP systems, response time is an effectiveness measure. OLAP applications are widely used by Data Mining techniques. OLAP databases store aggregated, historical data in multi-dimensional schemas (usually star schemas). OLAP systems typically have data latency of a few hours, as opposed to data marts, where latency is expected to be closer to one day. The OLAP approach is used to analyze multidimensional data from multiple sources and perspectives. The three basic operations in OLAP are : Roll-up (Consolidation), Drill-down and Slicing & Dicing.[3]
- Online transaction processing (OLTP)
- OLTP is characterized by a large number of short on-line transactions (INSERT, UPDATE, DELETE). OLTP systems emphasize very fast query processing and maintaining data integrity in multi-access environments. For OLTP systems, effectiveness is measured by the number of transactions per second. OLTP databases contain detailed and current data. The schema used to store transactional databases is the entity model (usually 3NF).[4] Normalization is the norm for data modeling techniques in this system.
- Predictive analysis
- Predictive analysis is about finding and quantifying hidden patterns in the data using complex mathematical models that can be used to predict future outcomes. Predictive analysis is different from OLAP in that OLAP focuses on historical data analysis and is reactive in nature, while predictive analysis focuses on the future. These systems are also used for CRM (customer relationship management).
Software tools
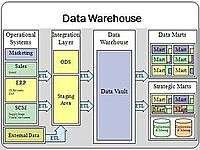
The typical extract-transform-load (ETL)-based data warehouse uses staging, data integration, and access layers to house its key functions. The staging layer or staging database stores raw data extracted from each of the disparate source data systems. The integration layer integrates the disparate data sets by transforming the data from the staging layer often storing this transformed data in an operational data store (ODS) database. The integrated data are then moved to yet another database, often called the data warehouse database, where the data is arranged into hierarchical groups often called dimensions and into facts and aggregate facts. The combination of facts and dimensions is sometimes called a star schema. The access layer helps users retrieve data.[5]
This definition of the data warehouse focuses on data storage. The main source of the data is cleaned, transformed, catalogued and made available for use by managers and other business professionals for data mining, online analytical processing, market research and decision support.[6] However, the means to retrieve and analyze data, to extract, transform and load data, and to manage the data dictionary are also considered essential components of a data warehousing system. Many references to data warehousing use this broader context. Thus, an expanded definition for data warehousing includes business intelligence tools, tools to extract, transform and load data into the repository, and tools to manage and retrieve metadata.
Benefits
A data warehouse maintains a copy of information from the source transaction systems. This architectural complexity provides the opportunity to:
- Integrate data from multiple sources into a single database and data model. Mere congregation of data to single database so a single query engine can be used to present data is an ODS.
- Mitigate the problem of database isolation level lock contention in transaction processing systems caused by attempts to run large, long running, analysis queries in transaction processing databases.
- Maintain data history, even if the source transaction systems do not.
- Integrate data from multiple source systems, enabling a central view across the enterprise. This benefit is always valuable, but particularly so when the organization has grown by merger.
- Improve data quality, by providing consistent codes and descriptions, flagging or even fixing bad data.
- Present the organization's information consistently.
- Provide a single common data model for all data of interest regardless of the data's source.
- Restructure the data so that it makes sense to the business users.
- Restructure the data so that it delivers excellent query performance, even for complex analytic queries, without impacting the operational systems.
- Add value to operational business applications, notably customer relationship management (CRM) systems.
- Make decision–support queries easier to write.
- Optimized data warehouse architectures allow data scientists to organize and disambiguate repetitive data.[7]
Generic environment
The environment for data warehouses and marts includes the following:
- Source systems that provide data to the warehouse or mart;
- Data integration technology and processes that are needed to prepare the data for use;
- Different architectures for storing data in an organization's data warehouse or data marts;
- Different tools and applications for the variety of users;
- Metadata, data quality, and governance processes must be in place to ensure that the warehouse or mart meets its purposes.
In regards to source systems listed above, Rainer states, "A common source for the data in data warehouses is the company's operational databases, which can be relational databases".[8]
Regarding data integration, Rainer states, "It is necessary to extract data from source systems, transform them, and load them into a data mart or warehouse".[8]
Rainer discusses storing data in an organization’s data warehouse or data marts.[8]
Metadata are data about data. "IT personnel need information about data sources; database, table, and column names; refresh schedules; and data usage measures".[8]
Today, the most successful companies are those that can respond quickly and flexibly to market changes and opportunities. A key to this response is the effective and efficient use of data and information by analysts and managers.[8] A "data warehouse" is a repository of historical data that are organized by subject to support decision makers in the organization.[8] Once data are stored in a data mart or warehouse, they can be accessed.
History
The concept of data warehousing dates back to the late 1980s[9] when IBM researchers Barry Devlin and Paul Murphy developed the "business data warehouse". In essence, the data warehousing concept was intended to provide an architectural model for the flow of data from operational systems to decision support environments. The concept attempted to address the various problems associated with this flow, mainly the high costs associated with it. In the absence of a data warehousing architecture, an enormous amount of redundancy was required to support multiple decision support environments. In larger corporations it was typical for multiple decision support environments to operate independently. Though each environment served different users, they often required much of the same stored data. The process of gathering, cleaning and integrating data from various sources, usually from long-term existing operational systems (usually referred to as legacy systems), was typically in part replicated for each environment. Moreover, the operational systems were frequently reexamined as new decision support requirements emerged. Often new requirements necessitated gathering, cleaning and integrating new data from "data marts" that were tailored for ready access by users.
Key developments in early years of data warehousing were:
- 1960s – General Mills and Dartmouth College, in a joint research project, develop the terms dimensions and facts.[10]
- 1970s – ACNielsen and IRI provide dimensional data marts for retail sales.[10]
- 1970s – Bill Inmon begins to define and discuss the term: Data Warehouse.
- 1975 – Sperry Univac introduces MAPPER (MAintain, Prepare, and Produce Executive Reports) is a database management and reporting system that includes the world's first 4GL. First platform designed for building Information Centers (a forerunner of contemporary Enterprise Data Warehousing platforms)
- 1983 – Teradata introduces a database management system specifically designed for decision support.
- 1984 – Metaphor Computer Systems, founded by David Liddle and Don Massaro, releases Data Interpretation System (DIS). DIS was a hardware/software package and GUI for business users to create a database management and analytic system.
- 1988 – Barry Devlin and Paul Murphy publish the article An architecture for a business and information system where they introduce the term "business data warehouse".[11]
- 1990 – Red Brick Systems, founded by Ralph Kimball, introduces Red Brick Warehouse, a database management system specifically for data warehousing.
- 1991 – Prism Solutions, founded by Bill Inmon, introduces Prism Warehouse Manager, software for developing a data warehouse.
- 1992 – Bill Inmon publishes the book Building the Data Warehouse.[12]
- 1995 – The Data Warehousing Institute, a for-profit organization that promotes data warehousing, is founded.
- 1996 – Ralph Kimball publishes the book The Data Warehouse Toolkit.[13]
- 2012 – Bill Inmon developed and made public technology known as "textual disambiguation". Textual disambiguation applies context to raw text and reformats the raw text and context into a standard data base format. Once raw text is passed through textual disambiguation, it can easily and efficiently be accessed and analyzed by standard business intelligence technology. Textual disambiguation is accomplished through the execution of textual ETL. Textual disambiguation is useful wherever raw text is found, such as in documents, Hadoop, email, and so forth.
Information storage
Facts
A fact is a value or measurement, which represents a fact about the managed entity or system.
Facts as reported by the reporting entity are said to be at raw level. E.g. in a mobile telephone system, if a BTS (base transceiver station) received 1,000 requests for traffic channel allocation, it allocates for 820 and rejects the remaining then it would report 3 facts or measurements to a management system:
- tch_req_total = 1000
- tch_req_success = 820
- tch_req_fail = 180
Facts at the raw level are further aggregated to higher levels in various dimensions to extract more service or business-relevant information from it. These are called aggregates or summaries or aggregated facts.
For instance, if there are 3 BTSs in a city, then the facts above can be aggregated from the BTS to the city level in the network dimension. For example:


Dimensional versus normalized approach for storage of data
There are three or more leading approaches to storing data in a data warehouse — the most important approaches are the dimensional approach and the normalized approach.
The dimensional approach refers to Ralph Kimball’s approach in which it is stated that the data warehouse should be modeled using a Dimensional Model/star schema. The normalized approach, also called the 3NF model (Third Normal Form) refers to Bill Inmon's approach in which it is stated that the data warehouse should be modeled using an E-R model/normalized model.
In a dimensional approach, transaction data are partitioned into "facts", which are generally numeric transaction data, and "dimensions", which are the reference information that gives context to the facts. For example, a sales transaction can be broken up into facts such as the number of products ordered and the total price paid for the products, and into dimensions such as order date, customer name, product number, order ship-to and bill-to locations, and salesperson responsible for receiving the order.
A key advantage of a dimensional approach is that the data warehouse is easier for the user to understand and to use. Also, the retrieval of data from the data warehouse tends to operate very quickly.[13] Dimensional structures are easy to understand for business users, because the structure is divided into measurements/facts and context/dimensions. Facts are related to the organization’s business processes and operational system whereas the dimensions surrounding them contain context about the measurement (Kimball, Ralph 2008). Another advantage offered by dimensional model is that it does not involve a relational database every time. Thus, this type of modeling technique is very useful for end-user queries in data warehouse.[3]
The main disadvantages of the dimensional approach are the following:
- In order to maintain the integrity of facts and dimensions, loading the data warehouse with data from different operational systems is complicated.
- It is difficult to modify the data warehouse structure if the organization adopting the dimensional approach changes the way in which it does business.
In the normalized approach, the data in the data warehouse are stored following, to a degree, database normalization rules. Tables are grouped together by subject areas that reflect general data categories (e.g., data on customers, products, finance, etc.). The normalized structure divides data into entities, which creates several tables in a relational database. When applied in large enterprises the result is dozens of tables that are linked together by a web of joins. Furthermore, each of the created entities is converted into separate physical tables when the database is implemented (Kimball, Ralph 2008). The main advantage of this approach is that it is straightforward to add information into the database. Some disadvantages of this approach are that, because of the number of tables involved, it can be difficult for users to join data from different sources into meaningful information and to access the information without a precise understanding of the sources of data and of the data structure of the data warehouse.
Both normalized and dimensional models can be represented in entity-relationship diagrams as both contain joined relational tables. The difference between the two models is the degree of normalization (also known as Normal Forms). These approaches are not mutually exclusive, and there are other approaches. Dimensional approaches can involve normalizing data to a degree (Kimball, Ralph 2008).
In Information-Driven Business,[14] Robert Hillard proposes an approach to comparing the two approaches based on the information needs of the business problem. The technique shows that normalized models hold far more information than their dimensional equivalents (even when the same fields are used in both models) but this extra information comes at the cost of usability. The technique measures information quantity in terms of information entropy and usability in terms of the Small Worlds data transformation measure.[15]
Design methods
Bottom-up design
In the bottom-up approach, data marts are first created to provide reporting and analytical capabilities for specific business processes. These data marts can then be integrated to create a comprehensive data warehouse. The data warehouse bus architecture is primarily an implementation of "the bus", a collection of conformed dimensions and conformed facts, which are dimensions that are shared (in a specific way) between facts in two or more data marts.[16]
Top-down design
The top-down approach is designed using a normalized enterprise data model. "Atomic" data, that is, data at the greatest level of detail, are stored in the data warehouse. Dimensional data marts containing data needed for specific business processes or specific departments are created from the data warehouse.[17]
Hybrid design
Data warehouses (DW) often resemble the hub and spokes architecture. Legacy systems feeding the warehouse often include customer relationship management and enterprise resource planning, generating large amounts of data. To consolidate these various data models, and facilitate the extract transform load process, data warehouses often make use of an operational data store, the information from which is parsed into the actual DW. To reduce data redundancy, larger systems often store the data in a normalized way. Data marts for specific reports can then be built on top of the DW.
The DW database in a hybrid solution is kept on third normal form to eliminate data redundancy. A normal relational database, however, is not efficient for business intelligence reports where dimensional modelling is prevalent. Small data marts can shop for data from the consolidated warehouse and use the filtered, specific data for the fact tables and dimensions required. The DW provides a single source of information from which the data marts can read, providing a wide range of business information. The hybrid architecture allows a DW to be replaced with a master data management solution where operational, not static information could reside.
The Data Vault Modeling components follow hub and spokes architecture. This modeling style is a hybrid design, consisting of the best practices from both third normal form and star schema. The Data Vault model is not a true third normal form, and breaks some of its rules, but it is a top-down architecture with a bottom up design. The Data Vault model is geared to be strictly a data warehouse. It is not geared to be end-user accessible, which when built, still requires the use of a data mart or star schema based release area for business purposes.
Versus operational system
Operational systems are optimized for preservation of data integrity and speed of recording of business transactions through use of database normalization and an entity-relationship model. Operational system designers generally follow the Codd rules of database normalization in order to ensure data integrity. Codd defined five increasingly stringent rules of normalization. Fully normalized database designs (that is, those satisfying all five Codd rules) often result in information from a business transaction being stored in dozens to hundreds of tables. Relational databases are efficient at managing the relationships between these tables. The databases have very fast insert/update performance because only a small amount of data in those tables is affected each time a transaction is processed. Finally, in order to improve performance, older data are usually periodically purged from operational systems.
Data warehouses are optimized for analytic access patterns. Analytic access patterns generally involve selecting specific fields and rarely if ever 'select *' as is more common in operational databases. Because of these differences in access patterns, operational databases (loosely, OLTP) benefit from the use of a row-oriented DBMS whereas analytics databases (loosely, OLAP) benefit from the use of a column-oriented DBMS. Unlike operational systems which maintain a snapshot of the business, data warehouses generally maintain an infinite history which is implemented through ETL processes that periodically migrate data from the operational systems over to the data warehouse.
Evolution in organization use
These terms refer to the level of sophistication of a data warehouse:
- Offline operational data warehouse
- Data warehouses in this stage of evolution are updated on a regular time cycle (usually daily, weekly or monthly) from the operational systems and the data is stored in an integrated reporting-oriented data
- Offline data warehouse
- Data warehouses at this stage are updated from data in the operational systems on a regular basis and the data warehouse data are stored in a data structure designed to facilitate reporting.
- On time data warehouse
- Online Integrated Data Warehousing represent the real time Data warehouses stage data in the warehouse is updated for every transaction performed on the source data
- Integrated data warehouse
- These data warehouses assemble data from different areas of business, so users can look up the information they need across other systems.[18]
See also
- Accounting intelligence
- Anchor modeling
- Business intelligence
- Business intelligence tools
- Data integration
- Data mart
- Data mining
- Data presentation architecture
- Data scraping
- Data warehouse appliance
- Database management system
- Decision support system
- Data vault modeling
- Executive information system
- Extract, transform, load
- Master data management
- Online analytical processing
- Online transaction processing
- Operational data store
- Semantic warehousing
- Snowflake schema
- Software as a service
- Star schema
- Slowly changing dimension
- Data warehouse automation
References
- ↑ Dedić, N. and Stanier C., 2016., "An Evaluation of the Challenges of Multilingualism in Data Warehouse Development" in 18th International Conference on Enterprise Information Systems - ICEIS 2016, p. 196.
- ↑ http://docs.oracle.com/html/E10312_01/dm_concepts.htm Data Mart Concepts
- 1 2 3 4 "Data Warehouse in Nutshell"
- ↑ http://datawarehouse4u.info/OLTP-vs-OLAP.html OLTP vs OLAP
- ↑ Patil, Preeti S.; Srikantha Rao; Suryakant B. Patil (2011). "Optimization of Data Warehousing System: Simplification in Reporting and Analysis". IJCA Proceedings on International Conference and workshop on Emerging Trends in Technology (ICWET). Foundation of Computer Science. 9 (6): 33–37.
- ↑ Marakas & O'Brien 2009
- ↑ "Modern Data Architecture | IDERA". www.idera.com. Retrieved 2016-09-18.
- 1 2 3 4 5 6 Rainer, R. Kelly (2012-05-01). Introduction to Information Systems: Enabling and Transforming Business, 4th Edition (Kindle Edition). Wiley. pp. 127, 128, 130, 131, 133.
- ↑ "The Story So Far". 2002-04-15. Retrieved 2008-09-21.
- 1 2 Kimball 2002, pg. 16
- ↑ "An architecture for a business and information system". IBM Systems Journal. 27: 60–80. doi:10.1147/sj.271.0060.
- ↑ Inmon, Bill (1992). Building the Data Warehouse. Wiley. ISBN 0-471-56960-7.
- 1 2 Kimball, Ralph (2011). The Data Warehouse Toolkit. Wiley. p. 237. ISBN 9780470149775.
- ↑ Hillard, Robert (2010). Information-Driven Business. Wiley. ISBN 978-0-470-62577-4.
- ↑ "Information Theory & Business Intelligence Strategy - Small Worlds Data Transformation Measure - MIKE2.0, the open source methodology for Information Development". Mike2.openmethodology.org. Retrieved 2013-06-14.
- ↑ "The Bottom-Up Misnomer - DecisionWorks Consulting". DecisionWorks Consulting. Retrieved 2016-03-06.
- ↑ Gartner, Of Data Warehouses, Operational Data Stores, Data Marts and Data Outhouses, Dec 2005
- ↑ "Data Warehouse".
Further reading
- Davenport, Thomas H. and Harris, Jeanne G. Competing on Analytics: The New Science of Winning (2007) Harvard Business School Press. ISBN 978-1-4221-0332-6
- Ganczarski, Joe. Data Warehouse Implementations: Critical Implementation Factors Study (2009) VDM Verlag ISBN 3-639-18589-7 ISBN 978-3-639-18589-8
- Kimball, Ralph and Ross, Margy. The Data Warehouse Toolkit Third Edition (2013) Wiley, ISBN 978-1-118-53080-1
- Linstedt, Graziano, Hultgren. The Business of Data Vault Modeling Second Edition (2010) Dan linstedt, ISBN 978-1-4357-1914-9
- William Inmon. Building the Data Warehouse (2005) John Wiley and Sons, ISBN 978-8-1265-0645-3