Penrose diagram
In theoretical physics, a Penrose diagram (named after mathematical physicist Roger Penrose) is a two-dimensional diagram capturing the causal relations between different points in spacetime. It is an extension of a Minkowski diagram where the vertical dimension represents time, and the horizontal dimension represents space, and slanted lines at an angle of 45° correspond to light rays. The biggest difference is that locally, the metric on a Penrose diagram is conformally equivalent to the actual metric in spacetime. The conformal factor is chosen such that the entire infinite spacetime is transformed into a Penrose diagram of finite size. For spherically symmetric spacetimes, every point in the diagram corresponds to a 2-sphere.
Basic properties
While Penrose diagrams share the same basic coordinate vector system of other space-time diagrams for local asymptotically flat spacetime, it introduces a system of representing distant spacetime by shrinking or "crunching" distances that are further away. Straight lines of constant time and space coordinates therefore become hyperbolas, which appear to converge at points in the corners of the diagram. These points represent "conformal infinity" for space and time.
Penrose diagrams are more properly (but less frequently) called Penrose–Carter diagrams (or Carter–Penrose diagrams), acknowledging both Brandon Carter and Roger Penrose, who were the first researchers to employ them. They are also called conformal diagrams, or simply spacetime diagrams.
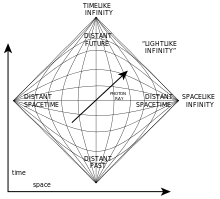
Two lines drawn at 45° angles should intersect in the diagram only if the corresponding two light rays intersect in the actual spacetime. So, a Penrose diagram can be used as a concise illustration of spacetime regions that are accessible to observation. The diagonal boundary lines of a Penrose diagram correspond to the "infinity" or to singularities where light rays must end. Thus, Penrose diagrams are also useful in the study of asymptotic properties of spacetimes and singularities. An infinite static Minkowski universe, coordinates is related to Penrose coordinates by:


The corners of the Penrose diamond, which represent the spacelike and timelike conformal infinities, are from the origin.

Black holes
Penrose diagrams are frequently used to illustrate the causal structure of spacetimes containing black holes. Singularities are denoted by a spacelike boundary, unlike the timelike boundary found on conventional space-time diagrams. This is due to the interchanging of timelike and spacelike coordinates within the horizon of a black hole (since space is uni-directional within the horizon, just as time is uni-directional outside the horizon). The singularity is represented by a spacelike boundary to make it clear that once an object has passed the horizon it will inevitably hit the singularity even if it attempts to take evasive action.
Penrose diagrams are often used to illustrate the hypothetical Einstein-Rosen bridge connecting two separate universes in the maximally extended Schwarzschild black hole solution. The precursors to the Penrose diagrams were Kruskal–Szekeres diagrams. (The Penrose diagram adds to Kruskal and Szekeres' diagram the conformal crunching of the regions of flat space-time far from the hole.) These introduced the method of aligning the event horizon into past and future horizons oriented at 45° angles (since one would need to travel faster than light to cross from the Schwarzschild radius back into flat spacetime); and splitting the singularity into past and future horizontally-oriented lines (since the singularity "cuts off" all paths into the future once one enters the hole).
The Einstein-Rosen bridge closes off (forming "future" singularities) so rapidly that passage between the two asymptotically flat exterior regions would require faster-than-light velocity, and is therefore impossible. In addition, highly blue-shifted light rays (called a "blue sheet") would make it impossible for anyone to pass through.
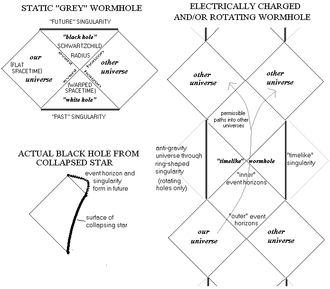
The maximally extended solution does not describe a typical black hole created from the collapse of a star, as the surface of the collapsed star replaces the sector of the solution containing the past-oriented "white hole" geometry and other universe.
While the basic space-like passage of a static black hole cannot be traversed, the Penrose diagrams for solutions representing rotating and/or electrically charged black holes illustrate these solutions' inner event horizons (lying in the future) and vertically oriented singularities, which open up what is known as a time-like "wormhole" allowing passage into future universes. In the case of the rotating hole, there is also a "negative" universe entered through a ring-shaped singularity (still portrayed as a line in the diagram) that can be passed through if entering the hole close to its axis of rotation. These features of the solutions are, however, not stable and not believed to be a realistic description of the interior regions of such black holes; the true character of their interiors is still an open question.
See also
References
- d'Inverno, Ray (1992). Introducing Einstein's Relativity. Oxford: Oxford University Press. ISBN 0-19-859686-3. See Chapter 17 (and various succeeding sections) for a very readable introduction to the concept of conformal infinity plus examples.
- Frauendiener, Jörg. "Conformal Infinity". Living Reviews in Relativity. Retrieved February 2, 2004.
- Carter, Brandon (1966). "Complete Analytic Extension of the Symmetry Axis of Kerr's Solution of Einstein's Equations". Phys. Rev. 141 (4): 1242–1247. Bibcode:1966PhRv..141.1242C. doi:10.1103/PhysRev.141.1242. See also on-line version (requires a subscription to access)
- Hawking, Stephen & Ellis, G. F. R. (1973). The Large Scale Structure of Space-Time. Cambridge: Cambridge University Press. ISBN 0-521-09906-4. See Chapter 5 for a very clear discussion of Penrose diagrams (the term used by Hawking & Ellis) with many examples.
- Kaufmann, William J. III (1977). The Cosmic Frontiers of General Relativity. Little Brown & Co. ISBN 0-316-48341-9. Really breaks down the transition from simple Minkowski diagrams, to Kruskal-Szekeres diagrams to Penrose diagrams, and goes into much detail the facts and fiction concerning wormholes. Plenty of easy to understand illustrations. A less involved, but still very informative book is his William J. Kaufmann (1979). Black Holes and Warped Spacetime. W H Freeman & Co (Sd). ISBN 0-7167-1153-2.
External links
![]() Media related to Penrose diagrams at Wikimedia Commons
Media related to Penrose diagrams at Wikimedia Commons