Pine-Richland School District
| Pine-Richland School District | |
|---|---|
 | |
| Location | |
|
702 Warrendale Road Pittsburgh, Pennsylvania, Allegheny County United States | |
| Information | |
| Type | Public school |
| Established | 1958 |
| Superintendent | Dr. Brian Miller, July 2013-June 30, 2017 [1][2] (salary $153,500) |
| Administrator |
Dr. Michael Pasquinelli, Asst Superintendent |
| Grades | K-12 |
| Number of students | 4,650 students (2013),[3] 4,624 (2011),[4] 4,523 |
| • Kindergarten | 268 (2013) 259 |
| • Grade 1 | 288 (2013) 349 |
| • Grade 2 | 334 (2013), 355 |
| • Grade 3 | 361 (2013), 323 |
| • Grade 4 | 346 (2013) 365 |
| • Grade 5 | 359 (2013), 385 |
| • Grade 6 | 391 (2013), 360 |
| • Grade 7 | 376 (2013), 357 |
| • Grade 8 | 362 (2013), 382 |
| • Grade 9 | 391 (2013), 417 |
| • Grade 10 | 391 (2013), 387 |
| • Grade 11 | 385 (2013), 382 |
| • Grade 12 | 389 (2013), 381 |
| Student to teacher ratio | Student-Teacher Ratio 15:1 |
| Color(s) | Green, White, Gold |
| Mascot | Ram |
| Budget |
$69,541,750 (2013-14)[5] |
| Tuition | for nonresident and charter school students ES - $9,473.72, HS -$9,633.40[7] |
| Information |
Mission & Vision - The district working to finalize a new Strategic Plan and submitted a comprehensive plan to the state. Vision - Our Ideal Future-Pine-Richland School District will be a recognized leader in education providing a customized learning environment to a growing and changing community. |
| Website | http://www.pinerichland.org/Domain/1 |
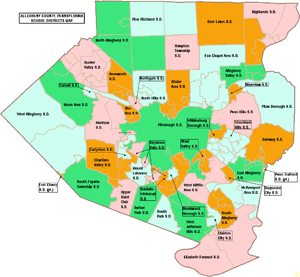
The Pine-Richland School District is a mid-sized, suburban public school district serving northern Pittsburgh in Allegheny County, Pennsylvania. Pine-Richland School District encompasses approximately 31 square miles (80 km2) serving residents of Pine Township and of Richland Township.
In 2010, the US Census Bureau reported an increased population to 22,601 people. According to 2000 federal census data the District's resident population was 16,914 people. In 2009, the district residents’ per capita income was $29,680, while the median family income was $75,982.[8] In the Commonwealth, the median family income was $49,501[9] and the United States median family income was $49,445, in 2010.[10]
Pine-Richland School District operates three primary schools for grades K-3: Wexford Elementary School, Hance Elementary School and Richland Elementary School. The district operates Eden Hall Upper Elementary School for grades 4-6; Pine-Richland Middle School for grades 7-8, and Pine-Richland High School for grades 9-12.
Pine-Richland High school students may choose to attend A. W. Beattie Career Center for vocational training. The Allegheny Intermediate Unit IU3 provides the district with a wide variety of services like specialized education for disabled students and hearing, speech and visual disability services and professional development for staff and faculty.
History
The Pine-Richland School District has a grand and honored history. Single room schoolhouses gave way to a district with six school buildings. The district's first graduating class was the Class of 1958. The first year appropriately produced 58 graduates from the Richland Jr./Sr. High School.
Today's Pine-Richland High School graduates more than 360 students.
Math and science have become a significant focus during the district's early years, and today the focus is on Science, Technology, Engineering, Arts and Mathematics (STEAM).
Although classrooms look somewhat different today than yesterday with the infusion of technology and customized learning, the intense caring for children and quality education on behalf of the school community remains constant over time.
Pine-Richland was first known as the Pine Richland Joint School District in 1958. It was then changed to Babcock School District in 1971 in honor of the Babcock family who donated land to the school district. In the fall of 1982 the name was changed to the current name of Pine-Richland School District.
Timeline
See timeline of the Pine-Richland School District here: http://pinerichland.schoolwires.net/Page/141
Governance
Pine-Richland School District is governed by 9 individually elected board members (serve four-year terms), the Pennsylvania State Board of Education, the Pennsylvania Department of Education and the Pennsylvania General Assembly.[11] The federal government controls programs it funds like Title I funding for low-income children in the Elementary and Secondary Education Act and through the No Child Left Behind Act, which mandates the district focus its resources on student success in acquiring reading skills and math skills. The Superintendent and Business Manager are appointed by the school board. The Superintendent is the chief administrative officer with overall responsibility for all aspects of operations, including education and finance. The Business Manager is responsible for budget and financial operations. Neither of these officials are voting members of the School Board. The School Board enters into individual employment contracts for these positions. In Pennsylvania, public school districts are required to give 150 days notice to the Superintendent regarding renewal of the employment contract. The board makes use of various media, including the district's website, to communicate with the community as well as video tape board meetings and airs segments on cable.
Academic achievement
The district releases an annual Academic Achievement Report.[12] The Academic Achievement Report contains information about student performance on a series of standardized tests during the 2013-2014 school year. When possible, five years of data is included in the report and analyzed for levels of achievement, trends, and growth. Comparison information is also provided for each assessment.
To the greatest extent possible, this summative data is provided in a visual manner to illustrate levels, trends, and comparisons of performance. Disaggregated results help provide further insight into student achievement levels (e.g., gender and special education). The report looks at:
- Pennsylvania System of School Assessment (PSSA)
- Keystone Exams
- School Performance Profile
- Pennsylvania Value-Added Assessment System (PVAAS)
- Scholastic Aptitude Test (SAT)
- American College Test (ACT)
- Advanced Placement (AP) Exams Visit http://www.pinerichland.org/academicreport for an updated look at the above data.
Pine-Richland School District was ranked 23rd out of 498 Pennsylvania school districts by the Pittsburgh Business Times in 2015.[13] The ranking was based on student academic achievement as demonstrated on the last three years of the PSSAs for: reading, writing math and science.[14] The PSSAs are given to all children in grades 3rd through 8th and the 11th grade in high school. Adapted examinations are given to children in the special education program.
Western Pennsylvania local ranking Pine-Richland School District was ranked 8th out of 105 western Pennsylvania school districts, in 2015, by the Pittsburgh Business Times. The ranking was based on the last three years of student academic performance on the PSSAs on: math, reading, writing and science.[15] (includes 105 districts in: Allegheny County, Armstrong County, Beaver County, Butler County, Fayette County, Washington County and Westmoreland County excludes Duquesne City SD & Midland Borough SD due to no high schools)
Dual enrollment
The Pine-Richland High School offers a dual enrollment program. This state program permits high school students to take courses, at local higher education institutions, to earn college credits. Students remain enrolled at their high school. The courses count towards high school graduation requirements and towards earning a college degree. The students continue to have full access to activities and programs at their high school. The college credits are offered at a deeply discounted rate. The state offered a small grant to assist students in costs for tuition, fees and books.[16] In 2011, Pine-Richland Received a grant of $5,691. Under the Pennsylvania Transfer and Articulation Agreement, many Pennsylvania colleges and universities accept these credits for students who transfer to their institutions.[17] Under state rules, other students that reside in the district, who attend a private school, a charter school or are homeschooled are eligible to participate in this program.[18] In 2010, Governor Edward Rendell eliminated the grants to students, from the Commonwealth, due to a state budget crisis.
College remediation rate
According to a Pennsylvania Department of Education study released in January 2009, 21% of the Pine-Richland High School graduates required remediation in mathematics and or reading before they were prepared to take college level courses in the Pennsylvania State System of Higher Education or community colleges.[19] Less than 66% of Pennsylvania high school graduates, who enroll in a four-year college in Pennsylvania, will earn a bachelor's degree within six years. Among Pennsylvania high school graduates pursuing an associate degree, only one in three graduate in three years.[20] Per the Pennsylvania Department of Education, one in three recent high school graduates who attend Pennsylvania's public universities and community colleges takes at least one remedial course in math, reading or English.
SAT scores
In 2013, Pine-Richland School District students took the SAT exams. The District's Verbal Average Score was 320. The Math average score was 309.5. The Writing average score was 422.The College Board reported that statewide scores were: 494 in reading, 504 in math and 482 in writing. The nationwide SAT results were the same as in 2012.[62]
Graduation rate
In 2015, the graduation rate was 98%. In 2013, Pine-Richland School District’s graduation rate was 96.7%. In 2012, the District’s graduation rate was 97%.[26] In 2011, the graduation rate was 98%.[27] In 2010, the Pennsylvania Department of Education issued a new, 4-year cohort graduation rate. Pine-Richland High School's rate was 98% for 2010.[28]
Special education
In December 2011, the Pine-Richland School District administration reported that 601 pupils or 13% of the district's pupils received Special Education services, with 31%% of the identified students having a specific learning disability.[21] In December 2009, the District administration reported that 535 pupils or 14.6% of the District's pupils received Special Education services, with 33% of the identified students having a specific learning disability. Special education services in the Commonwealth are provided to students from ages three years to 21 years old. In the 2010-11 school year, the total student enrollment was more than 1.78 million students with approximately 275,000 students eligible for special education services. Among these students 18,959 were identified with mental retardation and 21,245 students with autism.[22] The largest group of students are identified as Specific Learning Disabilities 126,026 students (46.9 percent) and Speech or Language Impairments with 43,542 students (16.2 percent).
In order to comply with state and federal Individuals with Disabilities Education Act rules and regulations, the school district engages in identification procedures to ensure that eligible students receive an appropriate educational program consisting of special education and related services, individualized to meet student needs. At no cost to the parents, these services are provided in compliance with state and federal law; and are reasonably calculated to yield meaningful educational benefit and student progress [23] To identify students who may be eligible for special education services, various screening activities are conducted on an ongoing basis. These screening activities include: review of group-based data (cumulative records, enrollment records, health records, report cards, ability and achievement test scores); hearing, vision, motor, and speech/language screening; and review by the Special Education administration.[24] When screening results suggest that the student may be eligible, the District seeks parental consent to conduct a multidisciplinary evaluation. Parents who suspect their child is eligible may verbally request a multidisciplinary evaluation from a professional employee of the District or contact the district's Special Education Department.[25][26] The IDEA 2004 requires each school entity to publish a notice to parents, in newspapers or other media, including the student handbook and website regarding the availability of screening and intervention services and how to access them.
In 2010, the state of Pennsylvania provided $1,026,815,000 for Special Education services. This funding is in addition to the state's basic education per pupil funding, as well as, all other state and federal funding.[27] The Special Education funding structure is through the federal Individuals with Disabilities Education Act (IDEA) funds and state appropriations. IDEA funds are appropriated to the state on an annual basis and distributed through intermediate units (IUs) to school districts, while state funds are distributed directly to the districts. Total funds that are received by school districts are calculated through a formula. The Pennsylvania Department of Education oversees four appropriations used to fund students with special needs: Special Education; Approved Private Schools; Pennsylvania Chartered Schools for the Deaf and Blind; and Early Intervention. The Pennsylvania Special Education funding system assumes that 16% of the district’s students receive special education services. It also assumes that each student’s needs accrue the same level of costs.[28] Over identification of students, in order to increase state funding, has been an issue in the Commonwealth. Some districts have more than 20% of its students receiving special education services while others have 10% supported through special education.[29] The state requires each public school district and charter school to have a three-year special education plan to meet the unique needs of its special education students.[30] In 2012, the Obama Administration's US Department of Education issued a directive that schools include students with disabilities in extracurricular activities, including sports.[31]
The Pine-Richland School District received a $1,497,202 supplement for special education services in 2010.[32] For the 2011-12, 2012–13 and 2013-14 school years, all Pennsylvania public school districts received the same level of funding for special education that they received in 2010-11. This level funding is provided regardless of changes in the number of pupils who need special education services and regardless of the level of services the respective students required.[33][34] Additionally, the state provides supplemental funding for extraordinarily impacted students. The District must apply for this added funding.
Gifted education
The Pine-Richland School District Administration reported 10% of its students were gifted in 2009. The highest percentage of gifted students reported among all 500 school districts and 100 public charter schools in Pennsylvania was North Allegheny School District with 15.5% of its students identified as gifted.[35] By law, the district must provide mentally gifted programs at all grade levels. The referral process for a gifted evaluation can be initiated by teachers or parents by contacting the student’s building principal and requesting an evaluation. All requests must be made in writing. To be eligible for mentally gifted programs in Pennsylvania, a student must have a cognitive ability of at least 130 as measured on a standardized ability test by a certified school psychologist. Other factors that indicate giftedness will also be considered for eligibility.[36][37]
Wellness policy
Pine-Richland School Board established a district wellness policy in 2010.[38] The policy deals with nutritious meals served at school, the control of access to some foods and beverages during school hours, age appropriate nutrition education for all students, and physical education for students K-12. The policy is in response to state mandates and federal legislation (P.L. 108 – 265). The law dictates that each school district participating in a program authorized by the Richard B. Russell National School Lunch Act (42 U.S.C. 1751 et seq) or the Child Nutrition Act of 1966 (42 U.S.C. 1771 et seq) "shall establish a local school wellness policy by School Year 2006." Most districts identified the superintendent and school food service director as responsible for ensuring local wellness policy implementation.[39]
The legislation placed the responsibility of developing a wellness policy at the local level so the individual needs of each district can be addressed. According to the requirements for the Local Wellness Policy, school districts must set goals for nutrition education, physical activity, campus food provision, and other school-based activities designed to promote student wellness. Additionally, districts were required to involve a broad group of individuals in policy development and to have a plan for measuring policy implementation. Districts were offered a choice of levels of implementation for limiting or prohibiting low nutrition foods on the school campus. In final implementation these regulations prohibit some foods and beverages on the school campus.[40] The Pennsylvania Department of Education required the district to submit a copy of the policy for approval.
Pine-Richland School District offers a free school breakfast and free or reduced-price lunch to children in low income families. All students attending the school can eat breakfast and lunch. Children from families with incomes at or below 130 percent of the federal poverty level are provided a breakfast and lunch at no cost to the family. Children from families with incomes between 130 and 185 percent of the federal poverty level can be charged no more than 30 cents per breakfast. A foster child whose care and placement is the responsibility of the State or who is placed by a court with a caretaker household is eligible for both a free breakfast and a free lunch. Runaway, homeless and Migrant Youth are also automatically eligible for free meals.[41] The meals are partially funded with federal dollars through the United States Department of Agriculture.[42]
In 2013, the USDA issued new restrictions to foods in public schools. The rules apply to foods and beverages sold on all public school district campuses during the day. They limit vending machine snacks to a maximum of 200 calories per item. Additionally, all snack foods sold at school must meet competitive nutrient standards, meaning they must have fruits, vegetables, dairy or protein in them or contain at least 10 percent of the daily value of fiber, calcium, potassium, and Vitamin D.[43] In order to comply with the Healthy, Hunger-Free Kids Act of 2010 all US public school districts are required to raise the price of their school lunches to $2.60 regardless of the actual cost of providing the lunch.[44] In 2014, President Obama ordered a prohibition of advertisements for unhealthy foods on public school campuses during the school day.[45]
Pine-Richland School District provides health services as mandated by the Commonwealth and the federal government. Nurses are available in each building to conduct annual health screenings (data reported to the PDE and state Department of Health) and to dispense prescribed medications to students during the school day. Students can be excluded from school unless they comply with all the State Department of Health’s extensive immunization mandates. School nurses monitor each pupil for this compliance.[46] Nurses also monitor each child's weight.
Highmark Healthy High 5 grant
In 2009, the Pine-Richland School District received funding through a Highmark Healthy High 5 grant. Pine-Richland Middle School received $9,117 which was used to purchase fitness equipment and nutritional materials for the Middle School Wellness Challenge. Hance elementary School received $3,500 which was used support nutrition education and various physical activities including Dance, Dance Revolution for students in grades 1-3.[47] Beginning in 2006, Highmark Foundation engaged in a 5-year, $100 million program to promote lifelong healthy behaviors in children and adolescents through local nonprofits and schools.
Pine-Richland School District participated in Highmark Healthy High 5 Health eTools for Schools which enabled mobile data collection of pertinent health and physical fitness screening data on students K-12 in a database held by InnerLink, Inc. in Lancaster, Pennsylvania. Health eTools for Schools also provided interdisciplinary research-based curriculum in nutrition, physical education and physical activity to participating districts. The program was discontinued in 2013.[48]
Budget
Pennsylvania public school districts budget and expend funds according to procedures mandated by the General Assembly and the Pennsylvania Department of Education (PDE). An annual operating budget is prepared by school district administrative officials. A uniform form is furnished by the PDE and submitted to the board of school directors for approval prior to the beginning of each fiscal year on July 1.
Under Pennsylvania’s Taxpayer Relief Act, Act 1 of the Special Session of 2006, all public school districts of the first class A, second class, third class and fourth class must adopt a preliminary budget proposal. The proposal must include estimated revenues and expenditures and the proposed tax rates. This proposed budget must be considered by the Board no later than 90 days prior to the date of the election immediately preceding the fiscal year. The preliminary budget proposal must also be printed and made available for public inspection at least 20 days prior to its adoption. The board of school directors may hold a public hearing on the budget, but are not required to do so. The board must give at least 10 days’ public notice of its intent to adopt the final budget according to Act 1 of 2006.[49]
In 2012, the average teacher salary in Pine-Richland School District was $61,622.96 a year, while the cost of the benefits teachers received was $23,490.54 per employee, for a total annual average teacher compensation of $85,113.50.[50] The teachers' salaries in Pine-Richland School District ranged from $43,661 to $95,650 ($29 to $64 per hour), with 20 percent of the teaching staff, or 66 teachers, annually receives more than $92,000 in pay. The teacher union contract expired June 30, 2012. In 2011, the District employed 365 teachers with an average salary of $62,868 and a top salary of $135,200.[51]
In 2009, the Pine-Richland School District reported employing 400 teachers and administrators with a median salary of $58,394 and a top salary of $130,000.[52] The teacher’s work day is 7 hours 45 minutes with 186 days in the contract year. Additionally, the teachers receive a defined benefit pension, health insurance (teachers pay 5 percent of the premium costs per month for health insurance), professional development reimbursement, paid personal days, 10 paid sick days, and other benefits.[53] In 2006, the Pine-Richland School District reported employing 320 teachers.[54]
Per pupil spending Pine-Richland School District administrative costs per pupil in 2008 was $703.78 per pupil. The lowest administrative cost per pupil in Pennsylvania was $398 per pupil.[55] The Pennsylvania School Boards Association collects and maintains statistics on salaries of public school district employees in Pennsylvania. According to the association's report, the average salary for a superintendent, for the 2007-08 school year, was $122,165. Superintendents and administrators receive a benefit package commensurate with that offered to the district's teachers' union.[56] According to PSBA, the median Superintendent salary rose to over $130,000 in 2011.[57] In November 2012, Pine_Richland school Board voted to not renew then superintendent Mary Bucci's employment contract. She retired in January 2013. She acknowledged difficulty communicating with members of the Board.[58] The Board hired Dr. Brian R. Miller as superintendent effective July 1, 2013, with a starting salary of $153,500 a year.
In 2008, the Pine-Richland School District administration reported that its per pupil spending was $12,471 which ranked 224th among Pennsylvania's then 501 public school districts. In 2010, the District’s per pupil spending had increased to $15,942.23 which was 88th in Pennsylvania.[59] In 2011, Pennsylvania’s per pupil spending was $13,467, ranking 6th in the United States.[60] In 2007, the Pennsylvania per pupil total expenditures was reported as $12,759.[61]
The U.S. Census Bureau reported that Pennsylvania spent $8,191 per pupil in school year 2000-01.[62] In 2007, the Pennsylvania per pupil total expenditures was reported as $12,759.[63] Among the fifty states, Pennsylvania’s total per pupil revenue (including all sources) ranked 11th at $15,023 per student, in 2008-09.[64] Pennsylvania’s total revenue per pupil rose to $16,186 ranking 9th in the nation in 2011.[65]
Reserves In 2008, the Pine-Richland School District reported a balance of $1,727,668, in its unreserved-designated fund. The unreserved-undesignated fund balance was reported as $4,940,691.[66] In 2010, Pine-Richland School District Administration reported an increase to $5,031,144 in the unreserved-undesignated fund balance. The District also reported $1,805,050 in its unreserved-designated fund in 2010. In 2013, Pine-Richland School District Administration reported $4,900,765 in the unreserved-undesignated fund balance. The District also reported $3,744,319 in its unreserved-designated fund in 2010. Total reserves were $8,645,084.[67] Pennsylvania public school district reserve funds are divided into two categories – designated and undesignated. The undesignated funds are not committed to any planned project. Designated funds and any other funds, such as capital reserves, are allocated to specific projects. School districts are required by state law to keep 5 percent of their annual spending in the undesignated reserve funds to preserve bond ratings. According to the Pennsylvania Department of Education, from 2003 to 2010, as a whole, Pennsylvania school districts amassed nearly $3 billion in reserved funds.[68] In 2005, the total reserve funds held by Pennsylvania public school districts was $1.9 billion.[69] By 2013, reserves held by Pennsylvania public school districts, as a whole, had increased to over $3.8 billion.[70]
Interest swap In November 2009, Auditor General Jack Wagner reported that Pine-Richland School District entered into high risk Interest swap deals under Act 23 of 2003.[71] By 2009, 107 Districts out of 500 Pennsylvania school districts entered into these transactions. Seven Berks County public school districts also entered into swap deals with investment banks. It was found that fees that were characterized as being paid by the investment banks were actually ultimately charged to the District.[72]
Audit In June 2013, the Pennsylvania Auditor General conducted a performance audit of the Pine-Richland School District. The findings were reported to the School Board and the District’s administration. It was found that the District did implement recommendations related to certification deficiencies and logical access control weaknesses.[73] In January 2011, another audit found certification issues - two elementary teachers were assigned to positions for which their provisional certificate may have expired. It was the responsibility of the superintendent to assure that the District's teachers have appropriate certification. The District was fined by the PDE.
Tuition Students who live in the Pine-Richland School District's attendance area may choose to attend one of Pennsylvania's 157 public charter schools. A student living in a neighboring public school district or a foreign exchange student may seek admission to Pine-Richland School District. For these cases, the Pennsylvania Department of Education sets an annual tuition rate for each school district. It is the amount the public school district pays to a charter school for each resident student that attends the charter and it is the amount a nonresident student's parents must pay to attend the District's schools. The 2012 tuition rates are Elementary School - $11,204.66, High School - $7,927.55.[74]
Pine_Richland School District is funded by a combination of: a local earned income tax 1% of earned income and 1% of net profits,[75] a property tax, a $10 per capita tax, a real estate transfer tax 0.5%, coupled with substantial funding from the Commonwealth of Pennsylvania and the federal government.[76] Grants can provide an opportunity to supplement school funding without raising local taxes. Interest earnings on accounts also provide nontax income to the District. In the Commonwealth of Pennsylvania, pension income and Social Security income are exempted from state personal income tax and local earned income tax, regardless of the level of the individual’s personal wealth.[77] The average Pennsylvania public school teacher pension in 2011 exceeds $60,000 a year plus they receive federal Social Security benefits: both are free of Pennsylvania state income tax and local income tax which funds local public schools.[78]
State basic education funding
According to a report from Representative Todd Stephens office, Pine-Richland School District receives 15.2% of its annual revenue from the state.[79]
For the 2013-14 school year’’’, the Pine-Richland School District received a 4.8% increase or $4,761,701 in Pennsylvania Basic Education Funding. This is $216,789 more than its 2012-13 state BEF to the District. Additionally, Pine-Richland School District received $113,875 in Accountability Block Grant funding to focus on academic achievement and level funding for special education services. Among the public school districts in Allegheny County, South Fayette Township School District received the highest percentage increase in BEF at 5.5%. The District has the option of applying for several other state and federal grants to increase revenues. The Commonwealth’s budget increased Basic Education Funding statewide by $123 million to over $5.5 billion. Most of Pennsylvania’s 500 public school districts received an increase of Basic Education Funding in a range of 0.9% to 4%. Eight public school districts received exceptionally high funding increases of 10% to 16%. The highest increase in state funding was awarded to Austin Area School District which received a 22.5% increase in Basic Education Funding.[80] The highest percent of state spending per student is in the Chester-Upland district, where roughly 78 percent comes from state coffers. In Philadelphia, it is nearly 49 percent.[81] As a part of the education budget, the state provided the PSERS (Pennsylvania school employee pension fund) with $1,017,000,000 and Social Security payments for school employees of $495 million.[82]
For the 2012-13 school year, the Pine-Richland School District received $4,544,912.[83] The Governor's Executive Budget for 2012-2013 included $9.34 billion for kindergarten through 12th grade public education, including $5.4 billion in basic education funding, which was an increase of $49 million over the 2011-12 budget. In addition, the Commonwealth provided $100 million for the Accountability Block Grant (ABG) program. Pine-Richland School District received $113,875 in Accountability Block Grant funding to focus on academic achievement. The state also provided a $544.4 million payment for School Employees’ Social Security and $856 million for School Employees’ Retirement fund called PSERS.[84] This amount was a $21,823,000 increase (0.34%) over the 2011-2012 appropriations for Basic Education Funding, School Employees' Social Security, Pupil Transportation, Nonpublic and Charter School Pupil Transportation. Since taking office, Corbett’s first two budgets have restored more than $918 million in support of public schools, compensating for the $1 billion in federal stimulus dollars lost at the end of the 2010-11 school year.
In 2011-12, the Pine-Richland School District received a $4,544,911 allocation, of state Basic Education Funding.[85][86] Additionally, the Pine-Richland School District received $113,875 in Accountability Block Grant funding. The enacted Pennsylvania state Education budget included $5,354,629,000 for the 2011-2012 Basic Education Funding appropriation. This amount was a $233,290,000 increase (4.6%) over the enacted State appropriation for 2010-2011.[87] The highest increase in state basic education funding was awarded to Duquesne City School District of Allegheny County, which got a 49% increase in state funding for 2011-12.[88] In 2010, the district reported that 227 students received free or reduced price lunches, due to the family meeting the federal poverty level.[89] Some public school Districts experienced a reduction in funding due to the loss of federal stimulus funding which ended in 2011.
In the 2010-11 budget year, the Commonwealth of Pennsylvania provided a 5.27% increase in Basic Education Funding for a total of $4,900,555. Among the districts in Allegheny County, the highest increase went to South Fayette Township School District which got an 11.32% increase. One hundred fifty Pennsylvania school districts received the base 2% increase. The highest increase in 2010-11 went to Kennett Consolidated School District in Chester County, which received a 23.65% increase in state funding.[90] Fifteen (15) Pennsylvania public school districts received a BEF increase of greater than 10%. The state's hold harmless policy regarding state basic education funding continued where each district received at least the same amount as it received the prior school year, even when enrollment had significantly declined. The amount of increase each school district received was set by Governor Edward Rendell and then Secretary of Education Gerald Zahorchak, as a part of the state budget proposal given each February. This was the second year of Governor Rendell’s policy to fund some public school districts at a far greater rate than others.[91]
In the 2009-10 budget year, the Commonwealth of Pennsylvania provided a 2.44% increase in Basic Education Funding for a total of $4,656,203 Among the districts in Allegheny County, the highest increase went to Chartiers Valley School District which got an 8.19%. Ninety (90) Pennsylvania public school districts received the base 2% increase, with 21 of them in Allegheny County. Muhlenberg School District in Berks County received a 22.31% increase in state basic education funding in 2009.[92] The amount of increase each school district received was set by Governor Edward G. Rendell and the Secretary of Education Gerald Zahorchak, as a part of the state budget proposal.[93]
The state Basic Education Funding to the District in 2008-09 was $4,545,352.05. According to the Pennsylvania Department of Education, 188 district students received free or reduced-price lunches due to low family poverty, in the 2007–2008 school year.[94] According to the U.S. Census Bureau, Pennsylvania spent $7,824 Per Pupil in the year 2000. This amount increased up to $12,085 by the year 2008.[95][96]
Accountability Block Grants
Beginning in 2004-2005, the state launched the Accountability Block Grant school funding. This program has provided $1.5 billion to Pennsylvania’s school districts. The Accountability Block Grant program requires that its taxpayer dollars are focused on specific interventions that are most likely to increase student academic achievement. These interventions include: teacher training, All Day Kindergarten, lower class size K-3rd grade, literacy and math coaching programs that provide teachers with individualized job-embedded professional development to improve their instruction, before or after school tutoring assistance to struggling students. For 2010-11, the district applied for and received $309,085 in addition to all other state and federal funding. The district uses the funding to provide Intensive instruction for struggling students during the school day and for teacher training.[97][98] In 2009, 100% of the kindergarteners in Pine-Richland School District attended half-day kindergarten.[99]
Classrooms for the Future grant
The Classroom for the Future state program provided districts with hundreds of thousands of extra state funding to buy laptop computers for each core curriculum high school class (English, Science, History, Math) and paid for teacher training to optimize the computers use. The program was funded from 2006 to 2009. The Pine-Richland School District received $314,383 in 2006-07. In 2007-08, the district received $300,000. Pine-Richland School District received 45,413 in 2008-09.[100] Among the public school districts in Allegheny County the highest award was given to Highlands School District which received $835,286. The highest funding statewide was awarded to Philadelphia City School District in Philadelphia County - $9,409,073. The grant program was discontinued by Governor Edward Rendell as part of the 2009-10 state budget.
Other grants
The Pine-Richland School District did not participate in: Pennsylvania Department of Environmental Protection's Environmental Education annual grants, PA Science Its Elementary grants (discontinued effective with 2009-10 budget by Governor Rendell), Education Assistance Grants, 2012 Striving Readers Comprehensive Literacy grant, 2012 and 2013 nor Pennsylvania Hybrid Learning Grants,[101] nor the federal 21st Century Learning grants.
Grable Foundation grant
In September 2009, Pine-Richland School District received a $10,000 grant from the Grable Foundation, for a mentoring program. The school's crew team, along with the Three Rivers Rowing Association, will develop a fitness program for at-risk and handicapped youth. the foundation this year invited Allegheny County's 42 suburban school districts to apply for grants of up to $10,000 for projects that encourage the involvement of community groups with the schools. Eighteen public school districts received grants ranging from $3,000 to $10,000. Most of the money will be used for arts education or science and environmental projects. The Grable Foundation was founded in 1976 by Minnie Grable, widow of Erett Grable, a Pittsburgh businessman who founded Rubbermaid Inc.[102]
Federal Stimulus grant
The Pine-Richland School District received an extra $962,173 in American Recovery and Reinvestment Act of 2009 (ARRA) - Federal Stimulus money to be used in specific programs like special education and meeting the academic needs of low-income students.[103][104] The funding was limited to the 2009-10 and 2010-2011 school years.[105] Due to the temporary nature of the funding, schools were repeatedly advised to use the funds for one time expenditures like: acquiring equipment, making repairs to buildings, training teachers to provide more effective instruction or purchasing books and software.
Race to the Top grant
Pine-Richland School District officials did not apply for the federal Race to the Top grant which would have provided under one-half million dollars, in additional federal funding, to improve student academic achievement.[106] Participation required the administration, the school board and the local teachers' union to sign an agreement to prioritize improving student academic success. In Pennsylvania, 120 public school districts and 56 charter schools agreed to participate.[107] Pennsylvania was not approved for the grant. The failure of districts to agree to participate was cited as one reason that Pennsylvania was not approved.[108][109][110]
Real estate taxes
Property tax rates in 2015-16 were set by the Pine-Richland School Board at 19.2083 mills. A mill is $1 of tax for every $1,000 of a property's assessed value. Irregular property reassessments have become a serious issue in the commonwealth as it creates a significant disparity in taxation within a community and across a region.[111] Property taxes, in the Commonwealth of Pennsylvania, apply only to real estate - land and buildings. The property tax is not levied on cars, business inventory, or other personal property. Certain types of property are exempt from property taxes, including: places of worship, places of burial, private social clubs, charitable and educational institutions and all government property (local, state and federal). Additionally, service related, disabled US military veterans may seek an exemption from paying property taxes. Pennsylvania school district revenues are dominated by two main sources: 1) Property tax collections, which account for the vast majority (between 75-85%) of local revenues; and 2) Act 511 tax collections, which are around 15% of revenues for school districts.[112] When a Pennsylvania public school district includes municipalities in two counties, each of which has different rates of property tax assessment, a state board equalizes the tax rates between the counties.[113] In 2010, miscalculations by the State Tax Equalization Board (STEB) were widespread in the Commonwealth and adversely impacted funding for many school districts, including those that did not cross county borders.[114] The average yearly property tax paid by Schuylkill County residents amounts to about 4.09% of their yearly income. Schuylkill County ranked 209th out of the 3143 United States counties for property taxes as a percentage of median income.[115] According to a report prepared by the Pennsylvania Department of Education, the total real estate taxes collected by all school districts in Pennsylvania rose from $6,474,133,936 in 1999-00 to $10,438,463,356 in 2008-09 and to $11,153,412,490 in 2011.[116] Property taxes in Pennsylvania are relatively high on a national scale. According to the Tax Foundation, Pennsylvania ranked 11th in the U.S. in 2008 in terms of property taxes paid as a percentage of home value (1.34%) and 12th in the country in terms of property taxes as a percentage of income (3.55%).[117]
Property tax relief
In 2014, Pine-Richland School District approved homestead property tax relief.[118] The relief was subtracted from the total annual school property tax bill. Property owners apply for the relief through the county Treasurer's office. Farmers can qualify for a farmstead exemption on building used for agricultural purposes. The farm must be at least 10 contiguous acres (40,000 m2) and must be the primary residence of the owner. Farmers can qualify for both the homestead exemption and the farmstead exemption. The amount of property tax relief each Pennsylvania public school district receives is announced by the PDE in May of each year. The amount of tax relief is dependent on the total tax revenue collected on the casino slots in the previous year. Thirty five percent of the slots tax revenues are used for property tax relief. In County, the highest tax relief went to School District which was set at $.[119] The highest property tax relief provided, among Pennsylvania school districts, goes to the homesteads of Chester Upland School District in Delaware County which received $632 per approved homestead in 2010. Chester-Upland School District has consistently been the top recipient since the programs inception.[120] The tax relief was started by Governor Rendell with passage of the gaming law. Rendell promised taxpayers substantial property tax relief from legalized gambling.
In Allegheny County, 60.82% of eligible property owners applied for property tax relief in 2009. This was among the mid level participation rates in Pennsylvania.[121]
In Pennsylvania, the homestead exclusion reduces the assessed values of homestead properties, reducing the property tax on these homes. The homestead exclusion allows homeowners real property tax relief of up to one half of the median assessed value of homesteads in the taxing jurisdiction (county, school district, city, borough, or township).[122]
Additionally, the Pennsylvania Property Tax/Rent Rebate program is provided for low income Pennsylvanians aged 65 and older; widows and widowers aged 50 and older; and people with disabilities age 18 and older. The income limit is $35,000 for homeowners. The maximum rebate for both homeowners and renters is $650. Applicants can exclude one-half (1/2) of their Social Security income, consequently people who have an income of substantially more than $35,000 still qualify for a rebate. Individuals must apply annually for the rebate. This tax rebate can be taken in addition to Homestead/Farmstead Property Tax Relief. In 2012, the Pennsylvania Secretary of the Treasury reported issuing more than half a million property tax rebates totaling $238 million.[123] The Property tax/rent rebate program is funded by revenues from the Pennsylvania Lottery. In 2012, these property tax rebates were increased by an additional 50 percent for senior households in the state, so long as those households have incomes under $30,000 and pay more than 15% of their income in property taxes.[124]
Extracurriculars
The District offers a wide variety of clubs, activities and an extensive, costly sports program. Eligibility for participation is determined by school board policy and in compliance with standards set by the Pennsylvania Interscholastic Athletic Association (PIAA). The District charges a $100 per year fee for students who participate in extracurriculars.
By Pennsylvania law, all K-12 students residing in the district, including those who attend a private nonpublic school, cyber charter school, charter school and those homeschooled, are eligible to participate in the extracurricular programs including all athletics. They must meet the same eligibility rules as the students enrolled in the district's schools.[125]
Sports
The District funds:
- Varsity
|
|
- Middle School Sports
|
|
According to PIAA directory July 2013 [126]
References
- ↑ Trozzo, Sandy., Pine-Richland hires Miller as new superintendent, The Post Gazette, April 11, 2013
- ↑ Pennsylvania Department oF Education, Education Names and Addresses, 2013
- ↑ Pennsylvania Department of Education (October 4, 2013). "School Performance Fast Facts- Pine-Richland School District".
- ↑ National Center for Education Statistics, Common Core of Data - Pine-Richland School District, 2012
- ↑ Pine-Richland School District Administration (2013). "Pine-Richland School District budget Info".
- ↑ Pittsburgh Business Times (April 26, 2010). "School District Data - Pine-Richland School District".
- ↑ Pennsylvania Department of Education, Tuition rates per LEA, 2011
- ↑ US Census Bureau, American Fact Finder, 2009
- ↑ US Census Bureau, American Fact Finder, State and County quick facts, 2010
- ↑ US Census Bureau, Income, Poverty, and Health Insurance Coverage in the United States: 2010, September 2011
- ↑ Pennsylvania Public School Code Governance 2010
- ↑ "Academic Achievement / 2014 Academic Achievement Report". www.pinerichland.org. Retrieved 2015-11-09.
- ↑ Pittsburgh Business Times (April 4, 2013). "USC, Mt. Lebo top two scoring districts in state".
- ↑ "Statewide Honor Roll Rankings 2012". Pittsburgh Business Times. April 5, 2012.
- ↑ Pittsburgh Business Times (April 6, 2012). "Honor Roll Local Ranking Information".
- ↑ Pennsylvania Department of Education (2010). "Dual Enrollment Guidelines".
- ↑ Commonwealth of Pennsylvania (March 2010). "Pennsylvania Transfer and Articulation Agreement".
- ↑ Pennsylvania Department of Education (2010). "Dual Enrollment Guidelines".
- ↑ Pennsylvania Department of Education (January 20, 2009). "Pennsylvania College Remediation Report,".
- ↑ National Center for Education Statistics, IPEDS Integrated Postsecondary Education Data System, 2008
- ↑ Pennsylvania Bureau of Special Education Services (2010–2011). "Pine-Richland School District Special Education Data Report LEA Performance on State Performance Plan (SPP) Targets".
- ↑ Pennsylvania Department of Education, Testimony Hearing on Special Education Senate Republican Policy Committee, January 2013
- ↑ Pennsylvania Bureau of Special Education (2008). "Pennsylvania Parent Guide to Special Education Services".
- ↑ Pine-Richland School District (2014). "Screening Evaluation and Placement Procedures".
- ↑ Pennsylvania Department of Education - School District Administration (January 6, 2011). "Procedural Safeguards Notice".
- ↑ Pennsylvania Department of Education, Bureau of Special Education (September 2005). "Gaskin Settlement Agreement Overview Facts Sheet" (PDF).
- ↑ Pennsylvania Department of Education. "Pennsylvania Special Education Funding".
- ↑ Browne, Patrick., Senate Education Committee Hearing on Special Education Funding & Accountability testimony, November 1, 2011
- ↑ Kintisch, Baruch., Public Hearing: Special Education Funding & Accountability Testimony, Education Law Center, November 11, 2011
- ↑ Amy Morton, Executive Deputy Secretary, Public Hearing: Special Education Funding & Accountability Testimony, Pennsylvania Department of Education, November 11, 2011
- ↑ US Department of Education, U.S. Department of Education Clarifies Schools' Obligation to Provide Equal Opportunity to Students with Disabilities to Participate in Extracurricular Athletics, January 25, 2013
- ↑ Pennsylvania Department of Education (July 2010). "Special Education Funding from Pennsylvania State_2010-2011".
- ↑ Pennsylvania Department of Education (2011). "Special Education Funding 2011-2012 Fiscal Year".
- ↑ Pennsylvania Department of Education (April 2012). "Investing in PA kids,".
- ↑ Pennsylvania Department of Education (Revised December 1, 2009 Child Count (Collected July 2010)). "Gifted Students as Percentage of Total Enrollment by School District/Charter School" (PDF). Check date values in:
|date=(help) - ↑ Pennsylvania Department of Education and Pennsylvania School Board. "CHAPTER 16. Special Education For Gifted Students". Retrieved February 4, 2011.
- ↑ Pennsylvania Department of Education (March 26, 2010). "Special Education for Gifted Students Notice of Parental rights" (PDF).
- ↑ Pine-Richland School Board Policy Manual, Student Wellness Policy 246, November 22, 2010
- ↑ Probart C, McDonnell E, Weirich JE, Schilling L, Fekete V (September 2008). "Statewide assessment of local wellness policies in Pennsylvania public school districts.". J Am Diet Assoc. 108 (9): 1497–502. doi:10.1016/j.jada.2008.06.429. PMID 18755322.
- ↑ Pennsylvania Department of Education – Division of Food and Nutrition (July 2008). "Nutrition Standards for Competitive Foods in Pennsylvania Schools for the School Nutrition Incentive".
- ↑ USDA, Child Nutrition Programs - Eligibility Manual for School Meals, 2012
- ↑ Pennsylvania Hunger Action Center, The Pennsylvania School Breakfast Report Card, 2009
- ↑ USDA, Child Nutrition Programs, June 27, 2013
- ↑ United States Department of Agriculture (2011). "Food and Nutrition Service Equity in School Lunch Pricing Fact Sheet" (PDF).
- ↑ Denver Nicks (February 25, 2014). "White House Sets New Limits on Junk Food Ads in Schools". Time Magazine.
- ↑ Pennsylvania State Department of Health (2010). "Pennsylvania Bulletin Doc. No. 10-984 School Immunizations; Communicable and Noncommunicable Diseases".
- ↑ Highmark Foundation, 2009 School Challenge Grants, 2009
- ↑ PR Newswire, Highmark Healthy High 5 Health eTools for Schools Available Free Through 2009, 2007
- ↑ Pennsylvania General Assembly, Taxpayer Relief Act, Act 1 of the Special Session of 2006, June 27, 2006
- ↑ Pennsylvania Department of Education (2013). "Investing in Pennsylvania Students".
- ↑ "Pine-Richland School District Payroll report 2011". OpenPA Gov.org. 2014.
- ↑ Asbury Park Press (2009). "PA. Public School Salaries".
- ↑ Pine-Richland School Board (2010). "Pine-Richland School District Teacher Union Employment Contract".
- ↑ Maureen Byko (October 19, 2006). "Contract to lengthen school day in Pine-Richland". Pittsburgh Post-Gazette.
- ↑ Fenton, Jacob., Pennsylvania School District Data: Will School Consolidation Save Money?, The Morning Call, February 2009
- ↑ Pennsylvania School Board Association (October 2009). "Public School Salaries 11th Annual".
- ↑ Pennsylvania School Board Association (June 22, 2012). "School Management Salaries Report". School Leader News.
- ↑ Tory N. Parrish (March 31, 2013). "Superintendent turnover rapid, costly".
- ↑ Pennsylvania Department of Education (2010). "2009-10 Selected Data - 2009-10 Total Expenditures per ADM".
- ↑ US Census Bureau, States Ranked According to Per Pupil Public Elementary-Secondary School System Finance Amounts: Fiscal Year 2011, May 2013
- ↑ US Census Bureau (2009). "Total and current expenditures per pupil in fall enrollment in public elementary and secondary education, by function and state or jurisdiction: 2006-07".
- ↑ US Census Bureau (March 2003). "Public Education Finances 2000-01 Annual Survey of Local Government Finances" (PDF).
- ↑ US Census Bureau (2009). "Total and current expenditures per pupil in fall enrollment in public elementary and secondary education, by function and state or jurisdiction: 2006-07".
- ↑ United States Census Bureau (2009). "States Ranked According to Per Pupil Elementary-Secondary Public School System Finance Amounts: 2008-09" (PDF).
- ↑ US Census Bureau (May 2013). "States Ranked According to Per Pupil Public Elementary-Secondary School System Finance Amounts: Fiscal Year 2011" (PDF).
- ↑ Pennsylvania Department of Education. "Fund Balances by Local Education Agency 1997 to 2008".
- ↑ Pennsylvania Department of Education (March 2014). "Investing in Pennsylvania Students".
- ↑ Murphy, Jan., Pennsylvania's public schools boost reserves, CentreDaily Times, September 22, 2010
- ↑ John Baer (December 9, 2013). "Pa. schools and $$ behind the curtain". Philadelphia Daily News.
- ↑ Melissa Daniels (June 1, 2013). "PA school districts look to cash stash to balance budgets". PA Independent.
- ↑ MaherDuessel CPA (June 30, 2011). "Pine_Richland School District Audit" (PDF).
- ↑ Auditor General Jack Wagner (November 2009). "The use of Qualified Interest Rate Management Agreements (SWAPA)" (PDF).
- ↑ Pennsylvania Auditor General (June 2013). "Pine_Richland School District Allegheny County, Pennsylvania Performance Audit Report".
- ↑ Pennsylvania Department of Education (May 2012). "Pennsylvania Public School District Tuition Rates".
- ↑ Pennsylvania of Community & Economic Development (2012). "Earned Income Tax".
- ↑ Penn State Cooperative Extension (2010). "What are the Local Taxes in Pennsylvania?, Local Tax Reform Education Project" (PDF).
- ↑ Pennsylvania Department of Revenue (April 2010). "Personal Income Taxation Guidelines".
- ↑ John Finnerty (2013). "PA teachers pensions". CNHI Harrisburg Bureau.
- ↑ Pennsylvania Representative Todd Stephens (January 23, 2014). "LEEF Funding Chart 2014".
- ↑ Democrat Appropriations Committee, Report on Education funding by LEA, July 2, 2013
- ↑ Sam Wood & Brian X. McCrone (January 29, 2014). "Montgomery County lawmaker proposes using Pa. horse racing funds for education". Philadelphia Inquirer.
- ↑ Pennsylvania Office of the Budget, 2013-14 State Budget Highlights, 2013
- ↑ Senator Jake Corman (June 28, 2012). "Pennsylvania Education funding by Local School District" (PDF).
- ↑ Pennsylvania General Assembly Sen Jake Corman (June 29, 2012). "SB1466 of 2012 General Fund Appropriation".
- ↑ PA Senate Appropriations Committee (June 28, 2011). "School District 2011-12 Funding Report".
- ↑ Pennsylvania Department of Education (July 2011). "Basic Education Funding".
- ↑ Pennsylvania Department of Education (June 30, 2011). "Basic Education Funding".
- ↑ Pennsylvania Department of Education (June 30, 2011). "Basic Education Funding 2011-2012 Fiscal Year".
- ↑ Pennsylvania Department of Education, District Allocations Report 2009, 2009-10
- ↑ Pennsylvania House Appropriations Committee (June 30, 2010). "PA Basic Education Funding-Printout2 2010-2011" (PDF).
- ↑ Office of the Budget (February 2010). "Pennsylvania Budget Proposal 2010".
- ↑ Pennsylvania Department of Education (October 2009). "Funding Allocations by district 2009-10".
- ↑ Pennsylvania Office of Budget (February 2009). "Governor's Budget Proposal 2009 Pennsylvania Department of Education Budget Proposal 2009".
- ↑ Pennsylvania Department of Education, Funding Report by LEA, 2009
- ↑ U.S. Census Bureau., Annual Survey of Local Government Finances., 2000
- ↑ U.S. Census Bureau., 2008 Survey of Local Government Finances – School Systems, 2010
- ↑ Pennsylvania Department of Education (2010). "Accountability Block Grant report Grantee list 2010".
- ↑ Pennsylvania Department of Education (2008). "Accountability Block Grant Mid Year report".
- ↑ Pennsylvania Partnership for Children, Full-Day Kindergarten Enrollment, 2011
- ↑ Pennsylvania Auditor General (December 22, 2008). "Classrooms for the Future grants audit" (PDF).
- ↑ Pennsylvania Department of Education Press Office (October 17, 2013). "Acting Secretary of Education Says Hybrid Learning Benefits Students; Highlights Success of First-Year Pilot Program".
- ↑ Mary Niederberger, Schools make use of first-time Grable grants, September 03, 2009
- ↑ Commonwealth of Pennsylvania (2009). "County ARRA FUNDING Report".
- ↑ ProPublica (2009). "Recovery Tracker Eye on the stimulus".
- ↑ "School stimulus money". Pittsburgh Post-Gazette. March 12, 2009.
- ↑ Pennsylvania Department of Education, Race To The Top Webinar powerpoint for districts December 2009, December 9, 2009
- ↑ Governor's Press Office release (January 20, 2010). "Pennsylvania's 'Race to the Top' Fueled by Effective Reforms, Strong Local Support,".
- ↑ Race to the Top Fund, U.S. Department of Education, March 29, 2010.
- ↑ Gerald Zahorchak (December 2008). "Pennsylvania Race to the Top Letter to Superintendents" (PDF).
- ↑ Pennsylvania Department of Education (January 19, 2009). "Pennsylvania Race to the Top -School Districts Title I Allocations 2009-10".
- ↑ Pennsylvania Department of Education (2012). "Real Estate Tax Rates by School District 2012-13 Real Estate Mills".
- ↑ Pennsylvania Department of Education (2004). "Act 511 Tax Report".
- ↑ State Tax Equalization Board (2011). "State Tax Equalization Board About US".
- ↑ Pennsylvania Auditor General office - Bureau of Audits (February 2011). "A Special Performance Audit of the Pennsylvania State Tax Equalization Boards" (PDF).
- ↑ Tax-rates.org., The 2013 Tax Resource County Property Taxes 2012, 2012
- ↑ Pennsylvania Department of Education, Pennsylvania School Finances - Summaries of Annual Financial Report Data 2010-11, 2011
- ↑ New Census Data on Property Taxes on Homeowners, Tax Foundation, September 22, 2009.
- ↑ Pennsylvania Department of Education (May 1, 2012). "2012-2013 Estimated State Property Tax Relief per Homestead".
- ↑ Pennsylvania Department of Education, Tax Relief per Homestead, May 1, 2009.
- ↑ Tax Relief per Homestead 2009, Pennsylvania Department of Education Report, May 1, 2009
- ↑ Pennsylvania Auditor General Office, Special Report Pennsylvania Property Tax Relief, February 23, 2010
- ↑ Penn State College of Agricultural Sciences Cooperative Extension (1998). "Understanding the Homestead and Farmstead Exclusions" (PDF).
- ↑ Elias, Joe., Pennsylvania Treasury Department to issue $238 million in property tax rebates, The Harrisburg Patriot-News, |June 30, 2012
- ↑ Pennsylvania Department of Revenue., Property Tax/Rent Rebate Program, June 2012
- ↑ Pennsylvania Office of the Governor Press Release (November 10, 2005). "Home-Schooled, Charter School Children Can Participate in School District Extracurricular Activities".
- ↑ Pennsylvania Interscholastic Athletics Association (2013). "PIAA School Directory".
External links
- Pine-Richland School District
- Pine-Richland High School
- Pine-Richland Middle School
- Eden Hall Upper Elementary School
- Richland Elementary School
- Hance Elementary School
- Wexford Elementary School
- High School Expansion Report