Political debates about the United States federal budget
| This article is part of a series on the |
| Budget and debt in the United States of America |
|---|
  |
|
Programs |
|
Contemporary issues In specific years |
|
Terminology |
Many of the debates about the United States federal budget center on competing macroeconomic schools of thought. In general, Democrats favor the principles of Keynesian economics to encourage economic growth via a mixed economy of both private and public enterprise, and strong regulatory oversight. Conversely, Republicans generally support applying the principles of either laissez-faire or supply-side economics to grow the economy via small government, low taxes, limited regulation, and free enterprise.[1][2] Debates have surrounded the appropriate size and role of the federal government since the founding of the country. These debates also deal with questions of morality, income equality and intergenerational equity. For example, Congress adding to the debt today may or may not enhance the quality of life for future generations, who may also have to bear additional interest and taxation burdens.[3]
Political realities make major budgetary deals difficult to achieve. While Republicans argue conceptually for reductions in Medicare and Social Security, they are hesitant to actually vote to reduce the benefits from these popular programs. Democrats on the other hand argue conceptually for tax increases on the wealthy, yet may be hesitant to vote for them because of the effect on campaign donations from the wealthy. The so-called budgetary "grand bargain" of tax hikes on the rich and removal of some popular tax deductions in exchange for reductions to Medicare and Social Security is therefore elusive.[4]
Debates following the 2008-2009 recession and resulting slow economic growth and high unemployment have centered on the prioritization of job creation and economic stimulus versus the need to address significant budget deficits.[5][6]
President-elect Donald J. Trump has proposed policies including significant tax cuts and increased spending on defense and infrastructure. The Committee for a Responsible Federal Budget and Moody's Analytics reported in 2016 that enacting these policies would dramatically increase the annual budget deficits and national debt over the 2017-2026 periods, relative to the current policy baseline, which already includes a sizable debt increase.[7][8]
Cause of decline in U.S. federal government's financial position

CBO cause of change analysis
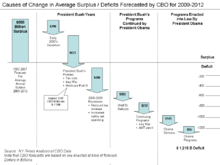
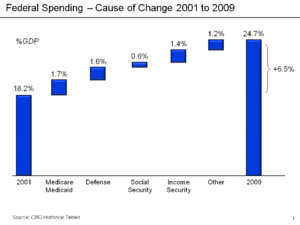
Both economic conditions and policy decisions significantly worsened the debt outlook since 2001, when large budget surpluses were forecast for the following decade by the Congressional Budget Office (CBO). In June 2012, CBO summarized the cause of change between its January 2001 estimate of a $5.6 trillion cumulative surplus between 2002 and 2011 and the actual $6.1 trillion cumulative deficit that occurred, an unfavorable "turnaround" or debt increase of $11.7 trillion. Tax cuts and slower-than-expected growth reduced revenues by $6.1 trillion and spending was $5.6 trillion higher. Of this total, the CBO attributes 72% to legislated tax cuts and spending increases and 27% to economic and technical factors. Of the latter, 56% occurred from 2009 to 2011.[9][10]
According to CBO, the difference between the projected and actual debt in 2011 can be largely attributed to:
- $3.5 trillion – Economic changes (including lower than expected tax revenues and higher safety net spending due to recession)
- $1.6 trillion – Bush Tax Cuts (EGTRRA and JGTRRA), primarily tax cuts but also some smaller spending increases
- $1.5 trillion – Increased defense and non-defense discretionary spending
- $1.4 trillion – Wars in Afghanistan and Iraq
- $1.4 trillion – Incremental interest due to higher debt balances
- $0.9 trillion – Obama stimulus and tax cuts (ARRA and Tax Act of 2010)[10]
Similar analyses were reported by the Pew Center in November 2011[11][12] , New York Times in June 2009,[13] the Washington Post in April 2011[14] and the Center on Budget and Policy Priorities in May 2011.[15]
Economist Paul Krugman wrote in May 2011: "What happened to the budget surplus the federal government had in 2000? The answer is, three main things. First, there were the Bush tax cuts, which added roughly $2 trillion to the national debt over the last decade. Second, there were the wars in Iraq and Afghanistan, which added an additional $1.1 trillion or so. And third was the Great Recession, which led both to a collapse in revenue and to a sharp rise in spending on unemployment insurance and other safety-net programs."[16] A Bloomberg analysis in May 2011 attributed $2.0 trillion of the $9.3 trillion of public debt (20%) to additional military and intelligence spending since September 2001, plus another $45 billion annually in interest.[17]
Contribution of systemic issues
The extent to which the deficit and debt increases are a cause or effect of wider systemic problems is frequently debated. For example, in January 2008, then GAO Director David Walker pointed to four types of "deficits" that cause the overall fiscal problem: budget, trade, savings and leadership.[18] Bill Gross wrote in August 2011 that aging demographics, globalization, and technological innovation are key drivers of a long-term lack of sustainable global demand: "Debt has been simply an abused sovereign and private market antidote to sustain [demand]. We and our global market competitors are and have been experiencing a lack of aggregate demand for several decades. It is now only visibly coming to a head, as the magic elixir of leverage is drained and exhausted."[19] Economist Carmen Reinhart wrote that the world is recovering from a global financial crisis, which is different from a typical recession caused by the business cycle. Historically, after financial crises, unemployment is considerably higher and GDP growth significantly lower than pre-crisis levels, for 7–10 years.[20]
Economist Joseph Stiglitz wrote in October 2011 that the recession and high unemployment of the 2009-2011 period was years in the making and driven by: unsustainable consumption; high manufacturing productivity outpacing demand thereby increasing unemployment; income inequality that shifted income from those who tended to spend it (i.e., the middle class) to those who do not (i.e., the wealthy); and emerging market's buildup of currency reserves (to the tune of $7.6 trillion by 2011) which was not spent. These factors all lead to a "massive" shortfall in aggregate demand, which was "papered over" by demand related to the housing bubble until it burst.[21]
Policies of Presidents Bush and Obama
There is debate regarding whether the policies of President George W. Bush or President Barack Obama added more to deficits and debt. While deficits increased significantly in fiscal year 2008 and thereafter, much of it was due to economic conditions (which reduced revenue while increasing spending on safety net programs such as unemployment compensation) rather than specific policies enacted by President Obama. One study summarized in the New York Times estimated that President Bush's policies added $5.07 trillion to the debt between 2002–2009, while President Obama's policies would add an estimated $1.44 trillion to the debt between 2009-2017.[22]
Government budget balance as a sectoral component
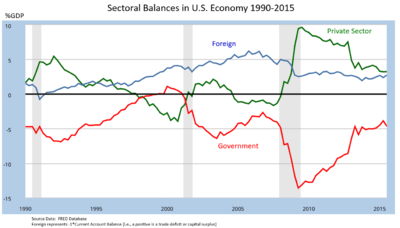
Economist Martin Wolf explained in July 2012 that government fiscal balance is one of three major financial sectoral balances in the U.S. economy, the others being the foreign financial sector and the private financial sector. The sum of the surpluses or deficits across these three sectors must be zero by definition. In the U.S., a foreign financial surplus (or capital surplus) exists because capital is imported (net) to fund the trade deficit. Further, there is a private sector financial surplus due to household savings exceeding business investment. By definition, there must therefore exist a government budget deficit so all three net to zero. The government sector includes federal, state and local. For example, the government budget deficit in 2011 was approximately 10% GDP (8.6% GDP of which was federal), offsetting a capital surplus of 4% GDP and a private sector surplus of 6% GDP.[23]
Wolf argued that the sudden shift in the private sector from deficit to surplus forced the government balance into deficit, writing: "The financial balance of the private sector shifted towards surplus by the almost unbelievable cumulative total of 11.2 per cent of gross domestic product between the third quarter of 2007 and the second quarter of 2009, which was when the financial deficit of US government (federal and state) reached its peak...No fiscal policy changes explain the collapse into massive fiscal deficit between 2007 and 2009, because there was none of any importance. The collapse is explained by the massive shift of the private sector from financial deficit into surplus or, in other words, from boom to bust."[23]
Economist Paul Krugman also explained in December 2011 the causes of the sizable shift from private deficit to surplus: "This huge move into surplus reflects the end of the housing bubble, a sharp rise in household saving, and a slump in business investment due to lack of customers."[24]
The "fiscal cliff"

A major debate during the latter half of 2012 is whether or not to allow a series of scheduled tax cut expirations and spending cuts to take effect. The impact of these changes has been referred to as the "fiscal cliff."[25] The CBO estimated in May 2012 that this would:
- Reduce the projected 2013 deficit from $1,037 billion to $641 billion, a 38% reduction;
- Reduce real GDP growth in 2013 from 1.7% to -0.5%, with a high probability of recession during the first half of the year, followed by 2.3% growth in the second half;
- Increase the unemployment rate from 8.0% to 9.1%; and
- Support relatively higher growth over the long-run, due to lower deficits and debt.[26][27]
The CBO estimated that letting current laws take effect beyond 2012 would significantly reduce future budget deficits. For example, the Bush tax cuts of 2001 and 2003 (extended by President Obama in 2010) are scheduled to expire at the end of 2012. Other deficit reducers per the CBO include: allowing the automatic spending cuts in the Budget Control Act of 2011 to take effect, allowing other tax cuts enacted in 2009 and 2010 by President Obama to expire in 2012, allowing the alternative minimum tax (AMT) to affect more taxpayers, and reducing Medicare reimbursements to doctors. These and other current laws, if allowed to take effect, reduce the projected 2021 deficit from an estimated 4.7% GDP to 1.2% GDP.[28] Total deficit reduction could be as high as $7.1 trillion over a decade if current law is enforced and not overridden.[20]
The now infamous phrase was coined by Federal Reserve Chairman Ben Bernanke in February 2012, during one of his required appearances before Congress on the state of the U.S. economy. He described ... "a massive fiscal cliff[29] of large spending cuts and tax increases" on Jan. 1, 2013.
Economic debates
CBO estimated that the largest single driver of the deterioration of the U.S. fiscal position over the last decade was due to economic factors ($3.5 trillion).[10] Further, CBO estimated in October 2011 that approximately one-third of the deficit projected for fiscal year 2012 is due to economic factors, which have caused expenditures to increase and revenues to decline: "...if the economy was operating at its potential level...the projected federal deficit under current law in fiscal year 2012 would be about a third lower, or roughly $630 billion instead of the $973 billion projected in CBO’s most recent baseline. That deficit would be equal to about 4.0 percent of gross domestic product (GDP), compared with the 6.2 percent deficit projected for 2012 in CBO’s baseline."[30] CBO estimated in April 2011 that "automatic stabilizers" (i.e., mandatory spending increases and revenue reductions affected by economic conditions, such as unemployment insurance) are adding significantly to the budget deficit. In 2010, CBO estimates, automatic stabilizers added the equivalent of 2.4% of GDP to the deficit and about 2.1% in 2009. Each 1% of GDP is about $150 billion in 2012 dollars.[31]
Debates following the 2008–2009 recession and resulting slow economic growth and high unemployment have centered on the prioritization of job creation and economic stimulus versus the need to address significant budget deficits. Economist Paul Krugman wrote in August 2011: "For more than a year and a half – ever since President Obama chose to make deficits, not jobs, the central focus of the 2010 State of the Union address – we’ve had a public conversation that has been dominated by budget concerns, while almost ignoring unemployment. The supposedly urgent need to reduce deficits has so dominated the discourse that on Monday, in the midst of a market panic, Mr. Obama devoted most of his remarks to the deficit rather than to the clear and present danger of renewed recession. What made this so bizarre was the fact that markets were signaling, as clearly as anyone could ask, that unemployment rather than deficits is our biggest problem."[5]
President Barack Obama stated in November 2012: "At a time when our economy is still recovering from the Great Recession, our top priority has to be jobs and growth. That’s the focus of the plan I talked about during the campaign. It’s a plan to reward businesses that create jobs here in America, and give people access to the education and training that those businesses are looking for. It’s a plan to rebuild our infrastructure and keep us on the cutting edge of innovation and clean energy. And it’s a plan to reduce our deficit in a balanced and responsible way."[6]
Unemployment
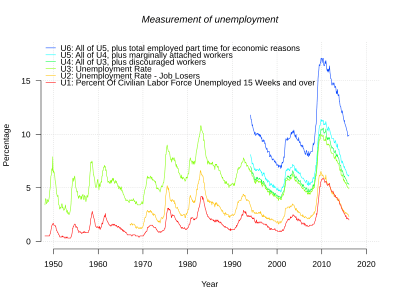
Unemployment is among the largest deficit drivers. CBO reported in 2009 that income tax revenues had declined by nearly 20% due to higher unemployment caused by the recession, while social safety net expenditures increased significantly.[32] The Economic Policy Institute (EPI) estimated in May 2010 that 15 million Americans were unemployed and another 11 million were involuntarily working part-time or had dropped out of the labor force.[33] The U.S. labor force participation rate has declined from over 66% in 2007 to 64.2% in April 2011, while the ratio of civilians employed relative to the population has declined from over 63% in 2007 to 58.4%.[34]
Unemployment and economic growth

Former Treasury Secretary Lawrence Summers stated in July 2011: "Look, the most important determinant of where the deficit is going to be three, four years from now is how fast the economy grows. If the economy stagnates, no matter what we do with deficit deals, that deficit's going to be in a terrible place, and that's why growing the economy is so important."[35] CBO estimated in January 2011 that reducing its GDP growth estimates by 0.1% annually for a decade would increase the cumulative deficits from 2012-2021 by about $300 billion; CBO estimated GDP growth between 2.7% and 3.8% during that period.[36]
Economist Laura D'Andrea Tyson wrote in July 2011: "Like many economists, I believe that the immediate crisis facing the United States economy is the jobs deficit, not the budget deficit. The magnitude of the jobs crisis is clearly illustrated by the jobs gap – currently around 12.3 million jobs. That is how many jobs the economy must add to return to its peak employment level before the 2008–9 recession and to absorb the 125,000 people who enter the labor force each month. At the current pace of recovery, the gap will be not closed until 2020 or later." She explained further that job growth between 2000 and 2007 was only half what it had been in the preceding three decades, pointing to several studies by other economists indicating globalization and technology change had highly negative effects on certain sectors of the U.S. workforce and overall wage levels.[37]
Unemployment – Is it cyclical or structural?
Job creation in the U.S. is fundamental to addressing the deficit. There is significant debate among economists regarding the extent to which current unemployment is cyclical (i.e., temporary and responsive to stimulus measures that spur demand) or structural (i.e., longer-term and requiring process reforms and re-allocation of workers among industries and geographies). Ben Bernanke summarized the arguments in a March 2012 speech.[38] Wells Fargo Economics estimated in May 2011 that the structural unemployment rate was between 6.3% to 7.1% and had risen due to the crisis. CBO estimates the rate around 5%. Factors affecting the structural rate of unemployment included: Education levels; rising costs of employee healthcare benefits; extension of unemployment benefits; reduced workforce mobility (i.e., ability to relocate to available jobs is reduced due to home price declines); and a skills mismatch (i.e., the skills of the unemployed do not match with open jobs).[34]
The Congressional Research Service summarized a variety of studies that indicated changes in unemployment between 2007 and 2010 were 65-80% cyclical, thus mainly due to reduced aggregate demand for goods and services. Labor mobility was not a key issue due to the widespread nature of job losses across geographies and industries. Cyclically sensitive industries such as manufacturing and construction had the most significant job losses. One study referenced in the CRS research indicated that long-term unemployment can convert cyclical to structural unemployment through loss of skills.[39]
Unemployment outlook
CBO forecasts that unemployment will be 8.9% during 2011 and 8.5% during 2012, falling to 5.3 by 2016.[40] However, the McKinsey Global Institute reported in June 2011 that the U.S. economy was unlikely to return to a 5% unemployment rate prior to 2020. Further, the lag between GDP and employment returning to their pre-recession peaks has grown with recent recessions. This averaged around 6 months for 7 recessions between 1948-1981 but rose to 15 months in 1990 and 39 months in 2001. To return to pre-recession employment levels by 2020, the U.S. economy would have to create 21 million net new jobs. This is roughly 187,000 jobs per month, versus 117,000 created on average during each of the first three months of 2011.[41]
High consumer debt levels inhibit demand for goods and services, which affects employment. USA household debt as a percentage of annual disposable personal income was 127% at the end of 2007, versus 77% in 1990.[42] Economist Carmen Reinhart stated in August 2011: "Debt de-leveraging [reduction] takes about seven years...And in the decade following severe financial crises, you tend to grow by 1 to 1.5 percentage points less than in the decade before, because the decade before was fueled by a boom in private borrowing, and not all of that growth was real. The unemployment figures in advanced economies after falls are also very dark. Unemployment remains anchored about five percentage points above what it was in the decade before.”[43]
Can the U.S. outgrow the problem?
There is debate regarding whether tax cuts, less intrusive regulation, and productivity improvements could feasibly generate sufficient economic growth to offset the deficit and debt challenges facing the country. According to David Stockman, OMB Director under President Reagan, post-1980 Republican ideology embraces the idea that the "economy will outgrow the deficit if plied with enough tax cuts."[44] Former President George W. Bush exemplified this ideology when he wrote in 2007: "...it is also a fact that our tax cuts have fueled robust economic growth and record revenues."[45]
However, multiple studies by economists across the political spectrum and several government organizations argue that tax cuts increase deficits and debt.[46][47]
The GAO estimated in 2008 that double-digit GDP growth would be required for the next 75 years to outgrow the projected increases in deficits and debt; GDP growth averaged 3.2% during the 1990s. Because mandatory spending growth rates will far exceed any reasonable growth rate in GDP and the tax base, the GAO concluded that the U.S. cannot grow its way out of the problem.[48]
Fed Chair Ben Bernanke stated in April 2010: "Unfortunately, we cannot grow our way out of this problem. No credible forecast suggests that future rates of growth of the U.S. economy will be sufficient to close these deficits without significant changes to our fiscal policies."[49]
Debates about the public debt
Is there a "danger level" of debt?
Work by Carmen Reinhart and Kenneth Rogoff was used to imply that a debt level of 90% of GDP was a dangerous threshold, a conclusion that had been particularly influential among those advocating austerity and tighter budgets. However, the threshold was shown to largely be the result of a coding error and questionable methodology.
Economist Paul Krugman disputes the existence of a solid debt threshold or danger level, arguing that low growth causes high debt rather than the other way around.[50] He also points out that in Europe, Japan, and the US this has been the case. In the US the only period of debt over 90% of GDP was after World War II "when real GDP was falling."[51]
Fed Chair Ben Bernanke stated in April 2010:[52]
Neither experience nor economic theory clearly indicates the threshold at which government debt begins to endanger prosperity and economic stability. But given the significant costs and risks associated with a rapidly rising federal debt, our nation should soon put in place a credible plan for reducing deficits to sustainable levels over time.
Measure of public debt
Economists also debate the definition of public debt. Krugman argued in May 2010 that the debt held by the public is the right measure to use, while Reinhart has testified to the President's Fiscal Reform Commission that gross debt is the appropriate measure. (Gross debt includes government debt held by government institutions, such as the Federal Reserve and the Social Security trust fund.) Certain members of the Commission are focusing on gross debt.[50] The Center on Budget and Policy Priorities (CBPP) cited research by several economists supporting the use of the lower debt held by the public figure as a more accurate measure of the debt burden, disagreeing with these Commission members.[46]
Intragovernmental debt
There is debate regarding the economic nature of the intragovernmental debt, which was approximately $4.6 trillion in February 2011. A significant portion of the intragovernmental debt is the $2.6 trillion Social Security Trust Fund.[53]
For example, the CBPP argues:[46]
Debt held by the public is important because it reflects the extent to which the government goes into private credit markets to borrow. Such borrowing draws on private national saving and international saving, and therefore competes with investment in the nongovernmental sector (for factories and equipment, research and development, housing, and so forth). Large increases in such borrowing can also push up interest rates and increase the amount of future interest payments the federal government must make to lenders outside of the United States, which reduces Americans’ income. By contrast, intragovernmental debt (the other component of the gross debt) has no such effects because it is simply money the federal government owes (and pays interest on) to itself.
If the U.S. continues to run "on budget" deficits as projected by the CBO and OMB for the foreseeable future, it will have to issue marketable Treasury bills and bonds (i.e., debt held by the public) to pay for the projected shortfall in the Social Security program. This will result in "debt held by the public" replacing "intragovernmental debt" to the extent of the Social Security Trust Fund during the period the Trust Fund is liquidated, which is expected to occur between 2015 and the mid-2030s. This replacement of intragovernmental debt with debt held by the public would not occur if: a) The U.S. runs on-budget surpluses sufficient to offset "off-budget" deficits in the Social Security program; or b) Social Security is reformed to maintain an off-budget surplus.[54][55]
Debates about tax policy
Democrats and Republicans mean very different things when they talk about tax reform. Democrats argue for the wealthy to pay more via higher income tax rates, while Republicans focus on lowering income tax rates. While both parties discuss reducing tax expenditures (i.e., exemptions and deductions), Republicans focus on preserving lower tax rates for capital gains and dividends, while Democrats prefer educational credits and capping deductions. Political realities make it unlikely that more than $150 billion per year in individual tax expenditures could be eliminated. One area with more common ground is corporate tax rates, where both parties have generally agreed that lower rates and fewer tax expenditures would align the U.S. more directly with foreign competition.[56]
Budgetary impact of the 2001 and 2003 tax cuts
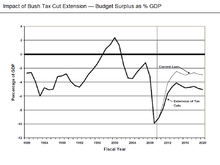
A variety of tax cuts were enacted under President Bush between 2001–2003 (commonly referred to as the "Bush tax cuts"), through the Economic Growth and Tax Relief Reconciliation Act of 2001 (EGTRRA) and the Jobs and Growth Tax Relief Reconciliation Act of 2003 (JGTRRA). Most of these tax cuts were scheduled to expire December 31, 2010. Since CBO projections are based on current law, the projections discussed above assume these tax cuts will expire, which may prove politically challenging.
In August 2010, CBO estimated that extending the tax cuts for the 2011-2020 time period would add $3.3 trillion to the national debt: $2.65 trillion in foregone tax revenue plus another $0.66 trillion for interest and debt service costs.[57]
The non-partisan Pew Charitable Trusts estimated in May 2010 that extending some or all of the Bush tax cuts would have the following impact under these scenarios:
- Making the tax cuts permanent for all taxpayers, regardless of income, would increase the national debt $3.1 trillion over the next 10 years.
- Limiting the extension to individuals making less than $200,000 and married couples earning less than $250,000 would increase the debt about $2.3 trillion in the next decade.
- Extending the tax cuts for all taxpayers for only two years would cost $558 billion over the next 10 years.[58]
The non-partisan Congressional Research Service (CRS) has reported the 10-year revenue loss from extending the 2001 and 2003 tax cuts beyond 2010 at $2.9 trillion, with an additional $606 billion in debt service costs (interest), for a combined total of $3.5 trillion. CRS cited CBO estimates that extending the cuts permanently, including the repeal of the estate tax, would add 2% of GDP to the annual deficit.[59]
The Center on Budget and Policy Priorities wrote in 2010: "The 75-year Social Security shortfall is about the same size as the cost, over that period, of extending the 2001 and 2003 tax cuts for the richest 2 percent of Americans (those with incomes above $250,000 a year). Members of Congress cannot simultaneously claim that the tax cuts for people at the top are affordable while the Social Security shortfall constitutes a dire fiscal threat."[60]
Can reducing income tax rates increase government revenue?
CBO and Treasury Department studies
The Congressional Budget Office has consistently reported that tax cuts do not pay for themselves; they increase the deficit relative to a policy baseline without the tax cut. For example, CBO estimated in June 2012 that the Bush tax cuts of 2001 and 2003 (EGTRRA and JGTRRA) added about $1.6 trillion to the debt between 2001 and 2011, excluding interest.[61] In August 2010, the Congressional Budget Office (CBO) estimated that extending the tax cuts for the 2011-2020 time period would add $3.3 trillion to the national debt, comprising $2.65 trillion in foregone tax revenue plus another $0.66 trillion for interest and debt service costs.[62]
A 2006 Treasury Department study estimated that the Bush tax cuts reduced revenue by approximately 1.5% GDP on average for each of the first four years after their implementation, an approximately 6% annual reduction in revenue relative to a baseline without those tax cuts. The study also indicated the Kennedy tax cuts of 1962 and Reagan tax cuts of 1981 reduced revenue. The study did not extend the analysis beyond the first four years of implementation.[63]
Supply side arguments
In theory, the government collects no revenue at either zero or 100% tax rates. So there is some intermediate point at which government revenue is maximized. Lowering tax rates from 100% to this hypothetical rate that maximizes revenue would theoretically raise revenue, while continuing to lower tax rates below this rate would lower revenues. This concept underlies the Laffer Curve, an element of supply-side economics. Since the 1970s, some "supply side" economists have contended that lowering marginal tax rates could stimulate economic growth to such a degree that tax revenues could rise, other factors being held constant.
However, economic models and econometric analysis have found weak support for the "supply side" theory. The Treasury Department reported in 2006 that tax cuts in 1962, 1981, 2001, and 2003 all reduced revenue relative to a policy baseline without those tax cuts.[64] The Center on Budget and Policy Priorities (CBPP) summarized a variety of studies done by economists across the political spectrum that indicated tax cuts do not pay for themselves and increase deficits.[46] Studies by the CBO and the U.S. Treasury also indicated that tax cuts do not pay for themselves.[65][66][67][68]
In 2003, 450 economists, including ten Nobel Prize laureate, signed the Economists' statement opposing the Bush tax cuts, sent to President Bush stating that "these tax cuts will worsen the long-term budget outlook... will reduce the capacity of the government to finance Social Security and Medicare benefits as well as investments in schools, health, infrastructure, and basic research... [and] generate further inequalities in after-tax income."[69]
Economist Paul Krugman wrote in 2007: "Supply side doctrine, which claimed without evidence that tax cuts would pay for themselves, never got any traction in the world of professional economic research, even among conservatives."[70] The Washington Post summarized a variety of tax studies in 2007 done by both liberal and conservative economists, indicating that both income and capital gains tax cuts do not pay for themselves.[71] Economist Nouriel Roubini wrote in October 2010 that the Republican Party was "trapped in a belief in voodoo economics, the economic equivalent of creationism" while the Democratic administration was unwilling to improve the tax system via a carbon tax or value-added tax.[72] Warren Buffett wrote in 2003: "When you listen to tax-cut rhetoric, remember that giving one class of taxpayer a 'break' requires -- now or down the line -- that an equivalent burden be imposed on other parties. In other words, if I get a break, someone else pays. Government can't deliver a free lunch to the country as a whole."[73] Former Comptroller General of the United States David Walker stated during January 2009: "You can't have guns, butter and tax cuts. The numbers just don't add up."[74] Economist Simon Johnson wrote in April 2012: "The idea that reducing taxes 'pays for itself' through higher growth is just wishful thinking."[75]
Empirical observations
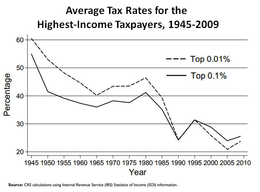
Income tax revenues generally rose to new peaks in nominal dollar terms each year from 1970 to 2000 as the economy grew, with the exception of 1983, following the recession of 1981-1982. However, after peaking in 2000, income tax revenues did not regain this peak again until 2006. After a plateau in 2007 and 2008, revenues fell markedly in 2009 and 2010 due to a financial crisis and recession. Income tax revenues in 2010 remained below their 2000 peak. Relative to GDP, income tax revenues declined during most of the 1980s (from 9.0% GDP in 1980 to 8.3% GDP in 1989), rose during most of the 1990s (from 8.1% GDP in 1990 to 9.6% GDP in 1999) then declined in the 2000s (from 10.2% GDP in 2000 to 6.5% GDP in 2009).[76] The extent to which economic activity and tax policy interact to drive these trends is debated by experts. While marginal income tax rates were lowered in the early 1980s, dollar revenue increased throughout the period, although revenue relative to GDP declined. Marginal tax rates were raised during the 1990s, and both revenue dollars and revenue relative to GDP increased. Marginal rates were lowered again in the early 2000s, and both revenue and revenue relative to GDP generally declined.
Can increasing tax receipts alone address the budget deficit?
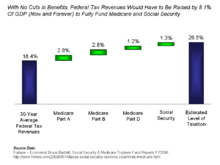
Expert panels across the political spectrum have argued for a combination of revenue increases and expense reductions to reduce the budget deficit and future debt increases. However, the nature and balance of these measures varies considerably.[77] Economist Bruce Bartlett wrote in 2009 that without benefit cuts in Medicare and Social Security, federal taxes would have to increase by 8.1% of GDP now and forever to cover estimated program shortfalls, while avoiding debt increases.[78] The 30-year historical average federal tax receipts are 18.4% of GDP, so this would represent a substantial increase in tax receipts as a share of GDP relative to historical levels in the United States. However, such an increase would still leave tax revenues relative to GDP substantially lower than other developed nations like France and Germany (see: List of countries by tax revenue as percentage of GDP).
CBO estimated in August 2011 that if the Bush tax cuts and other tax cuts enacted or extended during 2009 and 2010 were allowed to expire, the budget deficit would be reduced by 2.0-3.0% GDP each year from 2013-2021.[79]
Do tax hikes "kill jobs"?
There is an ongoing debate regarding the effect of taxation on employment or job creation. Prominent Republican Congressmen have argued that raising taxes would "kill" jobs.[80][81] Different views are expressed depending on the type of taxation under discussion.
Income taxes
The historical record indicates that marginal income tax rate changes have little impact on job creation or employment.[82]
- During the 1970s, marginal income tax rates were far higher than subsequent periods and the U.S. created 20.6 million net new jobs.
- During the 1980s, marginal income tax rates were lowered and the U.S. created 19.5 million net new jobs.
- During the 1990s, marginal income tax rates rose and the U.S. created 18.1 million net new jobs.
- From 2000-2010, marginal income tax rates were lowered and the U.S. created only 2.2 million net new jobs, with 9.2 million created 2000-2007.[83][84][85][86]
The Center on Budget and Policy Priorities (CBPP) wrote in March 2009: "Small business employment rose by an average of 2.3 percent (756,000 jobs) per year during the Clinton years, when tax rates for high-income filers were set at very similar levels to those that would be reinstated under President Obama’s budget. But during the Bush years, when the rates were lower, employment rose by just 1.0 percent (367,000 jobs)."[87] CBPP reported in September 2011 that both employment and GDP grew faster in the seven-year period following President Clinton's income tax rate increase of 1993, than a similar period after the Bush tax cuts of 2001.[88]
In addition, Warren Buffett has argued that taxes have little to do with job creation, writing in August 2011: "And to those who argue that higher rates hurt job creation, I would note that a net of nearly 40 million jobs were added between 1980 and 2000. You know what’s happened since then: lower tax rates and far lower job creation."[89] From 2002 to 2011, the nine US states with the highest income taxes grew their economy 8.2%, all states with an income tax grew 6.3%, and the nine states without an income tax grew 5.2%.[90]
A more specific, frequently debated, proposal supported by prominent Democrats is to significantly increase the taxes of the top 1 percent of income earners to generate additional revenue. According to the Tax Foundation, the so-called "super-rich" accumulated more than 20 percent of the nation's total adjusted gross income in 2008 and paid 36 percent of the total income tax.[91] Republican opponents fear that any type of large tax hike, even to the wealthy, would decrease both job creation and investment, slowing the economy even further.[92] In an op-ed in The New York Times in August 2011, Buffett wrote in support of such a proposal, stating that the federal government should "stop coddling the super-rich" to help decrease the deficit.[89] In response, conservative commentator Pat Buchanan challenged Buffett, and any other rich people who wanted higher taxes, to voluntarily donate the money to the IRS instead.[92][93]
Corporate taxes


A number of US corporations claim that even the current 35 percent corporate income tax rate causes them to shift several of their operations, including their research and manufacturing facilities, overseas.[94]
For example, Steven Ballmer, Microsoft's chief executive officer, stated in 2009 that higher taxes "...makes U.S. jobs more expensive. [Microsoft is] better off taking lots of people and moving them out of the U.S. as opposed to keeping them inside the U.S." Microsoft reported an overall effective tax rate of 26 percent in its 2008 annual report: “Our effective tax rates are less than the statutory tax rate due to foreign earnings taxed at lower rates” the report said. U.S. tax rules let companies defer paying corporate rates as high as 35 percent on most types of foreign profits as long as that money remains invested overseas. President Obama says he wants to end such incentives to keep foreign profits tax-deferred so that companies would invest them in the U.S.[95]
In comparing corporate taxes, the Congressional Budget Office found in 2005 that the top statutory tax rate was the third highest among OECD countries behind Japan and Germany. However, the U.S. ranked 27th lowest of 30 OECD countries in its collection of corporate taxes relative to GDP, at 1.8% vs. the average 2.5%.[96]
U.S. corporate after-tax profits were at record levels during the third quarter of 2012, at an annualized $1.75 trillion.[97] U.S. federal corporate income tax revenues have declined relative to profits, falling from approximately 27% in 2000 to 17% in 2012.[98]
U.S. taxes relative to foreign countries
.JPG)
Comparison of tax rates around the world is difficult and somewhat subjective. Tax laws in most countries are extremely complex, and tax burden falls differently on different groups in each country and sub-national units (states, counties and municipalities) and the types of services rendered through those taxes are also different.
One way to measure the overall tax burden is by looking at it as a percentage of the overall economy in terms of GDP. The Tax Policy Center wrote: "U.S. taxes are low relative to those in other developed countries. In 2006 U.S. taxes at all levels of government claimed 28 percent of GDP, compared with an average of 36 percent of GDP for the 30 member countries of the Organization for Economic Co-operation and Development (OECD)."[99] Economist Simon Johnson wrote in 2010: "The U.S. government doesn’t take in much tax revenue -- at least 10 percentage points of GDP less than comparable developed economies -- and it also doesn’t spend much except on the military, Social Security and Medicare."[100] A comparison of taxation on individuals amongst OECD countries shows that the U.S. tax burden is just slightly below the average tax for middle income earners.[101]

Deficit spending can distort the true total effective taxation. One way to mitigate this distortion is to evaluate spending levels. This approach shows the level of services a country is willing to accept versus what they are willing to pay. In 2010, the Federal government of the USA spent an average of $11,041 per citizen (per capita). This compares to the 2010 World average spending of $2376 per citizen and an average of $16,110 per citizen for the World's 20 largest economies (in terms of GDP). Of the 20 largest economies, only six spent less per citizen: South Korea ($4557), Brazil ($2813), Russia ($2458), China ($1010), and India ($226). Of the 13 that spent more, Norway and Sweden top the list with per citizen spending of $40908 and $26760 respectively.[102]
In comparing corporate taxes, the Congressional Budget Office found in 2005 that the top statutory tax rate was the third highest among OECD countries behind Japan and Germany. However, the U.S. ranked 27th lowest of 30 OECD countries in its collection of corporate taxes relative to GDP, at 1.8% vs. the average 2.5%.[103] Bruce Bartlett wrote in May 2011: "...one almost never hears that total revenues are at their lowest level in two or three generations as a share of G.D.P. or that corporate tax revenues as a share of G.D.P. are the lowest among all major countries. One hears only that the statutory corporate tax rate in the United States is high compared with other countries, which is true but not necessarily relevant. The economic importance of statutory tax rates is blown far out of proportion by Republicans looking for ways to make taxes look high when they are quite low."[104]
Can tax rate cuts be paid for by reducing deductions and exemptions?
Mitt Romney, the 2012 Republican Presidential Nominee, proposed a tax plan with several elements:
Individual income taxes:
- Make permanent, across-the-board 20 percent cuts in marginal income tax rates
- Maintain current tax rates on interest, dividends, and capital gains
- Eliminate taxes for taxpayers with AGI below $200,000 on interest, dividends, and capital gains
- Eliminate the Estate Tax
- Repeal the Alternative Minimum Tax (AMT)
Corporate income taxes:
- Reduce the corporate tax rate from 35% to 25%
- Eliminate the corporate alternate minimum tax.[105]
Governor Romney mentioned during 2012 Presidential debates that he would propose tax expenditure (deduction and exemption) reductions to offset the cost of his plan, such that the ratio of income taxes paid by the middle class and wealthy does not change. He stated that the economic growth and jobs generated by his tax proposal would offset the reduction in revenue expected due to these tax cuts.[106] Romney also proposed capping itemized deductions at $25,000.[107]
Romney’s plan implies the permanent extension of the Bush tax cuts, which CBO estimated previously would add $3.2 trillion to the debt over ten years. The Tax Policy Center (TPC) estimated that the income tax cut proposals would reduce tax revenue to the government by approximately $5 trillion over a decade and could not be fully offset by tax expenditure reduction without affecting the middle class.[108]
TPC also estimated that capping itemized deductions at $25,000 would cover approximately one-third the cost of his personal income tax cuts. Further, the TPC estimated that the corporate tax rate cuts would reduce revenue by $1 trillion over a decade.[107]
The Romney team has criticized these studies, countering that several other studies support the plan and indicate that deductions and exemptions can support the plan. However, others have disputed the Romney team’s conclusion regarding these studies.[109]
The Congressional Research Service reported that even though there is more than $1 trillion per year in tax expenditures, it is unlikely that more than $150 billion/year could be cut due to political support for various deductions and exemptions. For example, according to the Tax Policy Center, the home mortgage deduction accounted for $75 billion in foregone revenue in 2011 but over 33 million households (roughly one-third) benefited from it.[56]
Debates about spending
Are budget deficits driven by a "spending problem" or a "revenue problem"?
Prominent Republican Congressmen have suggested that the federal deficits should be remedied solely with spending cuts, arguing that the U.S. has a "spending problem" not a "revenue problem."[110][111] President Obama has proposed that the Bush tax cuts should be allowed to expire for the wealthiest taxpayers,[112] while Alan Greenspan has proposed that these tax cuts should expire at all income levels.[113] It is helpful in analyzing this problem to evaluate near-term and long-term fiscal conditions.
Near-term
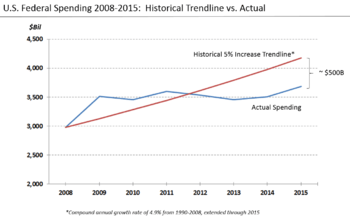
Taking the last balanced "total" budget in 2001 as a standard, spending has risen by 5.6% GDP, from 18.2% GDP in 2001 to 23.8% GDP in 2010, while revenues declined by 4.6% GDP, from 19.5% GDP to 14.9% GDP over the same interval. By this measure, spending has increased about 1% GDP more than revenues have declined. Using the historical (1971–2008) average spending of 20.6% GDP and revenues of 18.2%, the spending increase of 3.2% GDP is smaller than the revenue decline of 3.3% GDP. In other words, the "spending problem" and "revenue problem" are comparable in size.[114] Recessions typically cause spending to rise on social safety net programs such as unemployment insurance and food stamps, while tax revenues decline due to unemployment and reduced economic activity.[115]
CBO estimated the budget deficit for FY 2012 at 7.0% GDP. The budget deficit in FY 2008 was 3.2% GDP, a difference of 3.8% GDP. FY 2012 revenue of 15.7% GDP was 1.9% below 2008 levels, while FY 2012 spending of 22.7% GDP was 1.9% GDP above 2008 levels, indicating the revenue and spending "problems" were of comparable size.[116]
Nonetheless, federal spending, which peaked under the Reagan administration, has subsequently been in decline as a share of national income. The argument has therefore been made the deficit exists as a result of declining income rather than excessive spending.[117]
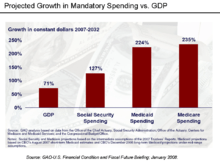
Long-term
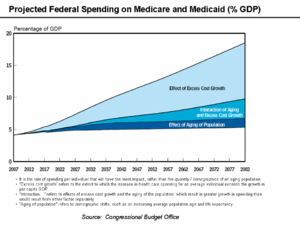
In the long-run, Medicare and Medicaid are projected to increase dramatically relative to GDP, while other categories of spending are expected to remain relatively constant. The Congressional Budget Office expects Medicare and Medicaid to rise from 5.3% GDP in 2009 to 10.0% in 2035 and 19.0% by 2082. CBO has indicated healthcare spending per beneficiary is the primary long-term fiscal challenge. So in the long-run, spending on these programs is the key issue, far outweighing any revenue consideration.[118] Economist Paul Krugman has made the argument that any serious attempt to tackle long-run deficit problems can be summed up in "seven words: health care, health care, health care, revenue."[119]
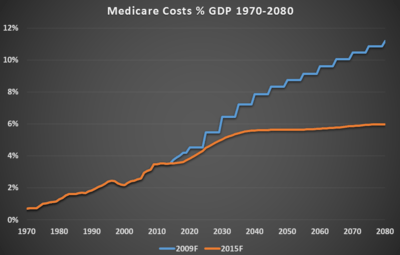
The Medicare Trustees provide an annual report of the program's finances. The forecasts from 2009 and 2015 differ materially, mainly due to changes in the projected rate of healthcare cost increases, which have moderated considerably. Rather than rising to nearly 12% GDP over the forecast period (through 2080) as forecast in 2009, the 2015 forecast has Medicare costs rising to 6% GDP, comparable to the Social Security program.[120] Based on the revised forecast, the long-term budget situation has considerably improved. According to Krugman, it is arguable whether there is a long-term entitlements problem.[121]
Earmarks
GAO defines "earmarking" as "designating any portion of a lump-sum amount for particular purposes by means of legislative language." Earmarking can also mean "dedicating collections by law for a specific purpose."[122] In some cases, legislative language may direct federal agencies to spend funds for specific projects. In other cases, earmarks refer to directions in appropriation committee reports, which are not law. Various organizations have estimated the total number and amount of earmarks. An estimated 16,000 earmarks containing nearly $48 billion in spending were inserted into larger, often unrelated bills during 2005.[123] While the number of earmarks has grown in the past decade, the total amount of earmarked funds is approximately 1-2 percent of federal spending.[124]
Fraud, waste and abuse
The Office of Management and Budget estimated that the federal government made $98 billion in "improper payments" during FY2009, an increase of 38% vs. the $72 billion the prior year. This increase was due in part to effects of the financial crisis and improved methods of detection. The total included $54 billion for healthcare-related programs, 9.4% of the $573 billion spent on those programs. The government pledged to do more to combat this problem, including better analysis, auditing, and incentives.[125][126] During July 2010, President Obama signed into law the Improper Payments Elimination and Recovery Act of 2010, citing approximately $110 billion in unauthorized payments of all types.[127]
Former GAO Director David Walker said in 2008: "Some people think that we can solve our financial problems by stopping fraud, waste and abuse or by canceling the Bush tax cuts or by ending the war in Iraq. The truth is, we could do all three of these things and we would not come close to solving our nation's fiscal challenges."[128]
Stimulus packages
Fiscal stimulus can be characterized as investment, spending or tax cuts. For example, if the funds are used to create a physical asset that generates future cash flows (e.g., a power plant or toll road), the stimulus could be characterized as investment. Extending unemployment benefits are examples of government spending. Tax cuts may or may not be spent. There is significant debate among economists regarding which type of stimulus has the highest "multiplier" (i.e., increase in economic activity per dollar of stimulus).[129] Fiscal stimulus is enacted by laws passed by Congress, which is distinct from monetary policy conducted by central banks such as the U.S. Federal Reserve, which involves interest rates and the money supply.
Recent specific stimulus laws included the Economic Stimulus Act of 2008 and the American Recovery and Reinvestment Act of 2009 (ARRA). The former was primarily tax cuts, while the latter included a blend of tax cuts, investment and spending. The CBO initially estimated that ARRA would increase the federal budget deficit by $185 billion during 2009, by $399 billion in 2010, by $134 billion in 2011, for a total of $787 billion over the 2009-2019 period.[130] The total was later revised to $825 billion.[131]
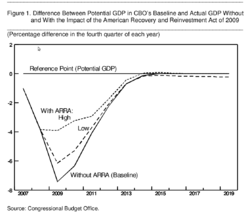
There is significant debate on whether fiscal stimulus is actually effective in creating jobs and boosting the economy, with critics claiming that all it does is increase the deficit unnecessarily.[132] CBO estimated in August 2011 that ARRA had significant positive effects on GDP and employment. For example, during 2010 the incremental effect on GDP ranged between 1.1 and 4.6 percentage points, the unemployment rate was lowered between 0.7 and 2.0 percentage points, additional employed persons ranged from 1.3 million to 3.6 million, and the number of full-time equivalent jobs added ranged from 1.8 million to 5.2 million. Even after the Act spending stops in 2011, CBO estimated it will increase the number of people employed in 2012 by between 0.4 million and 1.1 million.[131]
Beyond discrete stimulus packages, federal spending tends to increase during recessions due to "automatic stabilizers" such as unemployment compensation and nutrition programs. For example, during May 2010 CBO estimated that "automatic stabilizers added the equivalent of 1.9% of potential GDP to the [2009] deficit, an amount substantially greater than the 0.3% added in 2008. According to CBO’s baseline projections, the contribution of automatic stabilizers to the budget deficit will be roughly 2.3% of potential GDP in 2010 and 2.5% of potential GDP in 2011."[133]
Other debate topics
2010 Budget Proposal
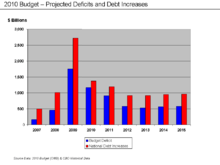
President Barack Obama proposed his 2010 budget during February, 2009. He has indicated that health care, clean energy, education, and infrastructure will be priorities. The proposed increases in the national debt exceed $900 billion each year from 2010–2019, following the Bush administration's outgoing budget which allowed for a $1.4 trillion increase in the national debt for FY 2009.[134]
Tax cuts will expire for the wealthiest taxpayers to increase revenues, returning marginal rates to the Clinton levels. Further, the base Department of Defense budget increases slightly through 2014 (Table S-7), from $534 to $575 billion, although supplemental appropriations for the Iraq War are expected to be reduced. In addition, estimates of revenue are based on GDP growth assumptions that exceed the Blue Chip Economists' consensus forecast considerably through 2012 (Table S-8).[135][136]
2010 healthcare reform
The CBO estimated in December 2009 that the Senate healthcare reform bill, later signed into law on 23 March 2010, would reduce the deficit during the 2010-2019 period by a total of $132 billion. This figure comprises $615 billion in incremental costs, offset by cost reductions of $483 billion and additional taxes of $264 billion. The CBO also estimated that the deficit would be about 0.5% lower each year in the 2020-2029 decade, or about $70 billion annually in 2010 dollars.[137] Whether the deficit reduction will materialize is questioned by many budget experts.[138]
State finances
The U.S. federal government may be required to assist state governments further, as many U.S. states are facing budget shortfalls due to the 2008-2010 recession. The sharp decline in home prices has affected property tax revenue, while the decline in economic activity and consumer spending has led to a falloff in revenues from state sales taxes and income taxes. The Center on Budget and Policy Priorities estimated that the 2010 and 2011 state shortfalls will total $375 billion.[139] As of July 2010, over 30 states had raised taxes, while 45 had reduced services.[140] State and local governments cut 405,000 jobs between January 2009 and February 2011.[141]
GAO estimates that (absent policy changes) state and local governments will face budget gaps that rise from 1% of GDP in 2010 to around 2% by 2020, 2.5% by 2030, and 3.5% by 2040.[142]
Further, many states have underfunded pensions, meaning the state has not contributed the amount estimated to be necessary to pay future obligations to retired workers. The Pew Center on the States reported in February 2010 that states have underfunded their pensions by nearly $1 trillion as of 2008, representing the gap between the $2.35 trillion states had set aside to pay for employees’ retirement benefits and the $3.35 trillion price tag of those promises.[143]
Whether a U.S. state can declare bankruptcy, enabling it to re-negotiate its obligations to bondholders, pensioners, and public employee unions is a matter of legal and political debate. Journalist Matt Miller explained some of these issues in February 2011: "The AG [State Attorney General] might put a plan forward and agree to conditions. However, the AG has no say over the legislature. And only a legislature can raise taxes. In some cases, it would require a state constitutional amendment to reduce pensions. Add to this a federal judge who would oversee the process...and a state has sovereign immunity, which means the governor or legislature may simply refuse to go along with anything the judge rules or reject the reorganization plan itself."[144]
Entitlement trust funds
Both Social Security and Medicare are funded by payroll tax revenues dedicated to those programs. Program tax revenues historically have exceeded payouts, resulting in program surpluses and the building of trust fund balances. The trust funds earn interest. Both Social Security and Medicare each have two component trust funds. As of FY2008, Social Security had a combined $2.4 trillion trust fund balance and Medicare's was $380 billion. If during an individual year program payouts exceed the sum of tax income and interest earned during that year (i.e., an annual program deficit), the trust fund for the program is drawn down to the extent of the shortfall. Legally, the mandatory nature of these programs compels the government to fund them to the extent of tax income plus any remaining trust fund balances, borrowing as needed. Once the trust funds are eliminated through expected future deficits, technically these programs can only draw on payroll taxes during the current year. In effect, they are "pay as you go" programs, with additional legal claims to the extent of their remaining trust fund balances.[145]
Credit rating downgrade
In April 2011, rating agency Standard & Poor's (S&P) issued a "negative" outlook on the U.S. "AAA" (highest quality) debt rating for the first time since the rating agency began in 1860, indicating there is a one in three chance of an outright reduction in the rating over the next two years. According to S&P, meaningful progress towards balancing the budget would be required to move the U.S. back to a "stable" outlook.[146] Losing the AAA rating would likely mean higher interest rates and the sale of treasury bonds by entities required to hold AAA securities.[147]
On August 5, 2011, representatives from S&P announced the company's decision to give a first-ever downgrade to U.S. sovereign debt, lowering the rating one notch to "AA+", with a negative outlook. S&P wrote: "The downgrade reflects our opinion that the fiscal consolidation plan that Congress and the Administration recently agreed to falls short of what, in our view, would be necessary to stabilize the government's medium-term debt dynamics...the effectiveness, stability, and predictability of American policy-making and political institutions have weakened at a time of ongoing fiscal and economic challenges to a degree more than we envisioned when we assigned a negative outlook to the rating on April 18, 2011."[148][149]
See also
- Political debates about United States military bands
- United States debt ceiling
- United States fiscal cliff
References
- ↑ Hamby, Alonzo (2011-07-29). "Presidents and Their Debts, F.D.R. to Bush". The New York Times. Retrieved 2011-08-16.
- ↑ "The rise of the anti-Keynesians". The Economist. 2011-04-14. Retrieved 2011-08-16.
- ↑ Peter G. Peterson Foundation-Citizen's Guide 2010
- ↑ Calmes, Jackie (2013-11-18). "A dirty secret lurks in the struggle over the Grand Bargain". The New York Times. Retrieved 2013-11-23.
- 1 2 NYT-Paul Krugman-http://www.nytimes.com/2011/08/12/opinion/the-hijacked-crisis.html?_r=0 NYT-Paul Krugman-The Hijacked Crisis-August 11, 2011
- 1 2 ["http://www.whitehouse.gov/the-press-office/2012/11/09/weekly-address-extending-middle-class-tax-cuts-grow-economy President Obama-Weekly Address-November 10, 2012]
- ↑ Mark Zandi; Chris Lafakis; Dan White; Adam Ozimek (June 2016). "The Macroeconomic Consequences of Mr. Trump's Economic Policies" (PDF). Moody's Analytics. Retrieved November 7, 2016.
- ↑ Fiscal Fact Check: How Do Donald Trump's Campaign Proposals So Far Add Up?, Committee for a Responsible Federal Budget (February 13, 2016).
- ↑ NYT-Bruce Bartlett-The Fiscal Legacy of George W. Bush-June 2012
- 1 2 3 CBO-Changes in CBO's Baseline Projections Since 2001
- ↑ Pew Center-10 Essential Fiscal Charts-Retrieved November 2011
- ↑ Pew Center-The Great Debt Shift-April 2011 Archived May 5, 2011, at the Wayback Machine.
- ↑ NYT-America's Sea of Red Ink was Years in the Making-June 2009
- ↑ Washington Post-Running in the Red-April 2011
- ↑ CBPP-Economic Downturn and Bush Policies Continue to Drive Large Projected Deficits-May 2011
- ↑ Krugman, Paul. The Unwisdom of Elites. The New York Times. May 9, 2011.
- ↑ Bloomberg-Bin Laden Exacts Multitrillion-Dollar Toll on U.S. Taxpayer-May 2011
- ↑ GAO-U.S. Financial Condition and Fiscal Future Briefing-David Walker-January 2008
- ↑ Washington Post-Bill Gross-America’s debt is not its biggest problem-August 2011
- 1 2 Washington Post-Ezra Klein-Double Dip, or Just One Big Economic Dive?-August 2011
- ↑ Joseph Stiglitz-Project Syndicate-October 2011
- ↑ NYT-How the Deficit Got this Big-Teresa Tritch-July 2011
- 1 2 Financial Times-Martin Wolf-The Balance Sheet Recession in the U.S. – July 2012
- ↑ NYT-Paul Krugman-The Problem-December 2011
- ↑ NYT-Recession Possible if Impasse Persists, Budget Office Says-May 2012
- ↑ CBO-Economic Effects of Reducing the Fiscal Restraint That Is Scheduled to Occur in 2013–May 2012
- ↑ Center on Budget and Policy Priorities-Misguided Fiscal Cliff Fears Pose Challenges to Productive Budget Negotiations – June 2012
- ↑ CBO – Long Term Budget Outlook Graphics – August 2012
- ↑ Koba, Mark. "'What Is The 'Fiscal Cliff?'". CNBC. CNBC.com. Retrieved 12 November 2012.
- ↑ CBO Letter to Congressman Van Hollen-October 4, 2011
- ↑ CBO – The Effects of Automatic Stabilizers on the Federal Budget – April 21, 2011
- ↑ CBO-Monthly Budget Review-October 2009
- ↑ EPI-The Real Deficit Crisis: Jobs-May 2010
- 1 2 Wells Fargo Economics-Cyclical vs. Structural Unemployment-May 2011
- ↑ CNN's Fareed Zakaria GPS – Larry Summers Interview Transcript – July 17, 2011
- ↑ CBO-The Budget and Economic Outlook Fiscal Years 2011–2021 January 2011, p. 116
- ↑ NYT-Economix-Laura D'Andrea Tyson-Jobs Deficit, Investment Deficit, Budget Deficit-July 2011
- ↑ Ben Bernake-Recent Developments in the Labor Market-March 26, 2012
- ↑ Congressional Research Service-The Increase in Unemployment Since 2007: Is it Structural or Cyclical?-April 2011
- ↑ CBO-The Budget and Economic Outlook-August 2011
- ↑ James Manyika, Susan Lund, Byron Auguste, Lenny Mendonca, Tim Welsh, Sreenivas Ramaswamy (June 2011), An economy that works: Job creation and America’s future, McKinsey Global Institute, retrieved March 3, 2016
- ↑ "The End of the Affair". Economist. 2008-10-30. Retrieved 2009-02-27.
- ↑ Washington Post-Ezra Klein-A Double Dip or One Big Dive?-August 5, 2012
- ↑ NY Times-David Stockman-Four Defamations of the Apocalypse-August 2010
- ↑ Washington Post-A Heckuva Claim-January 2007
- 1 2 3 4 Horney, James R. (May 27, 2010). "Recommendation that president’s fiscal commission focus on gross debt is misguided". Center on Budget and Policy Priorities [website]. Retrieved February 9, 2011.
- ↑ CBO-Analyzing the Economic and Budgetary Effects of a Ten Percent Cut in Income Tax Rates-December 2005
- ↑ GAO U.S. Fiscal Briefing 1/08
- ↑ Ben Bernanke-Speech before the National Commission on Fiscal Responsibility and Reform-April 2010
- 1 2 Krugman, Paul (May 27, 2010). "Bad analysis at the deficit commission". The New York Times: The Opinion Pages: Conscience of a Liberal Blog. Retrieved February 9, 2011.
- ↑ Krugman, Paul (March 12, 2010). "Debt and transfiguration". The New York Times. Retrieved February 9, 2011.
- ↑ Bernanke, Ben S. (April 27, 2010). "Speech before the National Commission on Fiscal Responsibility and Reform: Achieving fiscal sustainability". Federalreserve.gov. Retrieved February 2, 2011.
- ↑ United States Treasury, Bureau of the Public Debt (April 30, 2010). "Monthly statement of public debt of the United States". TreasuryDirect. Retrieved February 9, 2011.
- ↑ "CBO-Social Security Policy Options-July 2010" (PDF). Retrieved May 18, 2011.
- ↑ WSJ-A Short Primer on the National Debt-John Steele Gordon-August 2011
- 1 2 Washington Post-Greg Ip-Five Myths About Tax Reform-December 14, 2012
- ↑ Congressional Budget Office-The Budget and Economic Outlook-August 2010-Table 1.7 on Page 24
- ↑ Pew Charitable Trusts-Decision Time: The Fiscal Effects of Extending the 2001 and 2003 Tax Cuts-May 2010
- ↑ Congressional Research Service-Thomas Hungerford-October 27, 2010
- ↑ CBPP-What the 2010 Trustees' Report Shows About Social Security-August 2010
- ↑ CBO-Changes in CBO's Baseline Projections Since January 2001
- ↑ "Congressional Budget Office-The Budget and Economic Outlook-August 2010-Table 1.7 on Page 24" (PDF). Retrieved 2011-03-31.
- ↑ Department of the Treasury-OTA Working Paper 81-September 2006
- ↑
- ↑ CBO Study
- ↑ Mankiw Study
- ↑ Washington Post 2007
- ↑ Washington Post 2006
- ↑ "4. Akerlof, G., Arrow, K. J., Diamond, P., Klein, L. R., McFadden, D. L., Mischel, L., Modigliani, F., North, D. C., Samuelson, P. A., Sharpe, W. F., Solow, R. M., Stiglitz, J., Tyson, A. D. & Yellen, J. (2003). Economists' Statement Opposing the Bush Tax Cuts" (PDF). Retrieved 2007-10-13.
- ↑ Krugman, Paul (2007). The Conscience of a Liberal. W.W. Norton Company, Inc. ISBN 978-0-393-06069-0.
- ↑ "A Heckuva Claim". washingtonpost.com. 2007-01-06. Retrieved 2011-03-31.
- ↑ Financial Times-Nouriel Roubini-A Presidency Headed for a Fiscal Trainwreck-October 2010
- ↑ Warren Buffett-Washington Post-Dividend Voodoo-May 2003
- ↑ IOUSA Movie-DVD-January 2009 Update
- ↑ NYT-Simon Johnson-Margaret Atwood and Tax Reform-April 2012
- ↑ CBO Historical Tables-1970 to 2010
- ↑ PGPF-Solutions Summit-May 2011
- ↑ Forbes-Bruce Bartlett-The 81% Tax Increase-May 2009
- ↑ CBO-The Budget and Economic Outlook-August 2011-Summary Figure 1
- ↑ Congressman John Boehner Website-Weekly Column-April 2010
- ↑ TPM Muckracker Website-June 23, 2011
- ↑ NYT-Tyson-Tax Cuts for Job Creators-October 2012
- ↑ NYT-Economix Blog-Laura Tyson-Jobs Deficit, Investment Deficit, Fiscal Deficit July 2011
- ↑ CBO Historical Tables-1971 to 2010
- ↑ McKinsey Global Institute-An Economy that Works-June 2011
- ↑ Tax Foundation-Historical Tax Tables-Retrieved December 2011
- ↑ CBPP-History Contradicts Claim That President’s Budget Would Harm Small Business Job Creation-March 2009
- ↑ CBPP-Supercommittee Should Develop Balanced Package-September 2011
- 1 2 Buffett, Warren (2011-08-15). "Stop Coddling the Super-Rich". The New York Times. Retrieved 2011-08-16.
- ↑ "States with "High Rate" Income Taxes are Still Outperforming No-Tax States" (PDF). Institute on Taxation and Economic Policy. February 2013. p. 3. Retrieved 24 March 2013.
- ↑ "Summary of Latest Federal Individual Income Tax Data". Tax Foundation. 2010-10-06. Retrieved 2011-08-16.
- 1 2 Kocieniewski, David (2011-08-15). "Looking Closer at Taxes on the Rich". The New York Times. Retrieved 2011-08-16.
- ↑ "If Warren Buffett Wants a Bigger Tax Bill, Why Doesn't He Just Send His Money to Washington?". CNBC. 2011-08-15. Retrieved 2011-08-16.
- ↑ "A look at the world's new corporate tax havens". CBS News. 2011-08-14. Retrieved 2011-08-15.
Economist Martin Sullivan says it's standard operating procedure for companies like Cisco. "U.S. multinationals are shifting their research facilities, shifting their manufacturing facilities, and shifting some regional headquarters into Switzerland and into Ireland. And those are massive numbers of jobs." ... An increasingly popular way, particularly pharmaceutical and hi-tech companies like Google avoid paying the 35 percent is to shift their patents, computer code, pill formulas, even logos from their U.S. bases to their outposts in low-tax countries.
- ↑ "Ballmer Says Tax Would Move Microsoft Jobs Offshore". Bloomberg. 2009-06-03. Retrieved 2011-08-15.
- ↑ CBO-Corporate Income Tax Rates International Comparison-November 2005
- ↑ FRED Database-Corporate Profits After Tax-Retrieved December 13, 2012
- ↑ FRED Database-Corporate Profits and Federal Income tax revenues-Retrieved May 25, 2013
- ↑ Tax Policy Center Briefing Book-Retrieved 31 December 2009
- ↑ Bloomberg-Simon Johnson-Tax Cutters Setup Tomorrow's Fiscal Crisis-December 2010
- ↑ International Comparison of Taxes by Australian Treasury
- ↑ CIA World Factbook, population data from 2010, Spending and GDP data from 2011
- ↑ Corporate Income Tax Rates: International Comparisons
- ↑ NYT-Bruce Bartlett-Are Taxes in the U.S. High or Low?-May 2011
- ↑ Mitt Romney Campaign Website-Tax Policy-Retrieved October 20, 2012
- ↑ Politico-Presidential Debate Transcript of October 16, 2012-Retrieved October 20, 2012
- 1 2 Bloomberg-Cap of $25,000 on Deductions Would Cover 32% of Tax Cuts
- ↑ http://www.taxpolicycenter.org/UploadedPDF/1001631-FAQ-Romney-plan.pdf
- ↑ Atlantic-The Six Studies Paul Ryan Cited Prove Mitt Romney's Tax Plan Is Impossible-October 12, 2012
- ↑ Press Release-Office of John Boehner
- ↑ CBS-Cantor: Spending, Not Revenue, Is the Problem-April 2011
- ↑ President Obama-Remarks by the President on Fiscal Policy-April 13, 2011
- ↑ the Press-Transcript from April 17, 2011
- ↑ CBO Historical Tables-January 2011
- ↑ NYT-Recession is Culprit in High U.S. Debt-August 20, 2011
- ↑ CBO Monthly Budget Review for September 2012-October 5, 2012
- ↑ http://www.dollarsandsense.org/archives/2013/0313friedman.html
- ↑ CBO Long-Term Budget Outlook-June 2010
- ↑ Krugman, Paul. Willie Sutton Wept. The New York Times. February 18, 2011.]
- ↑ 2015 Annual Report of the Boards of Trustees of the Federal Hospital Insurance and Federal Supplementary Medicare Insurance Trust Funds-Retrieved July 28, 2015
- ↑ NYT-Paul Krugman-The Disappearing Entitlements Crisis-July 26, 2015
- ↑ http://www.gao.gov/cgi-bin/getrpt?GAO-05-734SP
- ↑ Kidd, Thomas S. "Hooked on handouts". USA Today. Archived from the original on May 23, 2008. Retrieved May 26, 2010.
- ↑ Harvard Briefing Paper
- ↑ ""White House Reports Billions of Improper Payments in 2009" CNN, November 2009" (URL). November 18, 2009. Retrieved November 18, 2009.
- ↑ OMB Blog-Improper Payments-November 2009
- ↑ Whitehouse-Improper Payments Elimination and Recovery Act
- ↑ I.O.U.S.A. Movie Byte Sized-YouTube Excerpt – Quote About 26 Minutes In
- ↑ Charlie Rose-Interview with Economists Stiglitz and Feldstein-January 2009
- ↑ CBO-Budgetary Impact of ARRA
- 1 2 CBO-Estimated Impact of ARRA-August 2011
- ↑ Shear, Michael D.; Mostrous, Alexi (2009-07-17). "Biden Fires Back At Stimulus Critics". Washington Post. Retrieved 2011-08-15.
- ↑ CBO-The Effect of Automatic Stabilizers on the Federal Budget-May 2010
- ↑ Federal Budget Summary Tables
- ↑ 2010 Budget
- ↑ Washington Post-Montgomery-Battle Lines Quickly Set Over Planned Policy Shifts
- ↑ CBO Letter to Senator Harry Reid-December 19, 2009 See Table 1 and Page 16
- ↑ NYT-Holtz-Eakin Op Ed-The Real Arithmetic of Healthcare Reform-March 2010
- ↑ CBPP-Recession Continues to Batter State Budgets-February 2010
- ↑ CBPP-Recession Continues to Batter State Budgets-July 2010
- ↑ NYT-Why Budget Cuts Don't Bring Prosperity-February 2011
- ↑ Rockefeller Institute-Boyd-Presentation-November 2009
- ↑ Pew Center on the States-The Trillion Dollar Gap-February 2010
- ↑ Matt Miller-The Deal-February 2011-The World Wonders, Can States Go Bankrupt?
- ↑ Social Security Trustees Report – 2009 Summary
- ↑ S&P Press Release-April 18, 2011
- ↑ MSNBC-S&P Issues Negative Outlook-April 19, 2011
- ↑ Swann, Nikola G et. al (Standard & Poor's) (August 5, 2011). "United States of America Long-Term Rating Lowered To 'AA+' Due To Political Risks, Rising Debt Burden; Outlook Negative" (Press release). The McGraw-Hill Companies. Retrieved August 5, 2011.
- ↑ "United States of America Long-Term Rating Lowered To 'AA+' On Political Risks And Rising Debt Burden; Outlook Negative" (PDF). Standardandpoors.com. August 5, 2011. Retrieved August 7, 2011.
External links
- CBO Long-Term Budget Outlook-June 2012
- The Hamilton Project-A Dozen Economic Facts About Tax Reform-May 2012
- GAO-U.S. Financial Condition and Fiscal Future Briefing-January 2008
- Commonwealth Club of California-Dr. Yaron Brook and Dr. David Callahan: Is Capitalism Moral? A Debate – October 22, 2012
- Cogan, John F. (2002). "Federal Budget". In David R. Henderson (ed.). Concise Encyclopedia of Economics (1st ed.). Library of Economics and Liberty. OCLC 317650570, 50016270, 163149563
- Kotlikoff, Laurence J. (2002). "Federal Deficit". In David R. Henderson (ed.). Concise Encyclopedia of Economics (1st ed.). Library of Economics and Liberty. OCLC 317650570, 50016270, 163149563