National debt of the United States
.png)
| This article is part of a series on the |
| Budget and debt in the United States of America |
|---|
  |
|
Programs |
|
Contemporary issues In specific years |
|
Terminology |
The National debt of the United States is the total of deposits in U.S. Treasury Security accounts in the Federal Reserve Bank. The measure of the public debt is the value of the outstanding Treasury securities at a point of time that have been issued by the Treasury and other federal government agencies. The terms national deficit and national surplus usually refer to the federal government budget balance from year to year, not the cumulative total. A deficit year increases the debt because more money is spent than is received; a surplus year decreases the debt because more money is received than spent.
There are two components of gross national debt:[1]
- Debt held by the public, such as Treasury securities held by investors outside the federal government, including those held by individuals, corporations, the Federal Reserve System and foreign, state and local governments.
- Debt held by government accounts or intragovernmental debt, such as non-marketable Treasury securities held in accounts administered by the federal government that are owed to program beneficiaries, such as the Social Security Trust Fund. Debt held by government accounts represents the cumulative surpluses, including interest earnings, of these accounts that have been invested in Treasury securities. The governments market funds ideas for the improvement of debt and loss.
In general, government debt increases as a result of government spending, and decreases from tax or other receipts, both of which fluctuate during the course of a fiscal year. In practice, Treasury securities are not issued or redeemed on a day-by-day basis,[2] and may also be issued or redeemed as part of the federal government's macroeconomic monetary management operations. The aggregate, gross amount that Treasury can borrow is limited by the United States debt ceiling.[3]
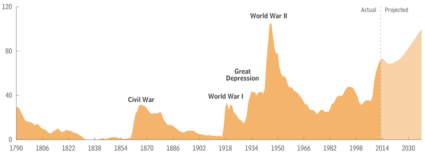
Historically, the US public debt as a share of gross domestic product (GDP) has increased during wars and recessions, and subsequently declined. The ratio of debt to GDP may decrease as a result of a government surplus or due to growth of GDP and inflation. For example, debt held by the public as a share of GDP peaked just after World War II (113% of GDP in 1945), but then fell over the following 35 years. In recent decades, however, aging demographics and rising healthcare costs have led to concern about the long-term sustainability of the federal government's fiscal policies.[4]
On November 7, 2016, debt held by the public was $14.3 trillion or about 76% of the previous 12 months of GDP.[5][6][7][8] Intragovernmental holdings stood at $5.4 trillion, giving a combined total gross national debt of $19.8 trillion or about 106% of the previous 12 months of GDP.[7] $6.2 trillion or approximately 45% of the debt held by the public was owned by foreign investors, the largest of which were China and Japan at about $1.25 trillion for China and $1.15 trillion for Japan as of May 2016.[9]
History
.png)
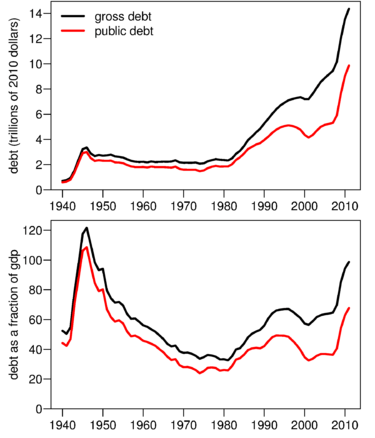
The United States government has continuously had a fluctuating public debt since its formation in 1789, except for about a year during 1835–1836. To allow comparisons over the years, public debt is often expressed as a ratio to gross domestic product (GDP). Historically, the United States public debt as a share of GDP has increased during wars and recessions, and subsequently declined.
The United States public debt as a percentage of GDP reached its highest level during Harry Truman's first presidential term, during and after World War II. Public debt as a percentage of GDP fell rapidly in the post-World War II period, and reached a low in 1974 under Richard Nixon. Debt as a share of GDP has consistently increased since then, except under Jimmy Carter and Bill Clinton. Public debt rose during the 1980s, as Ronald Reagan cut tax rates and increased military spending. It fell during the 1990s, due to decreased military spending, increased taxes and the 1990s boom. Public debt rose sharply in the wake of the 2007–08 financial crisis and the resulting significant tax revenue declines and spending increases.
Valuation and measurement
Public and government accounts
On January 26, 2016, debt held by the public was $13.62 trillion or about 75% of the previous 12 months of GDP.[5][6][7][8] Intragovernmental holdings stood at $5.34 trillion, giving a combined total gross national debt of $18.96 trillion or about 104% of the previous 12 months of GDP.[7]
The national debt can also be classified into marketable or non-marketable securities. Most of the marketable securities are Treasury notes, bills, and bonds held by investors and governments globally. The non-marketable securities are mainly the "government account series" owed to certain government trust funds such as the Social Security Trust Fund, which represented $2.74 trillion in 2011.[10]
The non-marketable securities represent amounts owed to program beneficiaries. For example, in the case of the Social Security Trust Fund, the payroll taxes dedicated to Social Security were credited to the Trust Fund upon receipt, but spent for other purposes. If the government continues to run deficits in other parts of the budget, the government will have to issue debt held by the public to fund the Social Security Trust Fund, in effect exchanging one type of debt for the other.[11] Other large intragovernmental holders include the Federal Housing Administration, the Federal Savings and Loan Corporation's Resolution Fund and the Federal Hospital Insurance Trust Fund (Medicare).
Accounting treatment
Only debt held by the public is reported as a liability on the consolidated financial statements of the United States government. Debt held by government accounts is an asset to those accounts but a liability to the Treasury; they offset each other in the consolidated financial statements.[12]
Government receipts and expenditures are normally presented on a cash rather than an accrual basis, although the accrual basis may provide more information on the longer-term implications of the government's annual operations.[13] The United States public debt is often expressed as a ratio of public debt to gross domestic product (GDP). The ratio of debt to GDP may decrease as a result of a government surplus as well as due to growth of GDP and inflation.
Fannie Mae and Freddie Mac obligations excluded
Under normal accounting rules, fully owned companies would be consolidated into the books of the owner, but the large size of Fannie and Freddie has made the U.S. government reluctant to incorporate Freddie and Fannie into its own books. When Freddie and Fannie required bail-outs, White House Budget Director Jim Nussle, on September 12, 2008, initially indicated their budget plans would not incorporate the GSE debt into the budget because of the temporary nature of the conservator intervention.[14] As the intervention has dragged out, pundits have started to further question this accounting treatment, noting that changes in August 2012 "makes them even more permanent wards of the state and turns the government's preferred stock into a permanent, perpetual kind of security".[15]
The government controls the Public Company Accounting Oversight Board, which would normally criticize inconsistent accounting practices, but it does not oversee its own government's accounting practices or the standards set by the Federal Accounting Standards Advisory Board. The on- or off-balance sheet obligations of those two independent GSEs was just over $5 trillion at the time the conservatorship was put in place, consisting mainly of mortgage payment guarantees and agency bonds.[16] The confusing independent but government-controlled status of the GSEs has resulted in investors of the legacy common shares and preferred shares launching various activist campaigns in 2014.[17]
Guaranteed obligations excluded
U.S. federal government guarantees are not included in the public debt total, until such time as there is a call on the guarantees. For example, the U.S. federal government in late-2008 guaranteed large amounts of obligations of mutual funds, banks, and corporations under several programs designed to deal with the problems arising from the late-2000s financial crisis. The guarantee program lapsed at the end of 2012 when Congress declined to extend the scheme. The funding of direct investments made in response to the crisis, such as those made under the Troubled Assets Relief Program, are included in the debt.
Unfunded obligations excluded
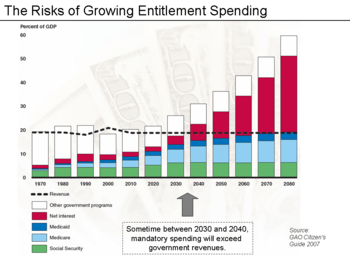
The U.S. government is obligated under current law to make mandatory payments for programs such as Medicare, Medicaid and Social Security. The Government Accountability Office (GAO) projects that payouts for these programs will significantly exceed tax revenues over the next 75 years. The Medicare Part A (hospital insurance) payouts already exceed program tax revenues, and social security payouts exceeded payroll taxes in fiscal 2010. These deficits require funding from other tax sources or borrowing.[18] The present value of these deficits or unfunded obligations is an estimated $45.8 trillion. This is the amount that would have had to be set aside in 2009 in order to pay for the unfunded obligations which, under current law, will have to be raised by the government in the future. Approximately $7.7 trillion relates to Social Security, while $38.2 trillion relates to Medicare and Medicaid. In other words, health care programs will require nearly five times more funding than Social Security. Adding this to the national debt and other federal obligations would bring total obligations to nearly $62 trillion.[19] However, these unfunded obligations are not counted in the national debt.
Measuring debt burden
GDP is a measure of the total size and output of the economy. One measure of the debt burden is its size relative to GDP, called the "debt-to-GDP ratio." Mathematically, this is the debt divided by the GDP amount. The Congressional Budget Office includes historical budget and debt tables along with its annual "Budget and Economic Outlook." Debt held by the public as a percentage of GDP rose from 34.7% GDP in 2000 to 40.5% in 2008 and 67.7% in 2011.[20]
Mathematically, the ratio can decrease even while debt grows, if the rate of increase in GDP (which also takes account of inflation) is higher than the rate of increase of debt. Conversely, the debt to GDP ratio can increase even while debt is being reduced, if the decline in GDP is sufficient.
According to the CIA World Factbook, during 2015, the U.S. debt to GDP ratio of 73.6% was the 39th highest in the world. This was measured using "debt held by the public."[21] However, $1 trillion in additional borrowing since the end of FY 2015 has raised the ratio to 76.2% as of April 2016 [See Appendix#National debt for selected years]. Also, this number excludes state and local debt. According to the OECD, general government gross debt (federal, state, and local) in the United States in the fourth quarter of 2015 was $22.5 trillion (125% of GDP); subtracting out $5.25 trillion for intergovernmental federal debt to count only federal "debt held by the public" gives 96% of GDP.[22]
The ratio is higher if the total national debt is used, by adding the "intragovernmental debt" to the "debt held by the public." For example, on April 29, 2016, debt held by the public was approximately $13.84 trillion or about 76% of GDP. Intra-governmental holdings stood at $5.35 trillion, giving a combined total public debt of $19.19 trillion. U.S. GDP for the previous 12 months was approximately $18.15 trillion, for a total debt to GDP ratio of approximately 106%.[23]
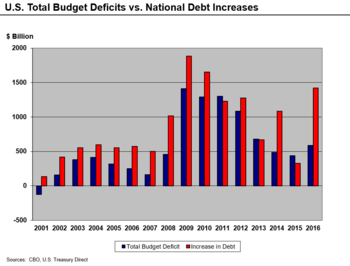
Calculating the annual change in debt

Conceptually, an annual deficit (or surplus) should represent the change in the national debt, with a deficit adding to the national debt and a surplus reducing it. However, there is complexity in the budgetary computations that can make the deficit figure commonly reported in the media (the "total deficit") considerably different from the annual increase in the debt. The major categories of differences are the treatment of the Social Security program, Treasury borrowing, and supplemental appropriations outside the budget process.[24]
Social Security payroll taxes and benefit payments, along with the net balance of the U.S. Postal Service, are considered "off-budget", while most other expenditure and receipt categories are considered "on-budget". The total federal deficit is the sum of the on-budget deficit (or surplus) and the off-budget deficit (or surplus). Since FY1960, the federal government has run on-budget deficits except for FY1999 and FY2000, and total federal deficits except in FY1969 and FY1998–FY2001.[25]
For example, in January 2009 the CBO reported that for fiscal year 2008 (FY2008) the "on-budget deficit" was $638 billion, offset by an "off-budget surplus" (mainly due to Social Security revenue in excess of payouts) of $183 billion, for a "total deficit" of $455 billion. This latter figure was the one commonly reported in the media. However, an additional $313 billion was required for "the Treasury actions aimed at stabilizing the financial markets," an unusually high amount due to the Subprime mortgage crisis. This meant that the "debt held by the public" increased by $768 billion ($455B + $313B = $768B). The "off-budget surplus" was borrowed and spent (as is typically the case), increasing the "intra-governmental debt" by $183 billion. So the total increase in the "National debt" in FY2008 was $768B +$183B = $951 billion.[24] The Treasury Department reported an increase in the National Debt of $1,017B for FY2008.[26] The $66 billion difference is likely due to "supplemental appropriations" for the War on Terror, some of which were outside the budget process entirely until President Obama began including most of them in his FY2010 budget.[27]
In other words, spending the "off budget" Social Security surplus adds to the total national debt (by increasing the intragovernmental debt) while the "off-budget" surplus reduces the "total" deficit reported in the media. Certain spending called "supplemental appropriations" is outside the budget process entirely but adds to the national debt. Funding for the Iraq and Afghanistan wars was accounted for this way prior to the Obama administration.[27] Certain stimulus measures and earmarks were also outside the budget process. The federal government publishes the total debt owed (public and intragovernmental holdings) monthly.[28]
Reduction
Negative real interest rates
Since 2010, the U.S. Treasury has been obtaining negative real interest rates on government debt, meaning the inflation rate is greater than the interest rate paid on the debt.[29] Such low rates, outpaced by the inflation rate, occur when the market believes that there are no alternatives with sufficiently low risk, or when popular institutional investments such as insurance companies, pensions, or bond, money market, and balanced mutual funds are required or choose to invest sufficiently large sums in Treasury securities to hedge against risk.[30][31]
Economist Lawrence Summers and blogger Matthew Yglesias have stated that at such low interest rates, government borrowing actually saves taxpayer money and improves creditworthiness.[32][33]
In the late 1940s through the early 1970s, the US and UK both reduced their debt burden by about 30% to 40% of GDP per decade by taking advantage of negative real interest rates, but there is no guarantee that government debt rates will continue to stay so low.[30][34] Between 1946 and 1974, the US debt-to-GDP ratio fell from 121% to 32% even though there were surpluses in only eight of those years which were much smaller than the deficits.[35]
Converting fractional reserve to full reserve banking
The two economists, Jaromir Benes and Michael Kumhof, working for the International Monetary Fund, published a working paper called The Chicago Plan Revisited suggesting that the debt could be eliminated by raising bank reserve requirements, converting from fractional reserve banking to full reserve banking.[36][37] Economists at the Paris School of Economics have commented on the plan, stating that it is already the status quo for coinage currency,[38] and a Norges Bank economist has examined the proposal in the context of considering the finance industry as part of the real economy.[39] A Centre for Economic Policy Research paper agrees with the conclusion that, "no real liability is created by new fiat money creation, and therefore public debt does not rise as a result".[40]
Debt ceiling

The debt ceiling is a legislative mechanism to limit the amount of national debt that can be issued by the Treasury. In effect, it will restrain the Treasury from paying for expenditures after the limit has been reached, even if the expenditures have already been approved (in the budget) and have been appropriated. If this situation were to occur, it is unclear whether Treasury would be able to prioritize payments on debt to avoid a default on its debt obligations, but it would have to default on some of its non-debt obligations.
In 1995[41] and 2011,[42][43] congressional Republicans unsuccessfully made threats of default on the national debt through non-renewal of the debt ceiling to try to obtain political concessions from President Bill Clinton and President Barack Obama, respectively.
Debt holdings

Because a large variety of people own the notes, bills, and bonds in the "public" portion of the debt, Treasury also publishes information that groups the types of holders by general categories to portray who owns United States debt. In this data set, some of the public portion is moved and combined with the total government portion, because this amount is owned by the Federal Reserve as part of United States monetary policy. (See Federal Reserve System.)
As is apparent from the chart, a little less than half of the total national debt is owed to the "Federal Reserve and intragovernmental holdings". The foreign and international holders of the debt are also put together from the notes, bills, and bonds sections. To the right is a chart for the data as of June 2008:
Foreign holdings

As of September 2014, foreigners owned $6.06 trillion of U.S. debt, or approximately 47% of the debt held by the public of $12.8 trillion and 34% of the total debt of $17.8 trillion.[44] The largest holders were China, Japan, Belgium, the Caribbean banking centers, and oil exporters.[45]
The share held by foreign governments has grown over time, rising from 13% of the public debt in 1988[47] to 25% in 2007.[48]
As of September 2014 the largest single holder of U.S. government debt was China, with 21% of all foreign-held U.S. Treasury securities (10% of total U.S. public debt).[49] China's holdings of government debt, as a percentage of all foreign-held government debt are up significantly since 2000 (when China held just 6 percent of all foreign-held U.S. Treasury securities).[50]
This exposure to potential financial or political risk should foreign banks stop buying Treasury securities or start selling them heavily was addressed in a June 2008 report issued by the Bank of International Settlements, which stated, "Foreign investors in U.S. dollar assets have seen big losses measured in dollars, and still bigger ones measured in their own currency. While unlikely, indeed highly improbable for public sector investors, a sudden rush for the exits cannot be ruled out completely."[51]
On May 20, 2007, Kuwait discontinued pegging its currency exclusively to the dollar, preferring to use the dollar in a basket of currencies. Syria made a similar announcement on June 4, 2007.[52] In September 2009 China, India and Russia said they were interested in buying International Monetary Fund gold to diversify their dollar-denominated securities.[53] However, in July 2010 China's State Administration of Foreign Exchange "ruled out the option of dumping its vast holdings of US Treasury securities" and said gold "cannot become a main channel for investing our foreign exchange reserves" because the market for gold is too small and prices are too volatile.
According to Paul Krugman, "It's true that foreigners now hold large claims on the United States, including a fair amount of government debt. But every dollar's worth of foreign claims on America is matched by 89 cents' worth of U.S. claims on foreigners. And because foreigners tend to put their U.S. investments into safe, low-yield assets, America actually earns more from its assets abroad than it pays to foreign investors. If your image is of a nation that's already deep in hock to the Chinese, you've been misinformed. Nor are we heading rapidly in that direction."[54]
Forecasting


CBO short-term outlook
The Congressional Budget Office (CBO) reported in its February 2014 Budget and Economic Outlook (which covers the 2014–2024 period) that deficits were projected to return to approximately the historical average relative to the size of the economy (GDP) by 2014. The CBO estimated that under current law, the deficit would total $514 billion in fiscal year 2014 or 3.0% GDP. Deficits would then slowly begin rising again through 2024 due primarily to the pressures of an aging population and rising healthcare costs per person. The debt to GDP ratio would remain stable for much of the decade then begin rising again toward the end of the 10-year forecast window, from 74% in 2014 to 79% in 2024.[55]
CBO long-term outlook
The CBO reports its Long-Term Budget Outlook annually, providing at least two scenarios for spending, revenue, deficits, and debt. The 2014 Outlook mainly covers the 25-year period through 2039. The "extended baseline scenario" assumes that the laws currently on the books will be implemented, for the most part. The CBO reported in July 2014 that under this scenario:
If current laws remained generally unchanged in the future, federal debt held by the public would decline slightly relative to GDP over the next few years. After that, however, growing budget deficits would push debt back to and above its current high level. Twenty-five years from now, in 2039, federal debt held by the public would exceed 100 percent of GDP. Moreover, debt would be on an upward path relative to the size of the economy, a trend that could not be sustained indefinitely. By 2039, the deficit would equal 6.5 percent of GDP, larger than in any year between 1947 and 2008, and federal debt held by the public would reach 106 percent of GDP, more than in any year except 1946—even without factoring in the economic effects of growing debt.[56]
The "extended alternative fiscal scenario" assumes the continuation of present trends, which result in a more unfavorable debt position and adverse economic consequences relative to the baseline scenario. The CBO reported in July 2014 that under this scenario:
[C]ertain policies that are now in place but are scheduled to change under current law are assumed to continue, and some provisions of current law that might be difficult to sustain for a long period are assumed to be modified. Under that scenario, deficits excluding interest payments would be about $2 trillion larger over the first decade than those under the baseline; subsequently, such deficits would be larger than those under the extended baseline by rapidly increasing amounts, doubling as a percentage of GDP in less than 10 years. CBO projects that real GNP in 2039 would be about 5 percent lower under the extended alternative fiscal scenario than under the extended baseline with economic feedback, and that interest rates would be about three-quarters of a percentage point higher. Reflecting the budgetary effects of those economic developments, federal debt would rise to 183 percent of GDP in 2039.[56]
Over the long-term, the CBO projects that interest expense and mandatory spending categories (e.g., Medicare, Medicaid and Social Security) will continue to grow relative to GDP, while discretionary categories (e.g., Defense and other Cabinet Departments) continue to fall relative to GDP. Debt is projected to continue rising relative to GDP under the above two scenarios, although the CBO did also offer other scenarios that involved austerity measures that would bring the debt to GDP ratio down.[56]
The CBO estimated under the baseline scenario that the U.S. debt held by the public would increase approximately $8.5 trillion between the end of 2014 and 2024. Under a $2 trillion deficit reduction scenario during that first decade, federal debt held by the public in 2039 would stand at 75 percent of GDP, only slightly above the value of 72 percent at the end of 2013. Under a $4 trillion deficit reduction scenario for that decade, federal debt held by the public would fall to 42 percent of GDP in 2039. By comparison, such debt was 35 percent of GDP in 2007 and has averaged 39 percent of GDP during the past 40 years.[56]
The CBO reported in September 2011: "The nation cannot continue to sustain the spending programs and policies of the past with the tax revenues it has been accustomed to paying. Citizens will either have to pay more for their government, accept less in government services and benefits, or both."[57]
Risks and debates
CBO risk factors
The CBO reported several types of risk factors related to rising debt levels in a July 2010 publication:
- A growing portion of savings would go towards purchases of government debt, rather than investments in productive capital goods such as factories and computers, leading to lower output and incomes than would otherwise occur;
- If higher marginal tax rates were used to pay rising interest costs, savings would be reduced and work would be discouraged;
- Rising interest costs would force reductions in government programs;
- Restrictions to the ability of policymakers to use fiscal policy to respond to economic challenges; and
- An increased risk of a sudden fiscal crisis, in which investors demand higher interest rates.[58]
Concerns over Chinese holdings of U.S. debt
Many American and other economic analysts have expressed concerns on account of the People's Republic of China's "extensive" holdings of United States government debt,[59][60] as part of their reserves.
The National Defense Authorization Act of the fiscal year 2012 included a provision requiring the Secretary of Defense to conduct a "national security risk assessment of U.S. federal debt held by China." The Department issued its report in July 2012, stating that "attempting to use U.S. Treasury securities as a coercive tool would have limited effect and likely would do more harm to China than to the United States. As the threat is not credible and the effect would be limited even if carried out, it does not offer China deterrence options, whether in the diplomatic, military, or economic realms, and this would remain true both in peacetime and in scenarios of crisis or war."[61]
The 112th United States Congress introduced legislation whose aim was the assessment of the implications of China's ownership of U.S. debt.[61] The 2013 Report claimed that "[a] potentially serious short-term problem would emerge if China decided to suddenly reduce their liquid U.S. financial assets significantly" [emphasis in the original text], noting, also, that Federal Reserve System Chairman Ben Bernanke had, in 2007, stated that "because foreign holdings of U.S. Treasury securities represent only a small part of total U.S. credit market debt outstanding, U.S. credit markets should be able to absorb without great difficulty any shift of foreign allocations."[61]
A significant number of economists and analysts dismiss any and all concerns over foreign holdings of United States government debt denominated in U.S. dollars, including China's holdings.[62][63][64][65]
Sustainability
According to the Government Accountability Office (GAO), the United States is on a "fiscally unsustainable" path because of projected future increases in Medicare and Social Security spending.[18]
Risks to economic growth
Debt levels may affect economic growth rates. In 2010, economists Kenneth Rogoff and Carmen Reinhart reported that among the 20 developed countries studied, average annual GDP growth was 3–4% when debt was relatively moderate or low (i.e. under 60% of GDP), but it dips to just 1.6% when debt was high (i.e., above 90% of GDP).[66] In April 2013, the conclusions of Rogoff and Reinhart's study came into question when a coding error in their original paper was discovered by Herndon, Ash and Pollin of the University of Massachusetts, Amherst.[67][68] Herndon, Ash and Pollin found that after correcting for errors and unorthodox methods used, there was no evidence that debt above a specific threshold reduces growth.[69] Reinhart and Rogoff maintain that after correcting for errors, a negative relationship between high debt and growth remains.[70] However, other economists, including Paul Krugman, have argued that it is low growth which causes national debt to increase, rather than the other way around.[71][72][73]
Former Federal Reserve Chairman Ben Bernanke stated in April 2010 that "Neither experience nor economic theory clearly indicates the threshold at which government debt begins to endanger prosperity and economic stability. But given the significant costs and risks associated with a rapidly rising federal debt, our nation should soon put in place a credible plan for reducing deficits to sustainable levels over time."[74]
Interest and debt service costs
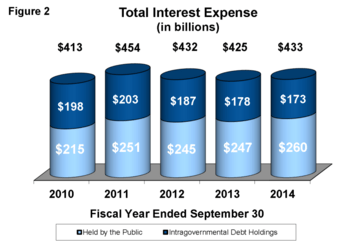
Despite rising debt levels, interest costs have remained at approximately 2008 levels (around $450 billion in total) due to lower than long-term interest rates paid on government debt in recent years.[75] However, interest rates may return to higher historical levels.[76]
The cost of servicing the U.S. national debt can be measured in various ways. The CBO analyzes net interest as a percentage of GDP, with a higher percentage indicating a higher interest payment burden. During 2015, this was 1.3% GDP, close to the record low 1.2% of the 1966–1968 era. The average from 1966 to 2015 was 2.0% of GDP.[77] However, the CBO estimated in 2016 that the interest amounts and % GDP will increase significantly over the following decade as both interest rates and debt levels rise: "Interest payments on that debt represent a large and rapidly growing expense of the federal government. CBO's baseline shows net interest payments more than tripling under current law, climbing from $231 billion in 2014, or 1.3 percent of GDP, to $799 billion in 2024, or 3.0 percent of GDP—the highest ratio since 1996."[78]
Definition of public debt
Economists also debate the definition of public debt. Krugman argued in May 2010 that the debt held by the public is the right measure to use, while Reinhart has testified to the President's Fiscal Reform Commission that gross debt is the appropriate measure.[71] The Center on Budget and Policy Priorities (CBPP) cited research by several economists supporting the use of the lower debt held by the public figure as a more accurate measure of the debt burden, disagreeing with these Commission members.[79]
There is debate regarding the economic nature of the intragovernmental debt, which was approximately $4.6 trillion in February 2011.[80] For example, the CBPP argues: that "large increases in [debt held by the public] can also push up interest rates and increase the amount of future interest payments the federal government must make to lenders outside of the United States, which reduces Americans' income. By contrast, intragovernmental debt (the other component of the gross debt) has no such effects because it is simply money the federal government owes (and pays interest on) to itself."[79]
However, if the U.S. government continues to run "on budget" deficits as projected by the CBO and OMB for the foreseeable future, it will have to issue marketable Treasury bills and bonds (i.e., debt held by the public) to pay for the projected shortfall in the Social Security program. This will result in "debt held by the public" replacing "intragovernmental debt".[81][82]
Intergenerational equity
One debate about the national debt relates to intergenerational equity. For example, if one generation is receiving the benefit of government programs or employment enabled by deficit spending and debt accumulation, to what extent does the resulting higher debt impose risks and costs on future generations? There are several factors to consider:
- For every dollar of debt held by the public, there is a government obligation (generally marketable Treasury securities) counted as an asset by investors. Future generations benefit to the extent these assets are passed on to them.[83]
- As of 2010, approximately 72% of the financial assets were held by the wealthiest 5% of the population.[84] This presents a wealth and income distribution question, as only a fraction of the people in future generations will receive principal or interest from investments related to the debt incurred today.
- To the extent the U.S. debt is owed to foreign investors (approximately half the "debt held by the public" during 2012), principal and interest are not directly received by U.S. heirs.[83]
- Higher debt levels imply higher interest payments, which create costs for future taxpayers (e.g., higher taxes, lower government benefits, higher inflation, or increased risk of fiscal crisis).[58]
- To the extent the borrowed funds are invested today to improve the long-term productivity of the economy and its workers, such as via useful infrastructure projects or education, future generations may benefit.[85]
- For every dollar of intragovernmental debt, there is an obligation to specific program recipients, generally non-marketable securities such as those held in the Social Security Trust Fund. Adjustments that reduce future deficits in these programs may also apply costs to future generations, via higher taxes or lower program spending.
Krugman wrote in March 2013 that by neglecting public investment and failing to create jobs, we are doing far more harm to future generations than merely passing along debt: "Fiscal policy is, indeed, a moral issue, and we should be ashamed of what we're doing to the next generation's economic prospects. But our sin involves investing too little, not borrowing too much." Young workers face high unemployment and studies have shown their income may lag throughout their careers as a result. Teacher jobs have been cut, which could affect the quality of education and competitiveness of younger Americans.[86]
Credit default
The US has never fully defaulted.[87][88]
In April 1979, however, the United States may have technically defaulted on $122 million in Treasury bills, which was less than 1% of U.S. debt. The Treasury Department characterized it as a delay rather than as a default, but it did have consequences for short-term interest rates, which jumped 0.6%.[89] Others view it as a temporary, partial default.[90][91][92]
Appendix
National debt for selected years
| Fiscal year | Total debt [93][94][95] |
Total debt as % of GDP |
Public debt | Public debt as % of GDP |
GDP ($ billions)[96] |
|---|---|---|---|---|---|
| 1910 | 2.65/- | 8.1% | 2.65 | 8.1% | est. 32.8 |
| 1920 | 25.95/- | 29.2% | 25.95 | 29.2% | est. 88.6 |
| 1927 | [97] 18.51/- | 19.2% | 18.51 | 19.2% | est. 96.5 |
| 1930 | 16.19/- | 16.6% | 16.19 | 16.6% | est. 97.4 |
| 1940 | 42.97/50.70 | 43.8–51.6% | 42.77 | 43.6% | -/98.2 |
| 1950 | 257.3/256.9 | 92.0% | 219.0 | 78.4% | 279.0 |
| 1960 | 286.3/290.5 | 53.6–54.2% | 236.8 | 44.3% | 535.1 |
| 1970 | 370.9/380.9 | 35.4–36.4% | 283.2 | 27.0% | 1,049 |
| 1980 | 907.7/909.0 | 32.4–32.6% | 711.9 | 25.5% | 2,796 |
| 1990 | 3,233/3,206 | 54.2–54.6% | 2,400 | 40.8% | 5,915 |
| 2000 | a15,659 | a55.8% | a3,450 | 33.9% | 10,150 |
| 2001 | a25,792 | a54.8% | a3,350 | 31.6% | 10,550 |
| 2002 | a36,213 | a57.1% | a3,550 | 32.7% | 10,900 |
| 2003 | a6,783 | a 59.9% | a3,900 | 34.6% | 11,350 |
| 2004 | a7,379 | a 61.0% | a4,300 | 35.6% | 12,100 |
| 2005 | a47,918 | a 61.4% | a4,600 | 35.7% | 12,900 |
| 2006 | a58,493 | a 62.1% | a4,850 | 35.4% | 13,700 |
| 2007 | a68,993 | a 62.8% | a5,050 | 35.3% | 14,300 |
| 2008 | a710,011 | a 67.9% | a5,800 | 39.4% | 14,750 |
| 2009 | a811,898 | a 82.5% | a7,550 | 52.4% | 14,400 |
| 2010 | a913,551 | a 91.6% | a9,000 | 61.0% | 14,800 |
| 2011 | a1014,781 | a 96.1% | a10,150 | 65.8% | 15,400 |
| 2012 | a1116,059 | a100.2% | a11,250 | 70.3% | 16,050 |
| 2013 | a1216,732 | a101.3% | a12,000 | 72.6% | 16,500 |
| 2014 | a1317,810 | a103.4% | a12,800 | 74.2% | 17,200 |
| 2015 | a1418,138 | a101.3/101.8% | a13,100 | 73.3% | 17,900 |
| 2016 (Oct. '15 – Jul. '16 only) |
~19,428 | ~106.1% | ~13,998 | ~76.5% |
On June 25, 2014, the BEA announced: "[On July 30, 2014, i]n addition to the regular revision of estimates for the most recent 3 years and for the first quarter of 2014, GDP and select components will be revised back to the first quarter of 1999.
Fiscal years 1940–2009 GDP figures were derived from February 2011 Office of Management and Budget figures which contained revisions of prior year figures due to significant changes from prior GDP measurements. Fiscal years 1950–2010 GDP measurements were derived from December 2010 Bureau of Economic Analysis figures which also tend to be subject to revision, especially more recent years. Afterwards the OMB figures were revised back to 2004 and the BEA figures (in a revision dated July 31, 2013) were revised back to 1947.
Regarding estimates recorded in the GDP column (the last column) marked with a "~" symbol, absolute differences from advance (one month after) BEA reports of GDP percent change to current findings (as of November 2013) found in revisions are stated to be 1.3% ± 2.0% or a 95% probability of being within the range of 0.0–3.3%, assuming the differences to occur according to standard deviations from the average absolute difference of 1.3%. E.g. with an advance report of a $400 billion increase of a $10 trillion GDP, for example, one could be 95% confident that the range in which the exact GDP dollar amount lies would be 0.0 to 3.3% different than 4.0% (400 ÷ 10,000) or within the range of $0 to $330 billion different than the hypothetical $400 billion (a range of $70-730 billion). Two months after, with a revised value, the range of potential difference from the stated estimate shrinks, and three months after with another revised value the range shrinks again.
Fiscal years 1940–1970 begin July 1 of the previous year (for example, Fiscal Year 1940 begins July 1, 1939 and ends June 30, 1940); fiscal years 1980–2010 begin October 1 of the previous year. Intragovernmental debts before the Social Security Act are presumed to equal zero.
1909–1930 calendar year GDP estimates are from MeasuringWorth.com[98] Fiscal Year estimates are derived from simple linear interpolation.
(a1) Audited figure was "about $5,659 billion."[99]
(a2) Audited figure was "about $5,792 billion."[100]
(a3) Audited figure was "about $6,213 billion."[100]
(a) Audited figure was said to be "about" the stated figure.[101]
(a4) Audited figure was "about $7,918 billion."[102]
(a5) Audited figure was "about $8,493 billion."[102]
(a6) Audited figure was "about $8,993 billion."[103]
(a7) Audited figure was "about $10,011 billion."[103]
(a8) Audited figure was "about $11,898 billion."[104]
(a9) Audited figure was "about $13,551 billion."[105]
(a10) GAO affirmed Bureau of the Public debt figure as $14,781 billion.[106]
(a11) GAO affirmed Bureau of the Public debt figure as $16,059 billion.[106]
(a12) GAO affirmed Bureau of the Fiscal Service's figure as $16,732 billion.[107]
(a13) GAO affirmed Bureau of the Fiscal Service's figure as $17,810 billion.[6]
(a14) GAO affirmed Bureau of the Fiscal Service's figure as $18,138 billion.[108]
Interest paid
| Fiscal Year |
Historical debt outstanding, $billions, US[109] |
Interest paid $billions, US[110] |
Interest rate |
| 2014 | 17,824 | 430.8 | 2.42% |
| 2013 | 16,738 | 415.7 | 2.48% |
| 2012 | 16,066 | 359.8 | 2.24% |
| 2011 | 14,790 | 454.4 | 3.07% |
| 2010 | 13,562 | 414.0 | 3.05% |
| 2009 | 11,910 | 383.1 | 3.22% |
| 2008 | 10,025 | 451.2 | 4.50% |
| 2007 | 9,008 | 430.0 | 4.77% |
| 2006 | 8,507 | 405.9 | 4.77% |
| 2005 | 7,933 | 352.4 | 4.44% |
| 2004 | 7,379 | 321.6 | 4.36% |
| 2003 | 6,783 | 318.1 | 4.69% |
| 2002 | 6,228 | 332.5 | 5.34% |
| 2001 | 5,807 | 359.5 | 6.19% |
| 2000 | 5,674 | 362.0 | 6.38% |
| 1999 | 5,656 | 353.5 | 6.25% |
| 1998 | 5,526 | 363.8 | 6.58% |
| 1997 | 5,413 | 355.8 | 6.57% |
| 1996 | 5,225 | 344.0 | 6.58% |
| 1995 | 4,974 | 332.4 | 6.68% |
| 1994 | 4,693 | 296.3 | 6.31% |
| 1993 | 4,411 | 292.5 | 6.63% |
| 1992 | 4,065 | 292.4 | 7.19% |
| 1991 | 3,665 | 286.0 | 7.80% |
Foreign holders of US Treasury securities
The following is a list of the top foreign holders (over $100 billion) of US Treasury securities as listed by the US Treasury (revised by September 2016 survey):[111]
| Leading foreign holders of US Treasury securities as of September 2016 | |||
|---|---|---|---|
| Country | Billions of dollars (est.) | Ratio of owned US debt to 2015 GDP (est.)[112][113] | Percent change since September 2015 |
| | 1,157.0 | 6% | − 8% |
| | 1,136.4 | 28% | − 3% |
| | 270.9 | 95% | +22% |
| | 262.1 | n/a | +17% |
| | 258.1 | 15% | + 3% |
| | 240.7 | 36% | + 6% |
| | 227.0 | 393% | +19% |
| | 217.5 | 8% | + 7% |
| | 189.8 | 61% | − 4% |
| | 189.3 | 36% | + 6% |
| | 142.7 | 31% | + 5% |
| | 122.7 | 6% | + 8% |
| | 102.9 | 3% | +23% |
| | 101.3 | 35% | −18% |
| Others | 1,536.4 | n/a | + 1% |
| Grand total | 6,154.7 | n/a | + 1% |
Statistics

.png)
- U.S. official gold reserves as of 31 July 2014 total 261.5 million troy ounces with a book value of approximately $11.04 billion.[114]
- Foreign exchange reserves $140 billion as of September 2014.[115]
 United States balance of trade (1980–2014), with negative numbers denoting a trade deficit
 - The national debt equates to $59,143 per person U.S. population, or $159,759 per member of the U.S. working taxpayers, as of March 2016.[116]
- In 2008, $242 billion was spent on interest payments servicing the debt, out of a total tax revenue of $2.5 trillion, or 9.6%. Including non-cash interest accrued primarily for Social Security, interest was $454 billion or 18% of tax revenue.[103]
- Total U.S. household debt, including mortgage loan and consumer debt, was $11.4 trillion in 2005. By comparison, total U.S. household assets, including real estate, equipment, and financial instruments such as mutual funds, was $62.5 trillion in 2005.[117]
- Total U.S Consumer Credit Card revolving credit was $931.0 billion in April 2009.[118]
- The U.S. balance of trade deficit in goods and services was $725.8 billion in 2005.[119]
- According to the U.S. Department of Treasury Preliminary 2014 Annual Report on U.S. Holdings of Foreign Securities, the United States valued its foreign treasury securities portfolio at $2.7 trillion. The largest debtors are Canada, the United Kingdom, Cayman Islands, and Australia, whom account for $1.2 trillion of sovereign debt owed to residents of the U.S.[120]
- The entire public debt in 1998 was attributable to the cost of research, development, and deployment of U.S. nuclear weapons and nuclear weapons-related programs during the Cold War.[121][122][123]
A 1998 Brookings Institution study published by the Nuclear Weapons Cost Study Committee (formed in 1993 by the W. Alton Jones Foundation), calculated that total expenditures for U.S. nuclear weapons from 1940 to 1998 was $5.5 trillion in 1996 Dollars.[121] The total public debt at the end of fiscal year 1998 was $5,478,189,000,000 in 1998 Dollars[124] or $5.3 trillion in 1996 Dollars.
International debt comparisons
| Entity | 2007 | 2010 | 2011 |
|---|---|---|---|
| United States | 62% | 92% | 102% |
| European Union | 59% | 80% | 83% |
| Austria | 62% | 78% | 72% |
| France | 64% | 82% | 86% |
| Germany | 65% | 82% | 81% |
| Sweden | 40% | 39% | 38% |
| Finland | 35% | 48% | 49% |
| Greece | 104% | 123% | 165% |
| Romania | 13% | 31% | 33% |
| Bulgaria | 17% | 16% | 16% |
| Czech Republic | 28% | 38% | 41% |
| Italy | 112% | 119% | 120% |
| Netherlands | 52% | 77% | 65% |
| Poland | 51% | 55% | 56% |
| Spain | 42% | 68% | 68% |
| United Kingdom | 47% | 80% | 86% |
| Japan | 167% | 197% | 204% |
| Russia | 9% | 12% | 10% |
| Asia 1 | 37% | 40% | 41% |
| South America and Mexico 2 | 41% | 37% | 35% |
Sources: Eurostat,[125] International Monetary Fund, World Economic Outlook (emerging market economies); Organisation for Economic Co-operation and Development, Economic Outlook (advanced economies)[126]
1China, Hong Kong, India, Indonesia, Korea, Malaysia, the Philippines, Singapore and Thailand
2Argentina, Brazil, Chile and Mexico
Recent additions to the public debt of the United States
| Fiscal year (begins Oct. 1 of year prior to stated year) |
GDP $Billions |
New debt for fiscal year $Billions |
New debt as % of GDP |
Total debt $Billions |
Total debt as % of GDP (Debt to GDP ratio) |
|---|---|---|---|---|---|
| 1994 | $7,200 | $281–292 | 3.9–4.1% | ~$4,650 | 64.6–65.2% |
| 1995 | 7,600 | 277–281 | 3.7% | ~4,950 | 64.8–65.6% |
| 1996 | 8,000 | 251–260 | 3.1–3.3% | ~5,200 | 65.0–65.4% |
| 1997 | 8,500 | 188 | 2.2% | ~5,400 | 63.2–63.8% |
| 1998 | 8,950 | 109–113 | 1.2–1.3% | ~5,500 | 61.2–61.8% |
| 1999 | 9,500 | 127–130 | 1.3–1.4% | 5,656 | 59.3% |
| 2000 | 10,150 | 18 | 0.2% | 5,674 | 55.8% |
| 2001 | $10,550 | $ 133 | 1.3% | $ 5,792 | 54.8% |
| 2002 | 10,900 | 421 | 3.9% | 6,213 | 57.1% |
| 2003 | 11,350 | 570 | 5.0% | 6,783 | 59.9% |
| 2004 | 12,100 | 596 | 4.9% | 7,379 | 61.0% |
| 2005 | 12,900 | 539 | 4.2% | 7,918 | 61.4% |
| 2006 | 13,700 | 575 | 4.2% | 8,493 | 62.1% |
| 2007 | 14,300 | 500 | 3.5% | 8,993 | 62.8% |
| 2008 | 14,750 | 1,018 | 6.9% | 10,011 | 67.9% |
| 2009 | $14,400 | $1,887 | 13.1% | $11,898 | 82.5% |
| 2010 | 14,800 | 1,653 | 11.2% | 13,551 | 91.6% |
| 2011[127] | 15,400 | 1,230 | 8.0% | 14,781 | 96.1% |
| 2012 | 16,050 | 1,278 | 8.0% | 16,059 | 100.2% |
| 2013 | 16,500 | 673 | 4.1% | 16,732 | 101.3% |
| 2014 | 17,200 | 1,078 | 6.3% | 17,810 | 103.4% |
| 2015 | 17,900 | 328 | 1.8% | 18,138 | 101.3% |
| 2016 (Oct. '15 – Jul. '16 only) |
~1,290 | ~7.0% | ~19,428 | ~106.1% |
On July 29, 2016 the BEA released a revision to 2013–2016 GDP figures. The figures for this table were corrected the next week with changes to figures in those fiscal years.
On July 30, 2015 the BEA released a revision to 2012–2015 GDP figures. The figures for this table were corrected on that day with changes to FY 2013 and 2014, but not 2015 as FY 2015 is updated within a week with the release of debt totals for July 31, 2015.
On June 25, 2014 the BEA announced a 15-year revision of GDP figures would take place on July 31, 2014. The figures for this table were corrected after that date with changes to FY 2000, 2003, 2008, 2012, 2013 and 2014. The more precise FY 1999–2014 debt figures are derived from Treasury audit results. The variations in the 1990s and FY 2015 figures are due to double-sourced or relatively preliminary GDP figures respectively. A comprehensive revision GDP revision dated July 31, 2013 was described on the Bureau of Economic Analysis website. In November 2013 the total debt and yearly debt as a percentage of GDP columns of this table were changed to reflect those revised GDP figures.
Historical debt ceiling levels
| Table of historical debt ceiling levels[128] | |||
|---|---|---|---|
| Date | Debt Ceiling (billions of dollars) | Change in Debt Ceiling (billions of dollars) | Statute |
| June 25, 1940 | 49[129] | ||
| February 19, 1941 | 65 | +16 | |
| March 28, 1942 | 125 | +60 | |
| April 11, 1943 | 210 | +85 | |
| June 9, 1944 | 260 | +50 | |
| April 3, 1945 | 300 | +40 | |
| June 26, 1946 | 275 | −25 | |
| August 28, 1954 | 281 | +6 | |
| July 9, 1956 | 275 | −6 | |
| February 26, 1958 | 280 | +5 | |
| September 2, 1958 | 288 | +8 | |
| June 30, 1959 | 295 | +7 | |
| June 30, 1960 | 293 | −2 | |
| June 30, 1961 | 298[130] | +5 | |
| July 1, 1962 | 308 | +10 | |
| March 31, 1963 | 305 | −3 | |
| June 25, 1963 | 300 | −5 | |
| June 30, 1963 | 307 | +7 | |
| August 31, 1963 | 309 | +2 | |
| November 26, 1963 | 315 | +6 | |
| June 29, 1964 | 324 | +9 | |
| June 24, 1965 | 328 | +4 | |
| June 24, 1966 | 330 | +2 | |
| March 2, 1967 | 336 | +6 | |
| June 30, 1967 | 358 | +22 | |
| June 1, 1968 | 365 | +7 | |
| April 7, 1969 | 377 | +12 | |
| June 30, 1970 | 395 | +18 | |
| March 17, 1971 | 430 | +35 | |
| March 15, 1972 | 450[131] | +20 | |
| October 27, 1972 | 465 | +15 | |
| June 30, 1974 | 495 | +30 | |
| February 19, 1975 | 577 | +82 | |
| November 14, 1975 | 595 | +18 | |
| March 15, 1976 | 627 | +32 | |
| June 30, 1976 | 636 | +9 | |
| September 30, 1976 | 682 | +46 | |
| April 1, 1977 | 700 | +18 | |
| October 4, 1977 | 752 | +52 | |
| August 3, 1978 | 798 | +46 | |
| April 2, 1979 | 830 | +32 | |
| September 29, 1979 | 879[132] | +49 | |
| June 28, 1980 | 925 | +46 | |
| December 19, 1980 | 935 | +10 | |
| February 7, 1981 | 985 | +50 | |
| September 30, 1981 | 1,079 | +94 | |
| June 28, 1982 | 1,143 | +64 | |
| September 30, 1982 | 1,290 | +147 | |
| May 26, 1983 | 1,389 | +99 | Pub.L. 98–34 |
| November 21, 1983 | 1,490 | +101 | Pub.L. 98–161 |
| May 25, 1984 | 1,520 | +30 | |
| June 6, 1984 | 1,573 | +53 | Pub.L. 98–342 |
| October 13, 1984 | 1,823 | +250 | Pub.L. 98–475 |
| November 14, 1985 | 1,904 | +81 | |
| December 12, 1985 | 2,079 | +175 | Pub.L. 99–177 |
| August 21, 1986 | 2,111 | +32 | Pub.L. 99–384 |
| October 21, 1986 | 2,300 | +189 | |
| May 15, 1987 | 2,320[133] | +20 | |
| August 10, 1987 | 2,352 | +32 | |
| September 29, 1987 | 2,800 | +448 | Pub.L. 100–119 |
| August 7, 1989 | 2,870 | +70 | |
| November 8, 1989 | 3,123 | +253 | Pub.L. 101–140 |
| August 9, 1990 | 3,195 | +72 | |
| October 28, 1990 | 3,230 | +35 | |
| November 5, 1990 | 4,145 | +915 | Pub.L. 101–508 |
| April 6, 1993 | 4,370 | +225 | |
| August 10, 1993 | 4,900 | +530 | Pub.L. 103–66 |
| March 29, 1996 | 5,500 | +600 | Pub.L. 104–121 |
| August 5, 1997 | 5,950 | +450 | Pub.L. 105–33 |
| June 11, 2002 | 6,400[134] | +450 | Pub.L. 107–199 |
| May 27, 2003 | 7,384 | +984 | Pub.L. 108–24 |
| November 16, 2004 | 8,184[134] | +800 | Pub.L. 108–415 |
| March 20, 2006 | 8,965[135] | +781 | Pub.L. 109–182 |
| September 29, 2007 | 9,815 | +850 | Pub.L. 110–91 |
| June 5, 2008 | 10,615 | +800 | Pub.L. 110–289 |
| October 3, 2008 | 11,315[136] | +700 | Pub.L. 110–343 |
| February 17, 2009 | 12,104[137] | +789 | Pub.L. 111–5 |
| December 24, 2009 | 12,394 | +290 | Pub.L. 111–123 |
| February 12, 2010 | 14,294 | +1,900 | Pub.L. 111–139 |
| January 30, 2012 | 16,394 | +2,100 | |
| May 19, 2013 | 16,700 | +306 | |
See also
- List of National debt of the United States by year
- United States federal budget
- United States debt ceiling
- Concord Coalition
- Emergency Economic Stabilization Act of 2008
- List of countries by public debt
- Sovereign default
- Troubled Asset Relief Program
References
- ↑ "Federal debt basics – How large is the federal debt?". Government Accountability Office. Retrieved April 28, 2012.
- ↑ "Historical Tables – Table 1.2 – Summary of Receipts, Outlays, and Surpluses or Deficits (-) as Percentages of GDP: 1930–2017" (PDF). Office of Management and Budget. Retrieved April 16, 2012.
- ↑ About 0.8% of debt ($79 billion) is not covered by the ceiling, per The Debt Limit: History and Recent Increases, page 4. (NOTE: This includes pre-1917 debt), fpc.state.gov; accessed August 24, 2016.
- ↑ Congressional Budget Office-The 2014 Long-Term Budget Outlook in 26 Slides
- 1 2 "News Release: Gross Domestic Product". Bea.gov. Retrieved 2016-08-27.
- 1 2 3 GAO-Financial Audit-Bureau of the Fiscal Service's Fiscal Years 2014 and 2013 Schedules of Federal Debt, treasurydirect.gov, November 2014.
- 1 2 3 4 5 "Debt to the Penny (Daily History Search Application)".
- 1 2 BEA-Gross Domestic Product
- ↑ "MAJOR FOREIGN HOLDERS OF TREASURY SECURITIES (in billions of dollars): HOLDINGS 1/ AT END OF PERIOD" (TXT). Treasury.gov. Retrieved 2016-08-27.
- ↑ "THE 2012 ANNUAL REPORT OF THE BOARD OF TRUSTEES OF THE FEDERAL OLD-AGE AND SURVIVORS INSURANCE AND FEDERAL DISABILITY INSURANCE TRUST FUNDS" (PDF). Ssa.gov. Retrieved 2016-08-27.
- ↑ "Social Security Trust Fund 2010 Report Summary". Ssa.gov. Retrieved May 18, 2011.
- ↑ "Federal debt basics – What is the difference between the two types of federal debt?". Government Accountability Office. Retrieved April 28, 2012.
- ↑ "Measuring the Deficit: Cash vs. Accrual". Government Accountability Office. Retrieved January 19, 2011.
- ↑ Fannie Mae, Freddie Mac to Be Kept Off Budget, White House Says (September 12, 2008), Bloomberg.com.
- ↑ The case for keeping Fannie Mae and Freddie Mac off the government's books has gotten even weaker, professional.wsj.com (subscription required)
- ↑ Barr, Colin (September 7, 2008). "Paulson readies the 'bazooka'", CNN.com; retrieved January 17, 2011.
- ↑ Timiraos, Nick (March 3, 2014). "Investor Fires Salvo Against Fannie, Freddie-Viewed March 2014". WSJ. Retrieved August 24, 2016.
- 1 2 Congress of the United States, Government Accountability Office (February 13, 2009). "The federal government's financial health: a citizen's guide to the 2008 financial report of the United States government", pp. 7–8, gao.gov; retrieved February 1, 2011.
- ↑ Peter G. Peterson Foundation (April 2010). "Citizen's guide 2010: Figure 10 Page 16". Peter G. Peterson Foundation website; retrieved February 5, 2011.
- ↑ CBO – The Budget and Economic Outlook: Fiscal Years 2012 to 2022 – See Historical Budget Data Supplement, Cbo.gov, January 2012.
- ↑ "The World Factbook — Central Intelligence Agency".
- ↑ OECD. "OECD Statistics". Stats.oecd.org. Retrieved 2016-08-27.
- ↑ Multiple references:
- Debt to the Penny (Daily History Search Application)
- US national debt surpasses $16 trillion – Boston Business Journal
- United States Department of the Treasury, Bureau of the Public Debt (December 2010). "The debt to the penny and who holds it". TreasuryDirect. Retrieved August 26, 2012.
- 1 2 "CBO Budget and Economic Outlook 2009-2019". CBO. Retrieved November 21, 2016.
- ↑ Table 1.1 – Summary of Receipts, Outlays, and Surpluses or Deficits (-): 1789–2017, Whitehouse.gov; accessed August 24, 2016.
- ↑ "TreasuryDirect Historical Debt Outstanding". Treasury Direct. Retrieved November 26, 2016.
- 1 2 "Money in budgets, but supplementals aren't going away". Politifact. Retrieved November 26, 2016.
- ↑ "Treasurydirect.gov". Treasurydirect.gov. Retrieved May 18, 2011.
- ↑ Saint Louis Federal Reserve (2012) "5-Year Treasury Inflation-Indexed Security, Constant Maturity" FRED Economic Data chart from government debt auctions (the x-axis at y=0 represents the inflation rate over the life of the security)
- 1 2 Carmen M. Reinhart and M. Belen Sbrancia (March 2011) "The Liquidation of Government Debt" National Bureau of Economic Research working paper No. 16893
- ↑ David Wessel (August 8, 2012) "When Interest Rates Turn Upside Down" Wall Street Journal (full text)
- ↑ Lawrence Summers (June 3, 2012) "Breaking the negative feedback loop" Reuters
- ↑ Matthew Yglesias. "Why Are We Collecting Taxes?", Slate.com, May 30, 2012.
- ↑ William H. Gross (May 2, 2011) "The Caine Mutiny (Part 2)" PIMCO Investment Outlook
- ↑ "Why the U.S. Government Never, Ever Has to Pay Back All Its Debt", The Atlantic, February 1, 2013.
- ↑ Ambrose Evans-Pritchard (October 21, 2012) "IMF's epic plan to conjure away debt and dethrone bankers" The Telegraph
- ↑ Jaromir Benes and Michael Kumhof (August 2012) "The Chicago Plan Revisited", International Monetary Fund working paper WP/12/202; accessed November 6, 2016.
- ↑ "Debt-Deflation versus the Liquidity Trap: the Dilemma of Nonconventional Monetary Policy" CNRS, CES, Paris School of Economics, ESCP-Europe, October 23, 2012
- ↑ "Credit and debt in Economic Theory: Which Way forward?" Economics of Credit and Debt workshop, November 2012
- ↑ "The economic crisis: How to stimulate economies without increasing public debt" Archived September 16, 2012, at the Wayback Machine., Centre for Economic Policy Research, August 2012.
- ↑ Alan Fram (November 13, 1995). "Clinton Vetoes Borrowing Bill -- Government Shutdown Nears As Rhetoric Continues To Roil". The Seattle Times. Associated Press. Retrieved March 3, 2011.
- ↑ Stephanie Condon (July 27, 2011). "McCain blasts "bizarro" Tea Party debt limit demands". CBS News. Retrieved July 30, 2011.
- ↑ "Reid, Boehner Outline Competing Deficit Plans". Fox News. Associated Press. July 25, 2011. Retrieved July 29, 2011.
- ↑ "Treasury Direct-Monthly Statement of the Public Debt Held by the U.S.-September 2014" (PDF). Retrieved November 30, 2014.
- ↑ China, Japan, Belgium, the Caribbean banking centers, and Oil Exporters holding respectively approximately $1.27 trillion, $1.22 trillion, $354 billion, $312 billion, and $279 billion as of September 2014.[46]
- ↑ "U.S. Treasury-Foreign Holdings of U.S. Debt-As of September 2014". Retrieved November 30, 2014.
- ↑ Amadeo, Kimberly (January 10, 2011). "The U.S. debt and how it got so big". About.com. Retrieved July 7, 2007.
- ↑ Schoen, John W. (March 4, 2007) "Just who owns the U.S. national debt?" MSNBC.com; retrieved January 17, 2011.
- ↑ "Major Foreign Holders of Treasury Securities". U.S. Department of Treasury. Retrieved November 30, 2014.
- ↑ "Major Foreign Holders of Treasury Securities". U.S. Department of Treasury. Retrieved July 19, 2011.
- ↑ Whitehouse, Steve (June 30, 2008). "BIS says global downturn could be 'deeper and more protracted' than expected". Forbes. Archived from the original on June 1, 2010. Retrieved January 22, 2011-Thomson Financial News
- ↑ Fattah, Zainab & Brown, Matthew (June 4, 2007). "Syria to end dollar peg, 2nd Arab country in 2 weeks (update 3)". Bloomberg. Retrieved November 4, 2007.
- ↑ "IMF takes up gold sales to expand lending" (September 18, 2009) NewsLibrary.com. Retrieved January 22, 2011 (archived; $1.50 charge to view article).
- ↑ Krugman, Paul (2012-01-01). "Nobody Understands Debt". New York Times. Retrieved 2012-02-04.
- ↑ CBO Budget and Economic Outlook 2014 to 2024, cbo.gov, February 2014.
- 1 2 3 4 CBO The 2014 Long-Term Budget Outlook, cbo.gov; accessed August 24, 2016.
- ↑ CBO Testimony-Confronting the Nation's Fiscal Policy Challenges, cbo.gov, September 2011.
- 1 2 Huntley, Jonathan (July 27, 2010). "Federal debt and the risk of a fiscal crisis". Congressional Budget Office: Macroeconomic Analysis Division; retrieved February 2, 2011.
- ↑ "Is China's Ownership Of U.S. Debt A National Security Threat?" by Kenneth Rapoza, Forbes, 23 January 2013
- ↑ "... Should Americans be concerned that China has started dumping some of its Treasury holdings? After all, it raises serious questions about whether China will keep lending Washington money to help finance the federal deficit in the future.": From "China is dumping U.S. debt", CNN.com, September 11, 2015.
- 1 2 3 Report on "China's Holdings of U.S. Securities: Implications for the U.S. Economy" by Wayne M. Morrison & Marc Labonte, Congressional Research Service, 19 August 2013
- ↑
- "...What about indebtedness to foreigners?...To acquire [U.S. gov't bonds], China must export goods to us, not offset by equivalent imports. That is a cost to China. It's a cost Beijing is prepared to pay, for its own reasons: export industries promote learning, technology transfer and product quality improvement, and they provide jobs to migrants from the countryside. But that's China's business. For China, the bonds themselves are a sterile hoard. There is almost nothing that Beijing can do with them;...its stock of T-bonds will just go on growing. And we will pay interest on it, not with real effort but by typing numbers into computers. There is no burden associated with this; not now and not later." From "In Defense of Deficits" by James K. Galbraith, The Nation, March 4, 2010.
- ↑ "...The Chinese buy U.S. T-securities by transferring U.S. dollars (not yuan) from their checking account at the Federal Reserve Bank to China's T-security account, also at the Federal Reserve Bank. When[ever] the Chinese redeem those T-securities, the money is transferred back to China's checking account at the Fed. During the entire purchase and redemption process, the dollars never leave the Fed."
"What Policies for Global Prosperity?" by Warren Mosler, September 23, 2010. - ↑ Mitchell, Bill, University of Newcastle (Australia). "The nearly infinite capacity of the US government to spend" (March 28, 2012); "The US government can buy as much of its own debt as it chooses" (August 27, 2013)
- ↑ "...The US, as a sovereign currency issuer, faces no financial constraint. It cannot be forced into default. It controls its policy interest rate. The rest of the world are users of the dollar; not issuers. They can never hold [the United States] hostage."
"What If China Dumps US Treasury Bonds?" by L. Randall Wray, University of Missouri-Kansas City, November 12, 2013. - ↑ U.S. House of Representatives Republican Caucus (May 27, 2010). "The perils of rising government debt", budget.house.gov; retrieved February 2, 2011.
- ↑ Herndon, Thomas. "Herndon Responds To Reinhart Rogoff". Business Insider. Retrieved April 22, 2013.
- ↑ Weisenthal, Joe. "Reinhart And Rogoff Admit Excel Blunder". Business Insider. Retrieved April 22, 2013.
- ↑ Herndon, Thomas, Michael Ash, and Robert Pollin, "Does High Public Debt Consistently Stifle Economic Growth? A Critique of Reinhart and Rogoff", University of Massachusetts – Amherst Department of Economics, April 15, 2013.
- ↑ "Reinhart-Rogoff recrunch the numbers".
- 1 2 Krugman, Paul (May 27, 2010). "Bad analysis at the deficit commission". The New York Times: The Opinion Pages: Conscience of a Liberal Blog. Retrieved February 9, 2011.
- ↑ Vikas Bajaj (April 17, 2013) "Does High Debt Cause Slow Growth?", The New York Times; retrieved May 7, 2013.
- ↑ Matthew O'Brien, "Forget Excel: This Was Reinhart and Rogoff's Biggest Mistake", The Atlantic; accessed November 6, 2016.
- ↑ Bernanke, Ben S. (April 27, 2010). "Speech before the National Commission on Fiscal Responsibility and Reform: Achieving fiscal sustainability", Federalreserve.gov; retrieved February 2, 2011.
- ↑ GAO-Financial Audit-Bureau of the Public Debt's Fiscal Years 2012 and 2011 Schedules of Federal Debt-November 2012
- ↑ Ferguson, Niall (November 3, 2009). "Interview with Charlie Rose". Charlie Rose [website]; retrieved February 6, 2011.
- ↑ CBO-Updated Budget Projections 2016–2026, cbo.gov; retrieved May 11, 2016.
- ↑ CBO-Projection of Federal Interest Payments, cbo.gov, September 3, 2014.
- 1 2 Horney, James R. (May 27, 2010). "Recommendation that president's fiscal commission focus on gross debt is misguided", Center on Budget and Policy Priorities [website]; retrieved February 9, 2011.
- ↑ United States Treasury, Bureau of the Public Debt (April 30, 2010). "Monthly statement of public debt of the United States", TreasuryDirect; retrieved February 9, 2011.
- ↑ "CBO-Social Security Policy Options-July 2010" (PDF). Retrieved May 18, 2011.
- ↑ Gordon, John Steele. "A Short Primer on the National Debt". Wsj.com. Retrieved 2016-08-27.
- 1 2 "Debt Is (Mostly) Money We Owe to Ourselves". Krugman.blogs.nytimes.com. Retrieved 2016-08-27.
- ↑ "Who Rules America: Wealth, Income, and Power". Ucsc.edu. Retrieved 2016-08-27.
- ↑ Baker, Dean. "David Brooks Is Projecting His Self Indulgence Again". cepr.net. Retrieved September 23, 2016.
- ↑ "Cheating Our Children". The New York Times. March 29, 2013.
- ↑ Carney, John. "Has the United States Ever Defaulted on Its Debt?". CNBC. Retrieved January 18, 2013.
- ↑ Comstock, Courtney. "10 Things You Need To Know About The Debt Ceiling". The Fiscal Times. Retrieved January 18, 2013.
- ↑ Zweig, Jason. "Own Government Bonds? Here's Why You Should Be Worried". The Wall Street Journal. Retrieved January 18, 2013.
- ↑ Marron, Donald. "The Day the United States Defaulted on Treasury Bills". Retrieved January 18, 2013.
- ↑ O'brien, Matthew. "Here's What Happened the Last Time the U.S. Defaulted on Its Debt". The Atlantic. Retrieved January 18, 2013.
- ↑ Siegel, Robert. "When Did The U.S. Last Default On Treasury Bonds?". NPR. Retrieved January 18, 2013.
- 1 2 United States Department of the Treasury, Bureau of the Public Debt (2010). "Government – Historical Debt Outstanding – Annual", TreasuryDirect.gov; retrieved January 16, 2011.
- 1 2 The Executive Office of the President of the United States, Office of Management and Budget (April 10, 2013). "Federal debt at the end of year: 1940–2018"; "Gross domestic product and deflators used in the historical tables: 1940–2018", Budget of the United States Government: Fiscal Year 2014: Historical Tables, pp. 143–44, 215–16, Government Printing Office website; retrieved November 27, 2013.
- ↑ The Executive Office of the President of the United States, Office of Management and Budget (February 14, 2010). "Historical Tables: Table 7-1; 10-1", The White House; retrieved February 15, 2010.
- 1 2 United States Department of Commerce, Bureau of Economic Analysis. "National Economic Accounts: Gross Domestic Product: Current-dollar and 'real' GDP", BEA.gov; retrieved August 3, 2011.
- ↑ Frank H. Vizetelly; Litt.D., LL.D., eds. (1999). "DEBT, National". New Standard Encyclopedia of Universal Knowledge. Eight. "New York and London": Funk and Wagnalls Company. p. 471.
Debt of Principal Nations and Aggregate for All Nations of the World at Various Dates (in millions of dollars): '1928........18,510'
- ↑ MeasuringWorth.com (December 14, 2010) "What was the U.S. GDP then?", MeasuringWorth.com; retrieved January 30, 2011.
- ↑ United States Congress, Government Accountability Office (March 1, 2001). Financial Audit: Bureau of the Public Debt's Fiscal Years 2000 and 1999 Schedules of Federal Debt GAO-01-389 United States Government Accountability Office (GAO); retrieved August 6, 2012.
- 1 2 United States Congress, Government Accountability Office (November 1, 2002). Financial Audit: Bureau of the Public Debt's Fiscal Years 2002 and 2001 Schedules of Federal Debt GAO-03-199 United States Government Accountability Office (GAO); retrieved February 2, 2011.
- ↑ United States Congress, Government Accountability Office (November 5, 2004). Financial Audit: Bureau of the Public Debt's Fiscal Years 2004 and 2003 Schedules of Federal Debt GAO-05-116 United States Government Accountability Office (GAO); retrieved January 16, 2011.
- 1 2 United States Congress, Government Accountability Office (November 7, 2006). Financial Audit: Bureau of the Public Debt's Fiscal Years 2006 and 2005 Schedules of Federal Debt GAO-07-127 United States Government Accountability Office (GAO); retrieved February 2, 2011.
- 1 2 3 United States Congress, Government Accountability Office (November 7, 2008). Financial Audit: Bureau of the Public Debt's Fiscal Years 2008 and 2007 Schedules of Federal Debt GAO-09-44 United States Government Accountability Office (GAO); retrieved January 29, 2011.
- ↑ United States Congress, Government Accountability Office (November 10, 2009). Financial Audit: Bureau of the Public Debt's Fiscal Years 2009 and 2008 Schedules of Federal Debt GAO-10-88 United States Government Accountability Office (GAO); retrieved February 2, 2011.
- ↑ United States Congress, Government Accountability Office (November 8, 2010). Financial Audit: Bureau of the Public Debt's Fiscal Years 2010 and 2009 Schedules of Federal Debt GAO-11-52 United States Government Accountability Office (GAO); retrieved February 2, 2011.
- 1 2 United States Congress, Government Accountability Office (November 8, 2012). Financial Audit: Bureau of the Public Debt's Fiscal Years 2012 and 2011 Schedules of Federal Debt GAO-13-114 United States Government Accountability Office (GAO); retrieved November 27, 2013.
- ↑ United States Congress, Government Accountability Office (December 12, 2013). Financial Audit: Bureau of the Fiscal Service's Fiscal Years 2013 and 2012 Schedules of Federal Debt GAO-14-173, United States Government Accountability Office (GAO); retrieved July 2, 2014.
- ↑ GAO-Financial Audit-Bureau of the Fiscal Service's Fiscal Years 2015 and 2014 Schedules of Federal Debt, treasurydirect.gov, November 2015.
- ↑ "Government – Historical Debt Outstanding – Annual 2000–2015".
- ↑ "Government – November". treasurydirect.gov.
- ↑ "Major Foreign Holders of Treasury Securities", Department of the Treasury/Federal Reserve Board, November 16, 2016
- ↑ "The World Factbook — Central Intelligence Agency". cia.gov.
- ↑ The World Factbook – Field Listing: GDP (purchasing power parity) for China figures only
- ↑ U.S. Department of the Treasury, Bureau of the Fiscal Service (July 13, 2014). "Status report of U.S. Treasury-owned gold".
- ↑ International Money Fund (September 5, 2014). "International Reserves and Foreign Currency Liquidity: Official reserve assets and other foreign currency assets. International Monetary Fund [website]; retrieved September 17, 2014
- ↑ U.S. Department of the Treasury, Bureau of the Fiscal Service (March 14, 2016). "United States Debt Clock".
- ↑ Board of Governors of the Federal Reserve System (March 9, 2006). "Z.1-Flow of Funds Accounts of the United States", pp. 8, 102. Board of Governors of the Federal Reserve System [website]; retrieved January 29, 2011.
- ↑ Board of Governors of the Federal Reserve System (June 5, 2009). "G.19-Consumer Credit". Board of Governors of the Federal Reserve System [website]; retrieved January 30, 2011.
- ↑ United States Department of Commerce, United States Census Bureau (February 19, 2006). Archived copy at the Portuguese Web Archive (July 10, 2009).. U.S. Census Bureau [website]; retrieved January 30, 2011.
- ↑ Preliminary Annual Report on U.S. Holdings of Foreign Securities, treasury.gov, August 29, 2014.
- 1 2 Stephen I. Schwartz; Bruce G. Blair, The Brookings Institution; Thomas S. Blanton and William Burr, the National Security Archive; Steven M. Kosiak, Center for Strategic and Budgetary Assessments; Arjun Makhijani, Institute for Energy and Environmental Research; Robert S. Norris, Natural Resources Defense Council; Kevin O'Neill, Institute for Science and International Security; John E. Pike, Federation of American Scientists; William J. Weida, Global Resource Action Center for the Environment (1998). Atomic audit: the costs and consequences of U.S. nuclear weapons since 1940. Brookings Institution Press. pp. 3, 12, 105, 107, 461, 546, 551. ISBN 978-0-8157-7774-8.
- ↑ "The peak U.S. inventory was around 35,000 nuclear weapons. The United States spent more than $5.5 trillion on the nuclear arms race, an amount equal to its national debt in 1998..." Graham, Jr., Thomas (2002). Disarmament sketches: three decades of arms control and international law. USA: University of Washington Press. p. 35. ISBN 978-0-295-98212-0.
- ↑ "...the total figure will likely be equal to the $5 trillion national debt. In short, one quarter to one third of all military spending since World War II has been devoted to nuclear weapons and their infrastructure..." page 33, Steven I. Schwartz; Nuclear Weapons Cost Study Committee (November 1995). "Four Trillion Dollars and Counting". Bulletin of Atomic Scientists. Educational Foundation for Nuclear Science, Inc. 51 (6): 32–53. ISSN 0096-3402. Retrieved August 24, 2016.
- ↑ Historical Budget Tables, whitehouse.gov; accessed August 24, 2016.
- ↑ Eurostat – Tables, Graphs and Maps Interface (TGM) table Retrieved November 6, 2014
- ↑ Cecchetti, Stephen G. et al. (March 2010). "The future of public debt: prospects and implications", p. 3. Bank for International Settlements [website]; retrieved July 4, 2011.
- ↑ "The United States enters the twilight zone – MuniLand". Reuters. May 3, 2012.
- ↑ "Table 7.1 – Federal Debt at the End of Year: 1940–2016". Historical Tables. Office of Management and Budget. Retrieved May 16, 2011.
- ↑ "The-privateer.com, 1940–1960". The-privateer.com. Retrieved May 18, 2011.
- ↑ "The-privateer.com, 1961–1971". The-privateer.com. Retrieved May 18, 2011.
- ↑ "The-privateer.com, 1971–1979". The-privateer.com. Retrieved May 18, 2011.
- ↑ "The-privateer.com, 1979–1986". The-privateer.com. Retrieved May 18, 2011.
- ↑ "The-privateer.com, 1987–1997". The-privateer.com. Retrieved May 18, 2011.
- 1 2 "The Debt Limit: History and Recent Increases" (PDF). Retrieved May 18, 2011.
- ↑ "Republicans Raise US Debt Ceiling to $9 Trillion, Caused by Iraq War and Tax Breaks for the Rich". Usliberals.about.com. Retrieved 2011-08-07.
- ↑ "FINANCIAL AUDIT- Bureau of the Public Debt's Fiscal Years 2008 and 2007 Schedules of Federal Debt" (PDF). Retrieved 2011-08-07.
- ↑ "Understanding the Federal Debt Limit". The Concord Coalition. Retrieved 2011-08-07.
Further reading
- Bonner, William; Wiggin, Addison (2006). Empire of Debt: the Rise of an Epic Financial Crisis. Wiley. ISBN 0-471-78253-X.
- Johnson, Simon; Kwak, James (2012). White House Burning: The Founding Fathers, Our National Debt, and Why It Matters To You. Pantheon. ISBN 978-0-307-90696-0.
- Eisner, Robert (1993). "Federal Debt". In David R. Henderson. Concise Encyclopedia of Economics (1st ed.). Library of Economics and Liberty. OCLC 317650570, 50016270, 163149563
- Macdonald, James (2006). A Free Nation Deep in Debt: The Financial Roots of Democracy. Princeton University Press. ISBN 0-691-12632-1.
- Wright, Robert (2008). One Nation Under Debt: Hamilton, Jefferson, and the History of What We Owe. Mc-Graw Hill. ISBN 0-07-154393-7.
External links
| Wikimedia Commons has media related to United States government debt. |
- Documentary about the debt, "Ten Trillion and Counting", by PBS Frontline
- "Bureau of the Public Debt". publicdebt.ustreas.gov.
- The Debt to the Penny and Who Holds It public and intragovernmental
- Federal Debt: Answers to Frequently Asked Questions- Provides a broad range of information about federal debt including its relationship to the budget, ownership of the debt, debt management, and key policy considerations
- Foreign Holdings of Federal Debt Congressional Research Service
- The United States Public Debt, 1861 to 1975 Encyclopedia Article
- GAO Citizen's Guide – 2008
- National Commission on Fiscal Responsibility and Reform
- Historical Tables, Office of Management and Budget
- Historical documents on public debt, FRASER
- New York Times-Charting the American Debt Crisis-July 2011
- U.S. Treasury Resource Center – Treasury International Capital (TIC) System
- National Debt of USA in Realtime