Demography of Slough
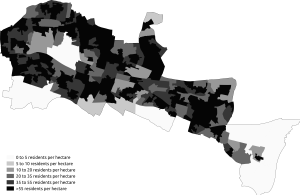
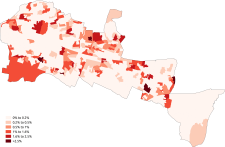
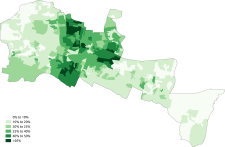
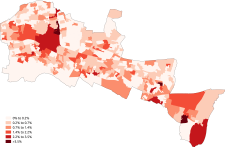
Population density in the 2011 census in Slough.
Population
The modern town of Slough grew from the parish of Upton-cum-Chalvey, Buckinghamshire, England. The populations given below are for the successive institutional areas of the principal local government level that could be recognised as Slough, now in Berkshire.
| Year |
Population |
Notes |
|---|
| 1801 | 1,018[1] | Parish of Upton-cum-Chalvey |
| 1811 | 1,083[1] | |
| 1821 | 1,268[1] | |
| 1831 | 1,502[1] | |
| 1841 | 2,296[1] | |
| 1851 | 3,573[1] | |
| 1861 | 4,688[1] | |
| 1871 | 5,940[1] | |
| 1881 | 7,030[1] | |
| 1891 | 7,700[1] | |
| 1901 | 11,453[1] | Slough Urban District from 1894; area enlarged in 1900[2] |
| 1911 | 14,982[1] | |
| 1921 | 16,392[1] | |
| 1931 | 33,612[1] | area enlarged in 1930/1931[2] |
| 1939 | 50,620[1] | estimate (1941 census not taken due to World War II):Municipal Borough from 1938 |
| 1951 | 66,471[1] | |
| 1961 | 80,781[1] | |
| 1971 | 87,075[1] | |
| 1981 | 96,512[3] | Borough of Slough in Berkshire and area enlarged from 1974 |
| 1991 | 101,066[3] | |
| 2001 | 119,070[4] | Area enlarged in 1995: Unitary Authority from 1998 |
| 2011 | 140,200[5] | Up 16.3% on the 2001 Census, and 6.9% higher than the previous mid-2010 population estimate |
|
Ethnicity
The following table shows the ethnic group of respondents in the 2001 and 2011 censuses in Slough.
| Ethnic Group |
2001[6] |
2011[7] |
| Number |
% |
Number |
% |
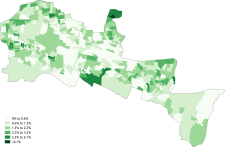
| White: British | 69,441 | 58.32% | 48,401 | 34.52% |
| White: Irish | 2,489 | 2.09% | 1,607 | 1.15% |
| White: Gypsy or Irish Traveller[note 1] | | | 220 | 0.16% |
| White: Other | 3,913 | 3.29% | 13,825 | 9.86% |
| White: Total | 75,843 | 63.70% | 64,053 | 45.69% |
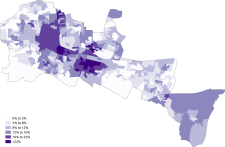
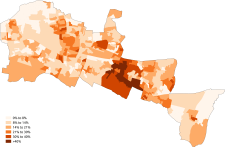
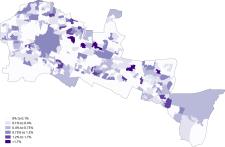
| Asian or Asian British: Indian | 16,719 | 14.04% | 21,922 | 15.64% |
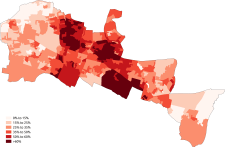
| Asian or Asian British: Pakistani | 14,360 | 12.06% | 24,869 | 17.74% |
| Asian or Asian British: Bangladeshi | 171 | 0.14% | 549 | 0.39% |
| Asian or Asian British: Chinese[note 2] | 349 | 0.29% | 797 | 0.57% |
| Asian or Asian British: Other Asian | 2,022 | 1.70% | 7,560 | 5.39% |
| Asian or Asian British: Total | 33,621 | 28.24% | 55,697 | 39.73% |
| Black or Black British: Caribbean | 3,470 | 2.91% | 3,096 | 2.21% |
| Black or Black British: African | 2,275 | 1.91% | 7,548 | 5.38% |
| Black or Black British: Other Black | 281 | 0.24% | 1,471 | 1.05% |
| Black or Black British: Total | 6,026 | 5.06% | 12,115 | 8.64% |
| Mixed: White and Black Caribbean | 1,116 | 0.94% | 1,667 | 1.19% |
| Mixed: White and Black African | 224 | 0.19% | 607 | 0.43% |
| Mixed: White and Asian | 845 | 0.71% | 1,429 | 1.02% |
| Mixed: Other Mixed | 593 | 0.50% | 1,055 | 0.75% |
| Mixed: Total | 2,778 | 2.33% | 4,758 | 3.39% |
| Other: Arab[note 3] | | | 928 | 0.66% |
| Other: Any other ethnic group | 799 | 0.67% | 2,654 | 1.89% |
| Other: Total | 799 | 0.67% | 3,582 | 2.55% |
| Total | 119,067 | 100.00% | 140,205 | 100.00% |
Notes for table above
- ↑ New category created for the 2011 census
- ↑ In 2001, listed under the 'Chinese or other ethnic group' heading.
- ↑ New category created for the 2011 census
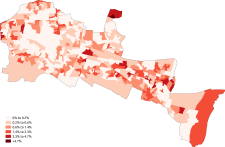
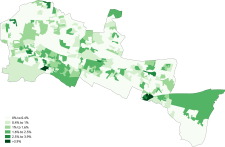
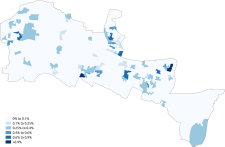
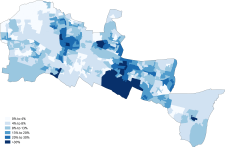
| Distribution of ethnic groups in Slough according to the 2011 census. |
|---|
|
Languages
The most common main languages spoken in Slough according to the 2011 census are shown below.[8]
Religion
The following table shows the religion of respondents in the 2001 and 2011 censuses in Slough.
| Religion |
2001[9] |
2011[10] |
| Number |
% |
Number |
% |
| Christian | 63,993 | 53.75% | 57,726 | 41.17% |
| Buddhist | 294 | 0.25% | 743 | 0.53% |
| Hindu | 5,340 | 4.48% | 8,643 | 6.16% |
| Jewish | 139 | 0.12% | 87 | 0.06% |
| Muslim | 15,897 | 13.35% | 32,655 | 23.29% |
| Sikh | 10,820 | 9.09% | 14,889 | 10.62% |
| Other religion | 358 | 0.30% | 482 | 0.34% |
| No religion | 13,061 | 10.97% | 17,024 | 12.14% |
| Religion not stated | 9,165 | 7.70% | 7,956 | 5.67% |
| Total | 119,067 | 100.00% | 140,205 | 100.00% |
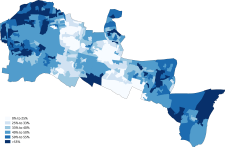
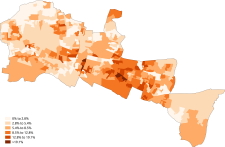
| Distribution of religions in Slough according to the 2011 census. |
|---|
|
See also
References
|
|---|
|
Berkshire Portal |
|
| Unitary authorities | |
|---|
|
| Major settlements | |
|---|
|
| Topics | |
|---|