Port Orford, Oregon
| Port Orford, Oregon | |
|---|---|
| City | |
|
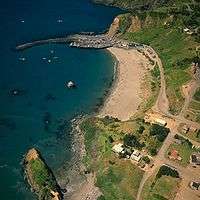
1990 Aerial view of Port Orford | |
| Motto: "Natural. Wonders." | |
 Location in Oregon | |
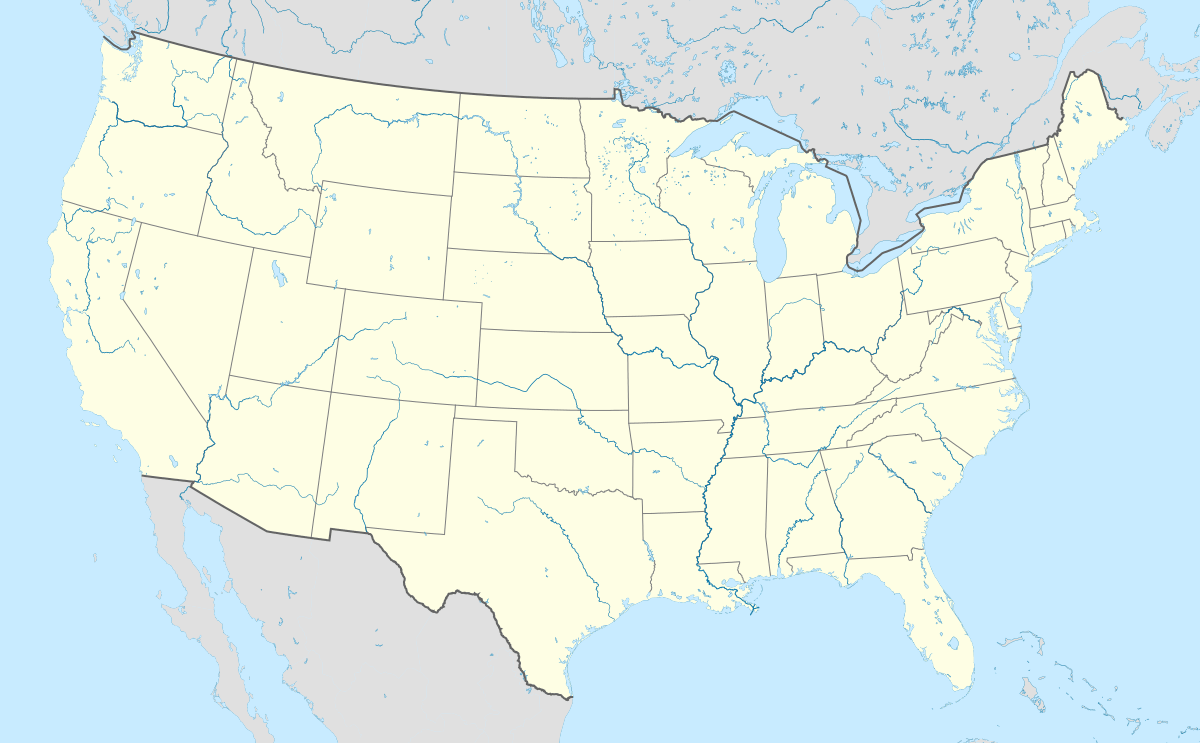
 Port Orford, Oregon Location in the United States | |
| Coordinates: 42°44′59″N 124°29′53″W / 42.74972°N 124.49806°WCoordinates: 42°44′59″N 124°29′53″W / 42.74972°N 124.49806°W | |
| Country | United States |
| State | Oregon |
| County | Curry |
| Incorporated | 1911 |
| Government | |
| • Mayor | James Auborn |
| Area[1] | |
| • Total | 1.61 sq mi (4.17 km2) |
| • Land | 1.56 sq mi (4.04 km2) |
| • Water | 0.05 sq mi (0.13 km2) |
| Elevation | 59 ft (18 m) |
| Population (2010)[2] | |
| • Total | 1,133 |
| • Estimate (2012[3]) | 1,128 |
| • Density | 726.3/sq mi (280.4/km2) |
| Time zone | Pacific (UTC-8) |
| • Summer (DST) | Pacific (UTC-7) |
| ZIP code | 97465 |
| Area code(s) | 541 |
| FIPS code | 41-59250[2] |
| GNIS feature ID | 1147902[4] |
| Website | www.portorford.org |
Port Orford (Tolowa: tr’ee-ghi~’- ’an’ [5]) is a city in Curry County on the southern coast of Oregon, United States. The population was 1,133 at the 2010 census.
The city takes its name from George Vancouver's original name for nearby Cape Blanco, which he named for George, Earl of Orford, "a much-respected friend."
Port Orford is the westernmost settlement in the state of Oregon.[6]
History

Before the arrival of European settlers, the Port Orford area was inhabited by Tututni peoples. The Tututni languages were a part of the Pacific Coast Athabaskan language family.[7]

In October 1941, then-mayor Gilbert Gable, frustrated with the poor condition of the state roads around Port Orford, which hampered economic development, suggested that a number of counties along the Oregon and California state border should secede and create the State of Jefferson. This movement came to an end with U.S. involvement in World War II.[8]
Geography
Port Orford is located on U.S. Route 101 between the Pacific Ocean and the Siskiyou National Forest, 28 miles (45 km) north of Gold Beach and 27 miles (43 km) south of Bandon. At 124 degrees, 29 minutes, 53 seconds west longitude, it is the westernmost city in the contiguous United States, though in Clallam County, Washington, there are three unincorporated communities that are farther west than Port Orford: Neah Bay, La Push, and Ozette. According to the United States Census Bureau, the city has a total area of 1.61 square miles (4.17 km2), of which 1.56 square miles (4.04 km2) is land and 0.05 square miles (0.13 km2) is water.[1]
Climate
Port Orford has an oceanic climate (Csb according to the Köppen climate classification system) with cool, very wet winters and mild, dry summers.[9] The average annual precipitation is 72.61 in (1,844 mm).[10] It is at the northern end of Oregon's "banana belt", a region with relatively warm weather caused by the Brookings effect. Its hardiness zone is 9b.[11]
| Port Orford (1981-2010 Normals) | ||||||||||||||||||||||||||||||||||||||||||||||||||||||||||||
|---|---|---|---|---|---|---|---|---|---|---|---|---|---|---|---|---|---|---|---|---|---|---|---|---|---|---|---|---|---|---|---|---|---|---|---|---|---|---|---|---|---|---|---|---|---|---|---|---|---|---|---|---|---|---|---|---|---|---|---|---|
| Climate chart (explanation) | ||||||||||||||||||||||||||||||||||||||||||||||||||||||||||||
| ||||||||||||||||||||||||||||||||||||||||||||||||||||||||||||
| ||||||||||||||||||||||||||||||||||||||||||||||||||||||||||||
| Climate data for Port Orford, Oregon | |||||||||||||
|---|---|---|---|---|---|---|---|---|---|---|---|---|---|
| Month | Jan | Feb | Mar | Apr | May | Jun | Jul | Aug | Sep | Oct | Nov | Dec | Year |
| Record high °F (°C) | 76 (24) |
78 (26) |
78 (26) |
84 (29) |
91 (33) |
88 (31) |
97 (36) |
96 (36) |
93 (34) |
89 (32) |
76 (24) |
80 (27) |
97 (36) |
| Average high °F (°C) | 54 (12) |
54 (12) |
55 (13) |
57 (14) |
60 (16) |
63 (17) |
66 (19) |
68 (20) |
66 (19) |
62 (17) |
56 (13) |
53 (12) |
60 (16) |
| Average low °F (°C) | 41 (5) |
41 (5) |
42 (6) |
43 (6) |
47 (8) |
50 (10) |
53 (12) |
53 (12) |
51 (11) |
47 (8) |
43 (6) |
40 (4) |
46 (8) |
| Record low °F (°C) | 21 (−6) |
19 (−7) |
27 (−3) |
28 (−2) |
31 (−1) |
28 (−2) |
39 (4) |
35 (2) |
36 (2) |
28 (−2) |
24 (−4) |
13 (−11) |
13 (−11) |
| Average precipitation inches (mm) | 11.64 (295.7) |
8.89 (225.8) |
9.25 (235) |
6.11 (155.2) |
3.75 (95.3) |
2.22 (56.4) |
0.54 (13.7) |
0.75 (19) |
1.60 (40.6) |
4.94 (125.5) |
10.60 (269.2) |
12.63 (320.8) |
72.92 (1,852.2) |
| Average snowfall inches (cm) | 0.20 (0.51) |
0.20 (0.51) |
0.10 (0.25) |
0 (0) |
0 (0) |
0 (0) |
0 (0) |
0 (0) |
0 (0) |
0 (0) |
0.10 (0.25) |
0.30 (0.76) |
0.90 (2.29) |
| Source: [12] | |||||||||||||
Demographics
| Historical population | |||
|---|---|---|---|
| Census | Pop. | %± | |
| 1860 | 146 | — | |
| 1870 | 100 | −31.5% | |
| 1890 | 108 | — | |
| 1900 | 227 | 110.2% | |
| 1910 | 227 | 0.0% | |
| 1920 | 217 | −4.4% | |
| 1930 | 300 | 38.2% | |
| 1940 | 755 | 151.7% | |
| 1950 | 674 | −10.7% | |
| 1960 | 1,171 | 73.7% | |
| 1970 | 1,037 | −11.4% | |
| 1980 | 1,061 | 2.3% | |
| 1990 | 1,025 | −3.4% | |
| 2000 | 1,153 | 12.5% | |
| 2010 | 1,133 | −1.7% | |
| Est. 2015 | 1,146 | [13] | 1.1% |
| source:[2][14] | |||
2010 census
As of the census of 2010, there were 1,133 people, 603 households, and 285 families residing in the city. The population density was 726.3 inhabitants per square mile (280.4/km2). There were 767 housing units at an average density of 491.7 per square mile (189.8/km2). The racial makeup of the city was 93.3% White, 0.6% African American, 1.4% Native American, 0.5% Asian, 0.9% from other races, and 3.3% from two or more races. Hispanic or Latino of any race were 4.3% of the population.[2]
There were 603 households of which 11.8% had children under the age of 18 living with them, 35.3% were married couples living together, 8.8% had a female householder with no husband present, 3.2% had a male householder with no wife present, and 52.7% were non-families. 43.4% of all households were made up of individuals and 15.6% had someone living alone who was 65 years of age or older. The average household size was 1.86 and the average family size was 2.47.[2]
The median age in the city was 54.7 years. 11.8% of residents were under the age of 18; 6.6% were between the ages of 18 and 24; 16.3% were from 25 to 44; 36.7% were from 45 to 64; and 28.8% were 65 years of age or older. The gender makeup of the city was 48.0% male and 52.0% female.[2]
2000 census
As of the census of 2000, there were 1,153 people, 571 households, and 311 families residing in the city. The population density was 719.1 people per square mile (278.2/km²). There were 662 housing units at an average density of 412.9 per square mile (159.7/km²). The racial makeup of the city was 95.40% White, 0.09% African American, 1.39% Native American, 0.26% Asian, 0.17% Pacific Islander, 0.87% from other races, and 1.82% from two or more races. Hispanic or Latino of any race were 2.60% of the population.[2]
There were 571 households out of which 19.6% had children under the age of 18 living with them, 44.0% were married couples living together, 9% had a female householder with no husband present, and 45% were non-families. 39% of all households were made up of individuals and 18.2% had someone living alone who was 65 years of age or older. The average household size was 2 people and the average family size was 2.66.[2]
In the city the population was spread out with 18.8% under the age of 18, 3.4% from 18 to 24, 19.7% from 25 to 44, 30.8% from 45 to 64, and 27.3% who were 65 years of age or older. The median age was 50 years. For every 100 females there were 92.2 males.[2]
The median income for a household in the city was $23,289, and the median income for a family was $29,653. Males had a median income of $35,221 versus $15,179 for females. The per capita income for the city was $16,442. About 16.1% of families and 17.8% of the population were below the poverty line, including 21.9% of those under age 18 and 9.2% of those age 65 or over.[2]
Education
The city is served by the Port Orford-Langlois School District, which includes Pacific High School.[15]
Media
- KDPO-FM 91.9 Radio, repeater station to KDOV-FM of Medford, Oregon
Notable people
- Richard T. Drinnon (1925–2012), historian
- Eli Clare, Writer, speaker, activist, educator
See also
References
- 1 2 "US Gazetteer files 2010". United States Census Bureau. Retrieved 2012-12-21.
- 1 2 3 4 5 6 7 8 9 10 "American FactFinder". U.S. Census Bureau. Retrieved 2013-06-19.
- ↑ "Population Estimates". United States Census Bureau. Retrieved 2013-06-02.
- ↑ "US Board on Geographic Names". United States Geological Survey. 2007-10-25. Retrieved 2008-01-31.
- ↑ "Siletz Talking Dictionary". Retrieved 2012-06-04.
- ↑ "Welcome to Port Orford". City of Port Orford. Retrieved 2015-05-27.
- ↑ "Tututni Language and the Coquille Indian Tribe". Native Languages of the Americas. Retrieved 2009-03-06.
- ↑ "Jefferson County: The State that Almost Seceded". AAA. Retrieved 2009-03-06.
- ↑ Climate Summary for Port Orford, Oregon
- 1 2 Western Regional Climate Center: NCDC 1981-2010 Monthly Normals for Port Orford
- ↑ ZipDataMaps: Port Orford, Oregon
- ↑ "Monthly Averages for Port Orford, OR". Retrieved 2015-12-17.
- ↑ "Annual Estimates of the Resident Population for Incorporated Places: April 1, 2010 to July 1, 2015". Retrieved July 2, 2016.
- ↑ Moffatt, Riley Moore (1996). Population History of Western U.S. Cities and Towns, 1850–1990. Lanham, Maryland: Scarecrow Press. p. 214. ISBN 978-0-8108-3033-2.
- ↑ "Port Orford/Langlois Schools". Port Orford-Langlois School District. Retrieved 2011-11-03.

