2000 United States Census
| Twenty-second Census of the United States | |
|---|---|
|
U.S. Census Bureau Seal | |
|
Census Logo | |
| General information | |
| Country | United States |
| Date taken | April 1, 2000 |
| Total population | 281,421,906 |
| Percent change |
|
| Most populous state |
California 33,871,648 |
| Least populous state |
Wyoming 493,782 |

The Twenty-second United States Census, known as Census 2000 and conducted by the Census Bureau, determined the resident population of the United States on April 1, 2000, to be 281,421,906, an increase of 13.2% over the 248,709,873 people enumerated during the 1990 Census.[1] This was the twenty-second federal census and was at the time the largest civilly administered peacetime effort in the United States.[2]
Approximately 16 percent of households received a "long form" of the 2000 census, which contained over 100 questions. Full documentation on the 2000 census, including census forms and a procedural history, is available from the Integrated Public Use Microdata Series.
Data availability
Microdata from the 2000 census is freely available through the Integrated Public Use Microdata Series. Aggregate data for small areas, together with electronic boundary files, can be downloaded from the National Historical Geographic Information System. Personally identifiable information will be available in 2072.[3]
State rankings
| |
|
1990 Census[4] |
2000 Census[4] |
|
change |
|---|---|---|---|---|---|
| 1 | |
29,760,021 | 33,871,648 | |
|
| 2 | |
16,986,510 | 20,851,820 | |
|
| 3 | |
17,990,455 | 18,976,457 | |
|
| 4 | |
12,937,926 | 15,982,378 | |
|
| 5 | |
11,430,602 | 12,419,293 | |
|
| 6 | |
11,881,643 | 12,281,054 | |
|
| 7 | |
10,847,115 | 11,353,140 | |
|
| 8 | |
9,295,297 | 9,938,444 | |
|
| 9 | |
7,730,188 | 8,414,350 | |
|
| 10 | |
6,478,216 | 8,186,453 | |
|
| 11 | |
6,628,637 | 8,049,313 | |
|
| 12 | |
6,187,358 | 7,078,515 | |
|
| 13 | |
6,016,425 | 6,349,097 | |
|
| 14 | |
5,544,159 | 6,080,485 | |
|
| 15 | |
4,866,692 | 5,894,121 | |
|
| 16 | |
4,877,185 | 5,689,283 | |
|
| 17 | |
5,117,073 | 5,595,211 | |
|
| 18 | |
4,891,769 | 5,363,675 | |
|
| 19 | |
4,781,468 | 5,296,486 | |
|
| 20 | |
3,665,228 | 5,130,632 | |
|
| 21 | |
4,375,099 | 4,919,479 | |
|
| 22 | |
4,219,973 | 4,468,976 | |
|
| 23 | |
4,040,587 | 4,447,100 | |
|
| 24 | |
3,294,394 | 4,301,261 | |
|
| 25 | |
3,685,296 | 4,041,769 | |
|
| 26 | |
3,486,703 | 4,012,012 | |
|
| 27 | |
3,145,585 | 3,450,654 | |
|
| 28 | |
2,842,321 | 3,421,399 | |
|
| 29 | |
3,287,116 | 3,405,565 | |
|
| 30 | |
2,776,755 | 2,926,324 | |
|
| 31 | |
2,573,216 | 2,844,658 | |
|
| 32 | |
2,477,574 | 2,688,418 | |
|
| 33 | |
2,350,725 | 2,673,400 | |
|
| 34 | |
1,722,850 | 2,233,169 | |
|
| 35 | |
1,201,833 | 1,998,257 | |
|
| 36 | |
1,515,069 | 1,819,046 | |
|
| 37 | |
1,793,477 | 1,808,344 | |
|
| 38 | |
1,578,385 | 1,711,263 | |
|
| 39 | |
1,006,749 | 1,293,953 | |
|
| 40 | |
1,227,928 | 1,274,923 | |
|
| 41 | |
1,109,252 | 1,235,786 | |
|
| 42 | |
1,108,229 | 1,211,537 | |
|
| 43 | |
1,003,464 | 1,048,319 | |
|
| 44 | |
799,065 | 902,195 | |
|
| 45 | |
666,168 | 783,600 | |
|
| 46 | |
696,004 | 754,844 | |
|
| 47 | |
638,800 | 642,200 | |
|
| 48 | |
550,043 | 626,932 | |
|
| 49 | |
562,758 | 608,827 | |
|
| — | |
606,900 | 572,059 | |
|
| 50 | |
453,588 | 493,782 | |
|
| |
248,709,873 | 281,421,906 | 32,712,033 | 13.2% |
Population profile
The U.S. resident population includes the total number of people in the 50 states and the District of Columbia. The Bureau also enumerated the residents of the U.S. territory of Puerto Rico; its population was 3,808,610, an 8.1% increase over the number from a decade earlier.
In an introduction to a more detailed population profile (see references below), the Census Bureau highlighted the following facts about U.S population dynamics:
- 75% of respondents said they were White or Caucasian and no other race;
- Hispanics accounted for 12.5% of the U.S. population, up from 9% in 1990;
- 12.4% (34.5 million Americans) were of German descent; German Americans
- 12.3% were of Black or African American descent;
- 3.6% of respondents were Asian;
- 2.4% (6.8 million Americans)[5] of respondents were multiracial (2 or more races). The 2000 Census was the first time survey options for multiracial Americans were provided.
- Between 1990 and 2000, the population aged 45 to 54 grew by 49% and those aged 85 and older grew 38%;
- Women outnumbered men two to one among those aged 85 and older;
- Almost one in five adults had some type of disability in 1997 and the likelihood of having a disability increased with age;
- Families (as opposed to men or women living alone) still dominated American households, but less so than they did thirty years ago;
- Since 1993, both families and non-families have seen median household incomes rise, with "households headed by a woman without a spouse present" growing the fastest;
- People in married-couple families had the lowest poverty rates;
- The poor of any age were more likely than others to lack health insurance coverage;
- The number of elementary and high school students in 2000 fell just short of the all-time high of 49 million reached in 1970;
- Improvements in educational attainment cross racial and ethnic lines; and
- The majority (51%) of U.S. households had access to computers; 42% have Internet access.[6]
Changes in population
Regionally, the South and West experienced the bulk of the nation's population increase, 14,790,890 and 10,411,850, respectively. This meant that the mean center of U.S. population moved to Phelps County, Missouri. The Northeast grew by 2,785,149; the Midwest by 4,724,144.
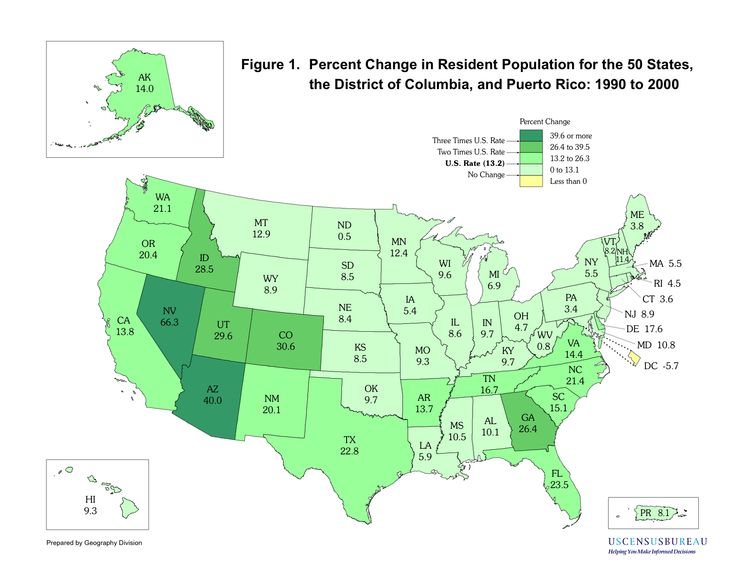

(maps not to scale)
Reapportionment
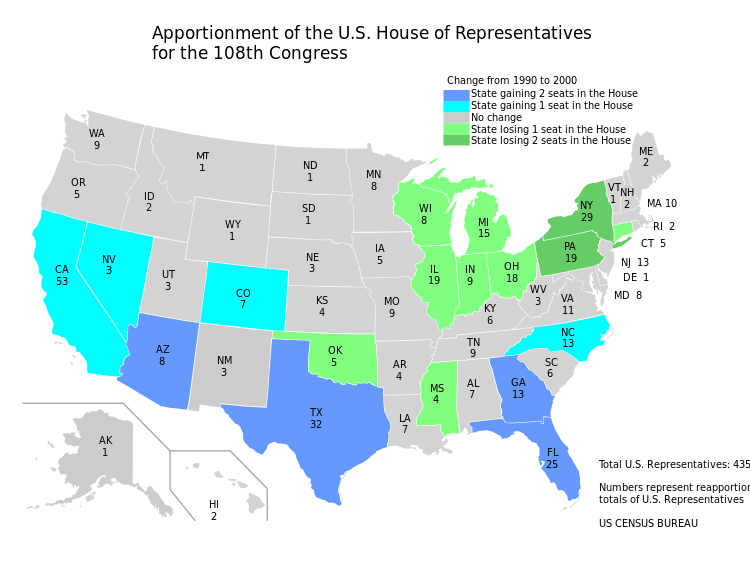
The results of the census are used to determine how many congressional districts each state is apportioned. Congress defines the formula, in accordance with Title 2 of the U.S. Code, to reapportion among the states the 435 seats in the United States House of Representatives. The apportionment population consists of the resident population of the fifty states, plus the overseas military and federal civilian employees and their dependents living with them who could be allocated to a state. Each member of the House represents a population of about 647,000. The populations of the District of Columbia and Puerto Rico are excluded from the apportionment population because they do not have voting seats in the U. S. House of Representatives.
Since the first census in 1790, the decennial count has been the basis for the United States representative form of government. Article I, Section II specifies that "The Number of Representatives shall not exceed one for every thirty Thousand, but each State shall have at Least one Representative." In 1790, each member of the House represented about 34,000 residents. Since then, the House more than quadrupled in size, and in 1911 the number of representatives was fixed at 435. Today, each member represents about 20 times as many constituents.
Adjustment controversy
In the years leading up to the 2000 census, there was substantial controversy over whether the Bureau should adjust census figures based on a follow-up survey, called the post-enumeration survey, of a sample of blocks. (In 1999, the Supreme Court ruled 5-4 that the Constitution prohibits the use of such figures for apportionment purposes, but it may be permissible for other purposes where feasible.) The controversy was partly technical, but also partly political, since based on data from the 1990 census both parties believed that adjustment would likely have the effect, after redistricting, of slightly increasing Democratic representation in legislative bodies, but would also give Utah an additional, probably Republican, representative to Congress.[7][8]
Following the census, discrepancies between the adjusted census figures and demographic estimates of population change could not be resolved in time to meet legal deadlines for the provision of redistricting data, and the Census Bureau therefore recommended that the unadjusted results be used for this purpose.[9] This recommendation was followed by the Secretary of Commerce (the official in charge of making the determination).
Utah controversy
After the census was tabulated, Utah challenged the results in two different ways. Utah was extremely close to gaining a fourth congressional seat, falling 857 people short, which in turn was allocated to North Carolina. The margin was later shortened to 80 people, after the federal government discovered that it overcounted the population of North Carolina by 2,673 residents.[10] The Census Bureau counted members of the military and other federal civilian employees serving abroad as residents of their home state but did not count other individuals living outside the United States. Utah claimed that individuals traveling abroad as religious missionaries should be counted as residents and that the failure to do so imposed a burden on Mormon religious practice. Almost half of all Mormon missionaries, more than 11,000 individuals, were from Utah; only 102 came from North Carolina. If this policy were changed, then Utah would have received an additional seat instead of North Carolina. On November 26, 2002, the Supreme Court affirmed the lower court ruling that rejected Utah's efforts to have Mormon missionaries counted.[11]
The state of Utah then filed another lawsuit alleging that the statistical methods used in computing the state populations were improper and cost Utah the seat. The Bureau uses a method called imputation to assign a number of residents to addresses where residents cannot be reached after multiple efforts. While nationwide the imputation method added .4% to the population, the rate in Utah was .2%. The state challenged that the use of imputation violates the Census Act of 1957 and that it also fails the Constitution's requirement in Article I, Section 2 that an "actual enumeration" be used for apportionment.[12] This case, Utah v. Evans, made it to the Supreme Court, but Utah was again defeated.[13]
Gay and lesbian controversy
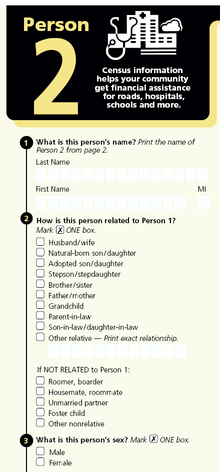
The census forms did not include any questions regarding sexual orientation, making it impossible to compile data comparing heterosexual and homosexual populations. However, two questions were asked that allowed same-sex partnerships to be counted. The questionnaires asked the sex of each person in a household and they asked what the relationship was between each of the members of the household. Respondents could check "Husband/wife" or "unmarried partner" or a number of other relationships.[14][15] Responses were tabulated and the Census Bureau reported that there were more than 658,000 same-sex couples heading households in the United States. However, only about 25% of gay men and 40% of lesbians are in shared-household partnerships at any one time, according to non-Census surveys.[16] For every same-sex couple tallied in the census, there could be three to six more homosexual un-partnered individuals who would not be counted as gay. The Census reported that same-sex male couples numbered 336,001 and female same-sex couples numbered 329,522.[17] Extrapolating from those figures and the surveyed partnering habits of homosexuals, as many as 4.3 million homosexual adults could have been living in the U.S. in 2000. The exact number cannot be known because the Census did not count them specifically. Bisexual and transgender populations were not counted, either, because there were no questions regarding this information. Also unavailable is the number of additional same-sex couples living under the same roof as the first, though this applies to additional heterosexual couples as well. The lack of accurate numbers makes it difficult for lawmakers who are considering legislation on hate crimes or social services for gay families with children.[18] It also makes for less accuracy when predicting the fertility of a population.[19]
Another issue that concerned gay rights advocates involved the automatic changing of data during the tabulation process. This automatic software data compiling method, called allocation, was designed to counteract mistakes and discrepancies in returned questionnaires. Forms that were filled out by two same-sex persons who checked the "Husband/wife" relationship box were treated as a discrepancy. The Census Bureau explained that same-sex "Husband/wife" data samples were changed to "unmarried partner" by computer processing methods in 99% of the cases. In the remaining 1%, computer systems used one of two possibilities: a) one of the two listed sexes was changed, making the partnership appear heterosexual, or b) if the two partners were more than 15 years apart in age, they might have been reassigned into a familial parent/child relationship.[20] The process of automatic reassignment of same-sex marriage data was initiated so that the Census Bureau would not contravene the Defense of Marriage Act passed in 1996. The Act states:
| “ | In determining the meaning of any Act of Congress, or of any ruling, regulation or interpretation of the various administrative bureaus and agencies of the United States, the word 'marriage' means only a legal union between one man and one woman as husband and wife, and the word 'spouse' refers only to a person of the opposite sex who is a husband or wife.[20] | ” |
With allocation moving married same-sex couples to the unmarried partner category, social scientists lost information that could have been extracted relating to the social stability of a same gender couple who identify themselves as married.[19]
References
- ↑ "Population and Area (Historical Censuses)" (PDF). United States Census Bureau. Archived (PDF) from the original on June 24, 2008. Retrieved June 20, 2008.
- ↑ "Census.gov ''Introduction to Census 2000 Data Products''" (PDF). Retrieved April 25, 2011.
- ↑ PIO, US Census Bureau, Census History Staff,. "The "72-Year Rule" - History - U.S. Census Bureau". www.census.gov. Retrieved 2015-10-26.
- 1 2 "Resident Population of the 50 States, and the District of Columbia April 1, 2000 (Census 2000) and April 1, 1990 (1990 Census)". United States Census Bureau. December 28, 2000. Retrieved August 24, 2012.
- ↑ Jayson, Sharon. "'Colorblind' Generation Doesn't Blink at interracial Relationships." USA TODAY. February 7, 2006: n.p. SIRS Researcher. Web. Oct 25, 2010.
- ↑ Newburger, Eric (September 2001). "Home Computers and Internet Use in the United States: August 2000" (PDF). Current Population Reports. U.S. CENSUS BUREAU: 1–2. Retrieved December 5, 2014.
- ↑ "Partisan Politics at Work:Sampling and the 2000 Census". American Political Science Association. JSTOR 420917.
- ↑ Archived January 22, 2006, at the Wayback Machine.
- ↑ "Census 2000 ESCAP". Census.gov. Retrieved April 25, 2011.
- ↑ "Census Blooper Costly for Utah; Error May Have Resulted in Loss of House Seat". The Salt Lake Tribune. October 1, 2003. Archived from the original on March 15, 2009. Retrieved February 25, 2009.
- ↑ Greenhouse, Linda. "Justices Deal Utah a Setback In Its Bid to Gain a House Seat", The New York Times, November 27, 2001. Accessed July 16, 2008.
- ↑ Greenhouse, Linda. "Supreme Court Roundup; Justices to Hear Utah's Challenge to Procedure in 2000 Census", The New York Times, January 23, 2002. Accessed July 16, 2008.
- ↑ Greenhouse, Linda. "THE SUPREME COURT: RIGHT TO PRIVACY; Supreme Court Finds Law On Educational Privacy Isn't Meant for Individuals", The New York Times, June 21, 2002. Accessed July 16, 2008.
- ↑ "Census 2000 Long Form Questionnaire" (PDF). Archived (PDF) from the original on June 4, 2011. Retrieved April 25, 2011.
- ↑ "Census 2000 Short Form Questionnaire" (PDF). Archived (PDF) from the original on June 4, 2011. Retrieved April 25, 2011.
- ↑ "Gay and Lesbian Demographics". Urban.org. Archived from the original on April 28, 2011. Retrieved April 25, 2011.
- ↑ "US Census unmarried couple data listed by state". Gaydemographics.org. Archived from the original on August 18, 2009. Retrieved April 25, 2011.
- ↑ Ly, Phuong (March 12, 2000). "The Washington Post, March 12, 2000. Be Counted In Census, Groups Urge Gay Live-Ins". Pqasb.pqarchiver.com. Retrieved April 25, 2011.
- 1 2 "Unbinding the Ties: Edit Effects of Marital Status on Same Gender Couples". Census.gov. January 7, 2009. Retrieved April 25, 2011.
- 1 2 "Technical Note on Same-Sex Unmarried Partner Data From the 1990 and 2000 Censuses". Census.gov. January 7, 2009. Retrieved April 25, 2011.
Further reading
- Anderson, Margo; Fienberg, Stephen E. (1999). "To Sample or Not to Sample? The 2000 Census Controversy". The Journal of Interdisciplinary History. 30 (1): 1–36. doi:10.1162/002219599551895..
External links
| Wikimedia Commons has media related to 2000 United States Census. |
United States Census Bureau
- Census 2000 gateway
- Population Profile of the United States: 2000
- Population Profile Introductory slide show, in MS Powerpoint format
- State and County QuickFacts, the most requested information
- American FactFinder, for population, housing, economic, and geographic data
- 2000 United States Census Form
Other 2000 census websites
- MLA Language Map from the Modern Language Association
- How the Census Works via Howstuffworks.com