Rasch model
The Rasch model, named after Georg Rasch, is a psychometric model for analyzing categorical data, such as answers to questions on a reading assessment or questionnaire responses, as a function of the trade-off between (a) the respondent's abilities, attitudes or personality traits and (b) the item difficulty.[1] For example, they may be used to estimate a student's reading ability, or the extremity of a person's attitude to capital punishment from responses on a questionnaire. In addition to psychometrics and educational research, the Rasch model and its extensions are used in other areas, including the health profession[2] and market research[3] because of their general applicability.[4]
The mathematical theory underlying Rasch models is a special case of item response theory and, more generally, a special case of a generalized linear model. However, there are important differences in the interpretation of the model parameters and its philosophical implications[5] that separate proponents of the Rasch model from the item response modeling tradition. A central aspect of this divide relates to the role of specific objectivity,[6] a defining property of the Rasch model according to Georg Rasch, as a requirement for successful measurement.
Overview
The Rasch model for measurement
In the Rasch model, the probability of a specified response (e.g. right/wrong answer) is modeled as a function of person and item parameters. Specifically, in the original Rasch model, the probability of a correct response is modeled as a logistic function of the difference between the person and item parameter. The mathematical form of the model is provided later in this article. In most contexts, the parameters of the model characterize the proficiency of the respondents and the difficulty of the items as locations on a continuous latent variable. For example, in educational tests, item parameters represent the difficulty of items while person parameters represent the ability or attainment level of people who are assessed. The higher a person's ability relative to the difficulty of an item, the higher the probability of a correct response on that item. When a person's location on the latent trait is equal to the difficulty of the item, there is by definition a 0.5 probability of a correct response in the Rasch model.
A Rasch model is a model in one sense in that it represents the structure which data should exhibit in order to obtain measurements from the data; i.e. it provides a criterion for successful measurement. Beyond data, Rasch's equations model relationships we expect to obtain in the real world. For instance, education is intended to prepare children for the entire range of challenges they will face in life, and not just those that appear in textbooks or on tests. By requiring measures to remain the same (invariant) across different tests measuring the same thing, Rasch models make it possible to test the hypothesis that the particular challenges posed in a curriculum and on a test coherently represent the infinite population of all possible challenges in that domain. A Rasch model is therefore a model in the sense of an ideal or standard that provides a heuristic fiction serving as a useful organizing principle even when it is never actually observed in practice.
The perspective or paradigm underpinning the Rasch model is distinct from the perspective underpinning statistical modelling. Models are most often used with the intention of describing a set of data. Parameters are modified and accepted or rejected based on how well they fit the data. In contrast, when the Rasch model is employed, the objective is to obtain data which fit the model (Andrich, 2004; Wright, 1984, 1999). The rationale for this perspective is that the Rasch model embodies requirements which must be met in order to obtain measurement, in the sense that measurement is generally understood in the physical sciences.
A useful analogy for understanding this rationale is to consider objects measured on a weighing scale. Suppose the weight of an object A is measured as being substantially greater than the weight of an object B on one occasion, then immediately afterward the weight of object B is measured as being substantially greater than the weight of object A. A property we require of measurements is that the resulting comparison between objects should be the same, or invariant, irrespective of other factors. This key requirement is embodied within the formal structure of the Rasch model. Consequently, the Rasch model is not altered to suit data. Instead, the method of assessment should be changed so that this requirement is met, in the same way that a weighing scale should be rectified if it gives different comparisons between objects upon separate measurements of the objects.
Data analysed using the model are usually responses to conventional items on tests, such as educational tests with right/wrong answers. However, the model is a general one, and can be applied wherever discrete data are obtained with the intention of measuring a quantitative attribute or trait.
Scaling
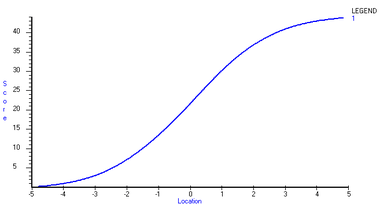
When all test-takers have an opportunity to attempt all items on a single test, each total score on the test maps to a unique estimate of ability and the greater the total, the greater the ability estimate. Total scores do not have a linear relationship with ability estimates. Rather, the relationship is non-linear as shown in Figure 1. The total score is shown on the vertical axis, while the corresponding person location estimate is shown on the horizontal axis. For the particular test on which the test characteristic curve (TCC) shown in Figure 1 is based, the relationship is approximately linear throughout the range of total scores from about 10 to 33. The shape of the TCC is generally somewhat sigmoid as in this example. However, the precise relationship between total scores and person location estimates depends on the distribution of items on the test. The TCC is steeper in ranges on the continuum in which there are a number of items, such as in the range on either side of 0 in Figures 1 and 2.
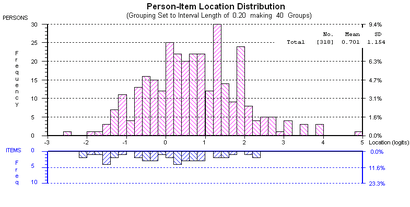
In applying the Rasch model, item locations are often scaled first, based on methods such as those described below. This part of the process of scaling is often referred to as item calibration. In educational tests, the smaller the proportion of correct responses, the higher the difficulty of an item and hence the higher the item's scale location. Once item locations are scaled, the person locations are measured on the scale. As a result, person and item locations are estimated on a single scale as shown in Figure 2.
Interpreting scale locations
For dichotomous data such as right/wrong answers, by definition, the location of an item on a scale corresponds with the person location at which there is a 0.5 probability of a correct response to the question. In general, the probability of a person responding correctly to a question with difficulty lower than that person's location is greater than 0.5, while the probability of responding correctly to a question with difficulty greater than the person's location is less than 0.5. The Item Characteristic Curve (ICC) or Item Response Function (IRF) shows the probability of a correct response as a function of the ability of persons. A single ICC is shown and explained in more detail in relation to Figure 4 in this article (see also the item response function). The leftmost ICCs in Figure 3 are the easiest items, the rightmost items in the same figure are the most difficult items.
When responses of a person are listed according to item difficulty, from lowest to highest, the most likely pattern is a Guttman pattern or vector; i.e. {1,1,...,1,0,0,0,...,0}. However, while this pattern is the most probable given the structure of the Rasch model, the model requires only probabilistic Guttman response patterns; that is, patterns which tend toward the Guttman pattern. It is unusual for responses to conform strictly to the pattern because there are many possible patterns. It is unnecessary for responses to conform strictly to the pattern in order for data to fit the Rasch model.

Each ability estimate has an associated standard error of measurement, which quantifies the degree of uncertainty associated with the ability estimate. Item estimates also have standard errors. Generally, the standard errors of item estimates are considerably smaller than the standard errors of person estimates because there are usually more response data for an item than for a person. That is, the number of people attempting a given item is usually greater than the number of items attempted by a given person. Standard errors of person estimates are smaller where the slope of the ICC is steeper, which is generally through the middle range of scores on a test. Thus, there is greater precision in this range since the steeper the slope, the greater the distinction between any two points on the line.
Statistical and graphical tests are used to evaluate the correspondence of data with the model. Certain tests are global, while others focus on specific items or people. Certain tests of fit provide information about which items can be used to increase the reliability of a test by omitting or correcting problems with poor items. In Rasch Measurement the person separation index is used instead of reliability indices. However, the person separation index is analogous to a reliability index. The separation index is a summary of the genuine separation as a ratio to separation including measurement error. As mentioned earlier, the level of measurement error is not uniform across the range of a test, but is generally larger for more extreme scores (low and high).
Features of the Rasch model
The class of models is named after Georg Rasch, a Danish mathematician and statistician who advanced the epistemological case for the models based on their congruence with a core requirement of measurement in physics; namely the requirement of invariant comparison.[1] This is the defining feature of the class of models, as is elaborated upon in the following section. The Rasch model for dichotomous data has a close conceptual relationship to the law of comparative judgment (LCJ), a model formulated and used extensively by L. L. Thurstone,[7][8] and therefore also to the Thurstone scale.[9]
Prior to introducing the measurement model he is best known for, Rasch had applied the Poisson distribution to reading data as a measurement model, hypothesizing that in the relevant empirical context, the number of errors made by a given individual was governed by the ratio of the text difficulty to the person's reading ability. Rasch referred to this model as the multiplicative Poisson model. Rasch's model for dichotomous data – i.e. where responses are classifiable into two categories – is his most widely known and used model, and is the main focus here. This model has the form of a simple logistic function.
The brief outline above highlights certain distinctive and interrelated features of Rasch's perspective on social measurement, which are as follows:
- He was concerned principally with the measurement of individuals, rather than with distributions among populations.
- He was concerned with establishing a basis for meeting a priori requirements for measurement deduced from physics and, consequently, did not invoke any assumptions about the distribution of levels of a trait in a population.
- Rasch's approach explicitly recognizes that it is a scientific hypothesis that a given trait is both quantitative and measurable, as operationalized in a particular experimental context.
Thus, congruent with the perspective articulated by Thomas Kuhn in his 1961 paper The function of measurement in modern physical science, measurement was regarded both as being founded in theory, and as being instrumental to detecting quantitative anomalies incongruent with hypotheses related to a broader theoretical framework.[10] This perspective is in contrast to that generally prevailing in the social sciences, in which data such as test scores are directly treated as measurements without requiring a theoretical foundation for measurement. Although this contrast exists, Rasch's perspective is actually complementary to the use of statistical analysis or modelling that requires interval-level measurements, because the purpose of applying a Rasch model is to obtain such measurements. Applications of Rasch models are described in a wide variety of sources, including Alagumalai, Curtis & Hungi (2005), Bezruczko (2005), Bond & Fox (2007), Fisher & Wright (1994), Masters & Keeves (1999), and the Journal of Applied Measurement.
Invariant comparison and sufficiency
The Rasch model for dichotomous data is often regarded as an item response theory (IRT) model with one item parameter. However, rather than being a particular IRT model, proponents of the model[11] regard it as a model that possesses a property which distinguishes it from other IRT models. Specifically, the defining property of Rasch models is their formal or mathematical embodiment of the principle of invariant comparison. Rasch summarised the principle of invariant comparison as follows:
- The comparison between two stimuli should be independent of which particular individuals were instrumental for the comparison; and it should also be independent of which other stimuli within the considered class were or might also have been compared.
- Symmetrically, a comparison between two individuals should be independent of which particular stimuli within the class considered were instrumental for the comparison; and it should also be independent of which other individuals were also compared, on the same or some other occasion.[12]
Rasch models embody this principle because their formal structure permits algebraic separation of the person and item parameters, in the sense that the person parameter can be eliminated during the process of statistical estimation of item parameters. This result is achieved through the use of conditional maximum likelihood estimation, in which the response space is partitioned according to person total scores. The consequence is that the raw score for an item or person is the sufficient statistic for the item or person parameter. That is to say, the person total score contains all information available within the specified context about the individual, and the item total score contains all information with respect to item, with regard to the relevant latent trait. The Rasch model requires a specific structure in the response data, namely a probabilistic Guttman structure.
In somewhat more familiar terms, Rasch models provide a basis and justification for obtaining person locations on a continuum from total scores on assessments. Although it is not uncommon to treat total scores directly as measurements, they are actually counts of discrete observations rather than measurements. Each observation represents the observable outcome of a comparison between a person and item. Such outcomes are directly analogous to the observation of the rotation of a balance scale in one direction or another. This observation would indicate that one or other object has a greater mass, but counts of such observations cannot be treated directly as measurements.
Rasch pointed out that the principle of invariant comparison is characteristic of measurement in physics using, by way of example, a two-way experimental frame of reference in which each instrument exerts a mechanical force upon solid bodies to produce acceleration. Rasch[1]:112–3 stated of this context: "Generally: If for any two objects we find a certain ratio of their accelerations produced by one instrument, then the same ratio will be found for any other of the instruments". It is readily shown that Newton's second law entails that such ratios are inversely proportional to the ratios of the masses of the bodies.
The mathematical form of the Rasch model for dichotomous data
Let be a dichotomous random variable where, for example, denotes a correct response and an incorrect response to a given assessment item. In the Rasch model for dichotomous data, the probability of the outcome is given by:


where is the ability of person and is the difficulty of item . Thus, in the case of a dichotomous attainment item, is the probability of success upon interaction between the relevant person and assessment item. It is readily shown that the log odds, or logit, of correct response by a person to an item, based on the model, is equal to . Given two examinees with the same ability parameters and and an arbitrary item with difficulty , compute the difference in logits for these two examinees by . This difference becomes . Conversely, it can be shown that the log odds of a correct response by the same person to one item, conditional on a correct response to one of two items, is equal to the difference between the item locations. For example,


where is the total score of person n over the two items, which implies a correct response to one or other of the items.[1][13][14] Hence, the conditional log odds does not involve the person parameter , which can therefore be eliminated by conditioning on the total score . That is, by partitioning the responses according to raw scores and calculating the log odds of a correct response, an estimate is obtained without involvement of . More generally, a number of item parameters can be estimated iteratively through application of a process such as Conditional Maximum Likelihood estimation (see Rasch model estimation). While more involved, the same fundamental principle applies in such estimations.


The ICC of the Rasch model for dichotomous data is shown in Figure 4. The grey line maps a person with a location of approximately 0.2 on the latent continuum, to the probability of the discrete outcome for items with different locations on the latent continuum. The location of an item is, by definition, that location at which the probability that is equal to 0.5. In figure 4, the black circles represent the actual or observed proportions of persons within Class Intervals for which the outcome was observed. For example, in the case of an assessment item used in the context of educational psychology, these could represent the proportions of persons who answered the item correctly. Persons are ordered by the estimates of their locations on the latent continuum and classified into Class Intervals on this basis in order to graphically inspect the accordance of observations with the model. There is a close conformity of the data with the model. In addition to graphical inspection of data, a range of statistical tests of fit are used to evaluate whether departures of observations from the model can be attributed to random effects alone, as required, or whether there are systematic departures from the model.
The polytomous form of the Rasch model
The polytomous Rasch model, which is a generalisation of the dichotomous model, can be applied in contexts in which successive integer scores represent categories of increasing level or magnitude of a latent trait, such as increasing ability, motor function, endorsement of a statement, and so forth. The Polytomous response model is, for example, applicable to the use of Likert scales, grading in educational assessment, and scoring of performances by judges.
Other considerations
A criticism of the Rasch model is that it is overly restrictive or prescriptive because it does not permit each item to have a different discrimination. A criticism specific to the use of multiple choice items in educational assessment is that there is no provision in the model for guessing because the left asymptote always approaches a zero probability in the Rasch model. These variations are available in models such as the two and three parameter logistic models.[15] However, the specification of uniform discrimination and zero left asymptote are necessary properties of the model in order to sustain sufficiency of the simple, unweighted raw score.
Verhelst & Glas (1995) derive Conditional Maximum Likelihood (CML) equations for a model they refer to as the One Parameter Logistic Model (OPLM). In algebraic form it appears to be identical with the 2PL model, but OPLM contains preset discrimination indexes rather than 2PL's estimated discrimination parameters. As noted by these authors, though, the problem one faces in estimation with estimated discrimination parameters is that the discriminations are unknown, meaning that the weighted raw score "is not a mere statistic, and hence it is impossible to use CML as an estimation method" (Verhelst & Glas, 1995, p. 217). That is, sufficiency of the weighted "score" in the 2PL cannot be used according to the way in which a sufficient statistic is defined. If the weights are imputed instead of being estimated, as in OPLM, conditional estimation is possible and some of the properties of the Rasch model are retained (Verhelst, Glas & Verstralen, 1995; Verhelst & Glas, 1995). In OPLM, the values of the discrimination index are restricted to between 1 and 15. A limitation of this approach is that in practice, values of discrimination indexes must be preset as a starting point. This means some type of estimation of discrimination is involved when the purpose is to avoid doing so.
The Rasch model for dichotomous data inherently entails a single discrimination parameter which, as noted by Rasch,[1]:121 constitutes an arbitrary choice of the unit in terms of which magnitudes of the latent trait are expressed or estimated. However, the Rasch model requires that the discrimination is uniform across interactions between persons and items within a specified frame of reference (i.e. the assessment context given conditions for assessment).
Application of the model provides diagnostic information regarding how well the criterion is met. Application of the model can also provide information about how well items or questions on assessments work to measure the ability or trait. For instance, knowing the proportion of persons that engage in a given behavior, the Rasch model can be used to derive the relations between difficulty of behaviors, attitudes and behaviors.[16] Prominent advocates of Rasch models include Benjamin Drake Wright, David Andrich and Erling Andersen.
See also
Further reading
- Alagumalai, S., Curtis, D.D. & Hungi, N. (2005). Applied Rasch Measurement: A book of exemplars. Springer-Kluwer.
- Andrich, D. (1978a). A rating formulation for ordered response categories. Psychometrika, 43, 357–74.
- Andrich, D. (1988). Rasch models for measurement. Beverly Hills: Sage Publications.
- Andrich, D. (2004). Controversy and the Rasch model: a characteristic of incompatible paradigms? Medical Care, 42, 1–16.
- Baker, F. (2001). The Basics of Item Response Theory. ERIC Clearinghouse on Assessment and Evaluation, University of Maryland, College Park, MD. Available free with software included from IRT at Edres.org
- Bezruczko, N. (Ed.). (2005). Rasch measurement in health sciences. Maple Grove, MN: JAM Press.
- Bond, T.G. & Fox, C.M. (2007). Applying the Rasch Model: Fundamental measurement in the human sciences. 2nd Edn (includes Rasch software on CD-ROM). Lawrence Erlbaum.
- Fischer, G.H. & Molenaar, I.W. (1995). Rasch models: foundations, recent developments and applications. New York: Springer-Verlag.
- Fisher, W. P., Jr., & Wright, B. D. (Eds.). (1994). Applications of probabilistic conjoint measurement. International Journal of Educational Research, 21(6), 557-664.
- Goldstein H & Blinkhorn.S (1977). Monitoring Educational Standards: an inappropriate model. . Bull.Br.Psychol.Soc. 30 309–311
- Goldstein H & Blinkhorn.S (1982). The Rasch Model Still Does Not Fit. . BERJ 82 167–170.
- Hambleton RK, Jones RW. "Comparison of classical test theory and item response," Educational Measurement: Issues and Practice 1993; 12(3):38–47. available in the ITEMS Series from the National Council on Measurement in Education
- Harris D. Comparison of 1-, 2-, and 3-parameter IRT models. Educational Measurement: Issues and Practice;. 1989; 8: 35–41 available in the ITEMS Series from the National Council on Measurement in Education
- Kuhn, T.S. (1961). The function of measurement in modern physical science. ISIS, 52, 161–193. JSTOR
- Linacre, J. M. (1999). "Understanding Rasch measurement: Estimation methods for Rasch measures". Journal of Outcome Measurement. 3 (4): 382–405.
- Masters, G. N., & Keeves, J. P. (Eds.). (1999). Advances in measurement in educational research and assessment. New York: Pergamon.
- Verhelst, N.D. and Glas, C.A.W. (1995). The one parameter logistic model. In G.H. Fischer and I.W. Molenaar (Eds.), Rasch Models: Foundations, recent developments, and applications (pp. 215–238). New York: Springer Verlag.
- Verhelst, N.D., Glas, C.A.W. and Verstralen, H.H.F.M. (1995). One parameter logistic model (OPLM). Arnhem: CITO.
- von Davier, M., & Carstensen, C. H. (2007). Multivariate and Mixture Distribution Rasch Models: Extensions and Applications. New York: Springer.
- Wright, B. D. (1984). Despair and hope for educational measurement. Contemporary Education Review, 3(1), 281-288 .
- Wright, B. D. (1999). Fundamental measurement for psychology. In S. E. Embretson & S. L. Hershberger (Eds.), The new rules of measurement: What every educator and psychologist should know (pp. 65–104. Hillsdale, New Jersey: Lawrence Erlbaum Associates.
- Wright, B.D., & Stone, M.H. (1979). Best Test Design. Chicago, IL: MESA Press.
- Wu, M. & Adams, R. (2007). Applying the Rasch model to psycho-social measurement: A practical approach. Melbourne, Australia: Educational Measurement Solutions. Available free from Educational Measurement Solutions
References
- 1 2 3 4 5 Rasch, G. (1960/1980). Probabilistic models for some intelligence and attainment tests.(Copenhagen, Danish Institute for Educational Research), expanded edition (1980) with foreword and afterword by B.D. Wright. Chicago: The University of Chicago Press.
- ↑ Bezruczko, N. (2005). Rasch measurement in health sciences. Maple Grove, MN: Jam Press.
- ↑ Bechtel, G. G. (1985). Generalizing the Rasch model for consumer rating scales. Marketing Science, 4(1), 62-73.
- ↑ Wright, B. D. (1977). Solving measurement problems with the Rasch model. Journal of Educational Measurement, 14(2), 97-116.
- ↑ Linacre J.M. (2005). Rasch dichotomous model vs. One-parameter Logistic Model. Rasch Measurement Transactions, 19:3, 1032
- ↑ Rasch, G. (1977). On Specific Objectivity: An attempt at formalizing the request for generality and validity of scientific statements. The Danish Yearbook of Philosophy, 14, 58-93.
- ↑ Thurstone, L. L. (1927). A law of comparative judgment. Psychological review, 34(4), 273.
- ↑ Thurstone and sensory scaling: Then and now. (1994). Thurstone and sensory scaling: Then and now. Psychological Review, 101(2), 271–277. doi:10.1037/0033-295X.101.2.271
- ↑ Andrich, D. (1978b). Relationships between the Thurstone and Rasch approaches to item scaling. Applied Psychological Measurement, 2, 449–460.
- ↑ Kuhn, Thomas S. "The function of measurement in modern physical science." Isis (1961): 161-193.
- ↑
- Bond, T.G. & Fox, C.M. (2007). Applying the Rasch Model: Fundamental measurement in the human sciences. 2nd Edn (includes Rasch software on CD-ROM). Lawrence Erlbaum. Page 265
- ↑ Rasch, G. (1961). On general laws and the meaning of measurement in psychology, pp. 321–334 in Proceedings of the Fourth Berkeley Symposium on Mathematical Statistics and Probability, IV. Berkeley, California: University of California Press. Available free from Project Euclid
- ↑ Andersen, E.B. (1977). Sufficient statistics and latent trait models, Psychometrika, 42, 69–81.
- ↑ Andrich, D. (2010). Sufficiency and conditional estimation of person parameters in the polytomous Rasch model. Psychometrika, 75(2), 292-308.
- ↑ Birnbaum, A. (1968). Some latent trait models and their use in inferring an examinee’s ability. In Lord, F.M. & Novick, M.R. (Eds.), Statistical theories of mental test scores. Reading, MA: Addison–Wesley.
- ↑ Byrka, Katarzyna; Jȩdrzejewski, Arkadiusz; Sznajd-Weron, Katarzyna; Weron, Rafał (2016-09-01). "Difficulty is critical: The importance of social factors in modeling diffusion of green products and practices". Renewable and Sustainable Energy Reviews. 62: 723–735. doi:10.1016/j.rser.2016.04.063.
External links
- Institute for Objective Measurement Online Rasch Resources
- Pearson Psychometrics Laboratory, with information about Rasch models
- Journal of Applied Measurement
- Journal of Outcome Measurement (all issues available for free downloading)
- Berkeley Evaluation & Assessment Research Center (ConstructMap software)
- Directory of Rasch Software – freeware and paid
- IRT Modeling Lab at U. Illinois Urbana Champ.
- National Council on Measurement in Education (NCME)
- Rasch analysis
- Rasch Measurement Transactions
- The Standards for Educational and Psychological Testing
- The Trouble with Rasch