Rutherford backscattering spectrometry
Rutherford backscattering spectrometry (RBS) is an analytical technique used in materials science. Sometimes referred to as high-energy ion scattering (HEIS) spectrometry, RBS is used to determine the structure and composition of materials by measuring the backscattering of a beam of high energy ions (typically protons or alpha particles) impinging on a sample.
The Geiger–Marsden experiment
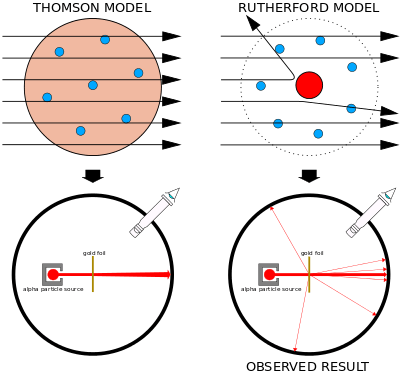
Right: Observed results: a small portion of the particles were deflected, indicating a small, concentrated positive charge.
Rutherford backscattering spectrometry is named after Lord Ernest Rutherford, a physicist sometimes referred to as the father of nuclear physics. Rutherford supervised a series of experiments carried out by Hans Geiger and Ernest Marsden between 1909 and 1914 studying the scattering of alpha particles through metal foils. While attempting to eliminate "stray particles" they believed to be caused by an imperfection in their alpha source, Rutherford suggested that Marsden attempt to measure backscattering from a gold foil sample. According to the then-dominant plum-pudding model of the atom, in which small negative electrons were spread through a diffuse positive region, backscattering of the high-energy positive alpha particles should have been nonexistent. At most small deflections should occur as the alpha particles passed almost unhindered through the foil. Instead, when Marsden positioned the detector on the same side of the foil as the alpha particle source, he immediately detected a noticeable backscattered signal. According to Rutherford, "It was quite the most incredible event that has ever happened to me in my life. It was almost as incredible as if you fired a 15-inch shell at a piece of tissue paper and it came back and hit you."[1]
Rutherford interpreted the result of the Geiger–Marsden experiment as an indication of a Coulomb collision with a single massive positive particle. This led him to the conclusion that the atom's positive charge could not be diffuse but instead must be concentrated in a single massive core: the atomic nucleus. Calculations indicated that the charge necessary to accomplish this deflection was approximately 100 times the charge of the electron, close to the atomic number of gold. This led to the development of the Rutherford model of the atom in which a positive nucleus made up of Ne positive particles, or protons, was surrounded by N orbiting electrons of charge -e to balance the nuclear charge. This model was eventually superseded by the Bohr atom, incorporating some early results from quantum mechanics.
If the energy of the incident particle is increased sufficiently, the Coulomb barrier is exceeded and the wavefunctions of the incident and struck particles overlap. This may result in nuclear reactions in certain cases, but frequently the interaction remains elastic, although the scattering cross-sections may fluctuate wildly as a function of energy. This case is known as "Elastic (non-Rutherford) Backscattering Spectrometry" (EBS). There has recently been great progress in determining EBS scattering cross-sections, by solving Schrödinger's equation for each interaction.
Basic principles
We describe Rutherford backscattering as an elastic, hard-sphere collision between a high kinetic energy particle from the incident beam (the projectile) and a stationary particle located in the sample (the target). Elastic in this context means that no energy is transferred between the incident particle and the stationary particle during the collision, and the state of the stationary particle is not changed. (Except that for a small amount of momentum, which is ignored.)
Note that nuclear interactions are generally not elastic, since a collision may result in a nuclear reaction, with the release of considerable quantities of energy. Nuclear reaction analysis (NRA) is useful for detecting light elements. However, this is not Rutherford scattering.
Considering the kinematics of the collision (that is, the conservation of momentum and kinetic energy), the energy E1 of the scattered projectile is reduced from the initial energy E0:

where k is known as the kinematical factor, and

where particle 1 is the projectile, particle 2 is the target nucleus, and is the scattering angle of the projectile in the laboratory frame of reference (that is, relative to the observer). The plus sign is taken when the mass of the projectile is less than that of the target, otherwise the minus sign is taken.

While this equation correctly determines the energy of the scattered projectile for any particular scattering angle (relative to the observer), it does not describe the probability of observing such an event. For that we need the differential cross-section of the backscattering event:

where and are the atomic numbers of the incident and target nuclei. This equation is written in the centre of mass frame of reference and is therefore not a function of the mass of either the projectile or the target nucleus.


Note that the scattering angle in the laboratory frame of reference is not the same as the scattering angle in the centre of mass frame of reference (although for RBS experiments they are usually very similar). However, heavy ion projectiles can easily recoil lighter ions which, if the geometry is right, can be ejected from the target and detected. This is the basis of the Elastic Recoil Detection (ERD, with synonyms ERDA, FRS, HFS) technique. RBS often uses a He beam which readily recoils H, so simultaneous RBS/ERD is frequently done to probe the hydrogen isotope content of samples (although H ERD with a He beam above 1 MeV is not Rutherford: see http://www-nds.iaea.org/sigmacalc). For ERD the scattering angle in the lab frame of reference is quite different from that in the centre of mass frame of reference.

Note also that heavy ions cannot backscatter from light ones: it is kinematically prohibited. The kinematical factor must remain real, and this limits the permitted scattering angle in the laboratory frame of reference. In ERD it is often convenient to place the recoil detector at recoil angles large enough to prohibit signal from the scattered beam. The scattered ion intensity is always very large compared to the recoil intensity (the Rutherford scattering cross-section formula goes to infinity as the scattering angle goes to zero), and for ERD the scattered beam usually has to be excluded from the measurement somehow.
The singularity in the Rutherford scattering cross-section formula is unphysical of course. If the scattering cross-section is zero it implies that the projectile never comes close to the target, but in this case it also never penetrates the electron cloud surrounding the nucleus either. The pure Coulomb formula for the scattering cross-section shown above must be corrected for this screening effect, which becomes more important as the energy of the projectile decreases (or, equivalently, its mass increases).
While large-angle scattering only occurs for ions which scatter off target nuclei, inelastic small-angle scattering can also occur off the sample electrons. This results in a gradual decrease in ions which penetrate more deeply into the sample, so that backscattering off interior nuclei occurs with a lower "effective" incident energy. The amount by which the ion energy is lowered after passing through a given distance is referred to as the stopping power of the material and is dependent on the electron distribution. This energy loss varies continuously with respect to distance traversed, so that stopping power is expressed as

For high energy ions stopping power is usually proportional to ; however, precise calculation of stopping power is difficult to carry out with any accuracy.

Stopping power (properly, stopping force) has units of energy per unit length. It is generally given in thin film units, that is eV /(atom/cm2) since it is measured experimentally on thin films whose thickness is always measured absolutely as mass per unit area, avoiding the problem of determining the density of the material which may vary as a function of thickness. Stopping power is now known for all materials at around 2%, see http://www.srim.org.
Instrumentation

An RBS instrument generally includes three essential components:
- An ion source, usually alpha particles (He2+ ions) or, less commonly, protons.
- A linear particle accelerator capable of accelerating incident ions to high energies, usually in the range 1-3 MeV.
- A detector capable of measuring the energies of backscattered ions over some range of angles.
Two common source/acceleration arrangements are used in commercial RBS systems, working in either one or two stages. One-stage systems consist of a He+ source connected to an acceleration tube with a high positive potential applied to the ion source, and the ground at the end of the acceleration tube. This arrangement is simple and convenient, but it can be difficult to achieve energies of much more than 1 MeV due to the difficulty of applying very high voltages to the system.
Two-stage systems, or "tandem accelerators", start with a source of He− ions and position the positive terminal at the center of the acceleration tube. A stripper element included in the positive terminal removes electrons from ions which pass through, converting He− ions to He++ ions. The ions thus start out being attracted to the terminal, pass through and become positive, and are repelled until they exit the tube at ground. This arrangement, though more complex, has the advantage of achieving higher accelerations with lower applied voltages: a typical tandem accelerator with an applied voltage of 750 kV can achieve ion energies of over 2 MeV.[4]
Detectors to measure backscattered energy are usually silicon surface barrier detectors, a very thin layer (100 nm) of P-type silicon on an N-type substrate forming a p-n junction. Ions which reach the detector lose some of their energy to inelastic scattering from the electrons, and some of these electrons gain enough energy to overcome the band gap between the semiconductor valence and conduction bands. This means that each ion incident on the detector will produce some number of electron-hole pairs which is dependent on the energy of the ion. These pairs can be detected by applying a voltage across the detector and measuring the current, providing an effective measurement of the ion energy. The relationship between ion energy and the number of electron-hole pairs produced will be dependent on the detector materials, the type of ion and the efficiency of the current measurement; energy resolution is dependent on thermal fluctuations. It should also be noted that after one ion is incident on the detector, there will be some dead time before the electron-hole pairs recombine in which a second incident ion cannot be distinguished from the first.[5]
Angular dependence of detection can be achieved by using a movable detector, or more practically by separating the surface barrier detector into many independent cells which can be measured independently, covering some range of angles around direct (180 degrees) back-scattering. Angular dependence of the incident beam is controlled by using a tiltable sample stage.
Composition and depth measurement
The energy loss of a backscattered ion is dependent on two processes: the energy lost in scattering events with sample nuclei, and the energy lost to small-angle scattering from the sample electrons. The first process is dependent on the scattering cross-section of the nucleus and thus on its mass and atomic number. For a given measurement angle, nuclei of two different elements will therefore scatter incident ions to different degrees and with different energies, producing separate peaks on an N(E) plot of measurement count versus energy. These peaks are characteristic of the elements contained in the material, providing a means of analyzing the composition of a sample by matching scattered energies to known scattering cross-sections. Relative concentrations can be determined by measuring the heights of the peaks.
The second energy loss process, the stopping power of the sample electrons, does not result in large discrete losses such as those produced by nuclear collisions. Instead it creates a gradual energy loss dependent on the electron density and the distance traversed in the sample. This energy loss will lower the measured energy of ions which backscatter from nuclei inside the sample in a continuous manner dependent on the depth of the nuclei. The result is that instead of the sharp backscattered peaks one would expect on an N(E) plot, with the width determined by energy and angular resolution, the peaks observed trail off gradually towards lower energy as the ions pass through the depth occupied by that element. Elements which only appear at some depth inside the sample will also have their peak positions shifted by some amount which represents the distance an ion had to traverse to reach those nuclei.
In practice, then, a compositional depth profile can be determined from an RBS N(E) measurement. The elements contained by a sample can be determined from the positions of peaks in the energy spectrum. Depth can be determined from the width and shifted position of these peaks, and relative concentration from the peak heights. This is especially useful for the analysis of a multilayer sample, for example, or for a sample with a composition which varies more continuously with depth.
This kind of measurement can only be used to determine elemental composition; the chemical structure of the sample cannot be determined from the N(E) profile. However, it is possible to learn something about this through RBS by examining the crystal structure. This kind of spatial information can be investigated by taking advantage of blocking and channeling.
Structural measurements: blocking and channeling
To fully understand the interaction of an incident beam of nuclei with a crystalline structure, it is necessary to comprehend two more key concepts: blocking and channeling.
When a beam of ions with parallel trajectories is incident on a target atom, scattering off that atom will prevent collisions in a cone-shaped region "behind" the target relative to the beam. This occurs because the repulsive potential of the target atom bends close ion trajectories away from their original path, and is referred to as blocking. The radius of this blocked region, at a distance L from the original atom, is given by

When an ion is scattered from deep inside a sample, it can then re-scatter off a second atom, creating a second blocked cone in the direction of the scattered trajectory. This can be detected by carefully varying the detection angle relative to the incident angle.
Channeling is observed when the incident beam is aligned with a major symmetry axis of the crystal. Incident nuclei which avoid collisions with surface atoms are excluded from collisions with all atoms deeper in the sample, due to blocking by the first layer of atoms. When the interatomic distance is large compared to the radius of the blocked cone, the incident ions can penetrate many times the interatomic distance without being backscattered. This can result in a drastic reduction of the observed backscattered signal when the incident beam is oriented along one of the symmetry directions, allowing determination of a sample's regular crystal structure. Channeling works best for very small blocking radii, i.e. for high-energy, low-atomic-number incident ions such as He+.
The tolerance for the deviation of the ion beam angle of incidence relative to the symmetry direction depends on the blocking radius, making the allowable deviation angle proportional to

While the intensity of an RBS peak is observed to decrease across most of its width when the beam is channeled, a narrow peak at the high-energy end of larger peak will often be observed, representing surface scattering from the first layer of atoms. The presence of this peak opens the possibility of surface sensitivity for RBS measurements.
Profiling of displaced atoms
In addition, channeling of ions can also be used to analyze a crystalline sample for lattice damage.[8] If atoms within the target are displaced from their crystalline lattice site, this will result in a higher backscattering yield in relation to a perfect crystal. By comparing the spectrum from a sample being analyzed to that from a perfect crystal, and that obtained at a random (non-channeling) orientation (representative of a spectrum from an amorphous sample), it is possible to determine the extent of crystalline damage in terms of a fraction of displaced atoms. Multiplying this fraction by the density of the material when amorphous then also gives an estimate for the concentration of displaced atoms. The energy at which the increased backscattering occurs can also be used to determine the depth at which the displaced atoms are and a defect depth profile can be built up as a result.
Surface sensitivity
While RBS is generally used to measure the bulk composition and structure of a sample, it is possible to obtain some information about the structure and composition of the sample surface. When the signal is channeled to remove the bulk signal, careful manipulation of the incident and detection angles can be used to determine the relative positions of the first few layers of atoms, taking advantage of blocking effects.
The surface structure of a sample can be changed from the ideal in a number of ways. The first layer of atoms can change its distance from subsequent layers (relaxation); it can assume a different two-dimensional structure than the bulk (reconstruction); or another material can be adsorbed onto the surface. Each of these cases can be detected by RBS. For example, surface reconstruction can be detected by aligning the beam in such a way that channeling should occur, so that only a surface peak of known intensity should be detected. A higher-than-usual intensity or a wider peak will indicate that the first layers of atoms are failing to block the layers beneath, i.e. that the surface has been reconstructed. Relaxations can be detected by a similar procedure with the sample tilted so the ion beam is incident at an angle selected so that first-layer atoms should block backscattering at a diagonal; that is, from atoms which are below and displaced from the blocking atom. A higher-than-expected backscattered yield will indicate that the first layer has been displaced relative to the second layer, or relaxed. Adsorbate materials will be detected by their different composition, changing the position of the surface peak relative to the expected position.
RBS has also been used to measure processes which affect the surface differently from the bulk by analyzing changes in the channeled surface peak. A well-known example of this is the RBS analysis of the premelting of lead surfaces by Frenken, Maree and van der Veen. In an RBS measurement of the Pb(110) surface, a well-defined surface peak which is stable at low temperatures was found to become wider and more intense as temperature increase past two-thirds of the bulk melting temperature. The peak reached the bulk height and width as temperature reached the melting temperature. This increase in the disorder of the surface, making deeper atoms visible to the incident beam, was interpreted as pre-melting of the surface, and computer simulations of the RBS process produced similar results when compared with theoretical pre-melting predictions.[9]
RBS has also been combined with nuclear microscopy, in which a focused ion beam is scanned across a surface in a manner similar to a scanning electron microscope. The energetic analysis of backscattered signals in this kind of application provides compositional information about the surface, while the microprobe itself can be used to examine features such as periodic surface structures.[10]
See also
- Rutherford scattering
- Secondary ion mass spectrometry
- Ion beam analysis
- Nuclear reaction analysis
- Elastic recoil detection
- Particle induced X-ray emission
- Nuclear microscopy
- Surface science
- Stopping power (particle radiation)
- Collision cascade
- Geiger–Marsden experiment
Footnotes
- ↑ Rhodes (1995) pp. 48–49
- 1 2 Oura et al. (2003) p. 110
- ↑ Oura et al. (2003) p. 136
- ↑ EAG Instrumentation Tutorial: http://www.eaglabs.com/training/tutorials/rbs_instrumentation_tutorial/rinstrum.php
- ↑ EAG Instrumentation Tutorial: http://www.eaglabs.com/training/tutorials/rbs_instrumentation_tutorial/rspect.php
- ↑ Oura et al. (2003) p. 114
- ↑ Oura et al. (2003) p. 117
- ↑ Feldman et al. (1982)
- ↑ Frenken et al. (1986)
- ↑ Hobbs et al. (1988)
References
- Rhodes, R. (1995). The Making of the Atomic Bomb. Simon & Schuster. ISBN 978-0-684-81378-3.
- Oura, K.; Lifshits, V.G.; Saranin, A.A.; Zotov, A.V.; et al. (2003). Surface Science: An Introduction. Springer-Verlag. ISBN 3-540-00545-5.
- Feldman, L.C.; Mayer, J.W.; Picraux, S.T. (1982). Materials Analysis by Ion Channeling. Academic Press.
- Feldman, L.C.; Mayer, J.W. (1986). Fundamentals of Surface and Thin Film Analysis. Prentice-Hall.
- "RBS Theory Tutorial". Evans Analytical Group: Training. Retrieved 2007-10-10.
- "RBS Instrumentation Tutorial". Evans Analytical Group: Training. Retrieved 2007-10-10.
- Hobbs, C.P.; McMillan, J.W.; Palmer, D.W. (1988). "The effects of surface topography in nuclear microprobe Rutherford backscattering analysis". Nucl. Inst. And Meth. B. 30 (3): 342–348. Bibcode:1988NIMPB..30..342H. doi:10.1016/0168-583X(88)90023-7.
- Frenken, J.W.M.; Maree, P.M.J.; van der Veen, J.F. (1986). "Observation of surface-initiated melting". Phys. Rev. B. 34 (11): 7506. Bibcode:1986PhRvB..34.7506F. doi:10.1103/PhysRevB.34.7506.