S&P 500 Index
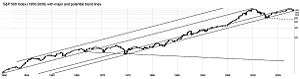
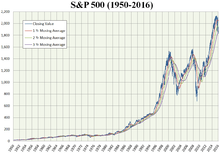 S&P 500 Index from 1950 to 2016 | |
| Foundation | March 4, 1957[1] |
|---|---|
| Operator | S&P Dow Jones Indices[2] |
| Exchanges | NYSE, NASDAQ |
| Constituents | 505[3] |
| Type | Large-cap[2] |
| Market cap |
US$18.5 trillion (as of August 31, 2015)[4] |
| Weighting method | Free-float capitalization-weighted[5] |
| Related indices | |
| Website |
us |
The Standard & Poor's 500, often abbreviated as the S&P 500, or just "the S&P",[6][7] is an American stock market index based on the market capitalizations of 500 large companies having common stock listed on the NYSE or NASDAQ. The S&P 500 index components and their weightings are determined by S&P Dow Jones Indices. It differs from other U.S. stock market indices, such as the Dow Jones Industrial Average or the Nasdaq Composite index, because of its diverse constituency and weighting methodology. It is one of the most commonly followed equity indices, and many consider it one of the best representations of the U.S. stock market, and a bellwether for the U.S. economy.[8] The National Bureau of Economic Research has classified common stocks as a leading indicator of business cycles.[9]
The S&P 500 was developed and continues to be maintained by S&P Dow Jones Indices, a joint venture majority-owned by S&P Global. S&P Dow Jones Indices publishes many stock market indices such as the Dow Jones Industrial Average, S&P MidCap 400, the S&P SmallCap 600, and the S&P Composite 1500. It is a free-float capitalization-weighted index,[5] and has many ticker symbols, such as: ^GSPC,[10] INX,[11] and $SPX.[12]
History
The "Composite Index",[13] as the S&P 500 was first called when it introduced its first stock index in 1923, began tracking a small number of stocks. Three years later in 1926, the Composite Index expanded to 90 stocks and then in 1957 it expanded to its current 500.[13] Standard & Poor's, a company that doles out financial information and analysis, was founded in 1860 by Henry Varnum Poor. In 1941 Poor's Publishing (Henry Varnum Poor's original company) merged with Standard Statistics (founded in 1906 as the Standard Statistics Bureau) and therein assumed the name Standard and Poor's Corporation. The S&P 500 index in its present form began on March 4, 1957. Technology has allowed the index to be calculated and disseminated in real time. The S&P 500 is widely used as a measure of the general level of stock prices, as it includes both growth stocks and value stocks.
In September 1962, Ultronic Systems Corp. entered into an agreement with Standard and Poor's. Under the terms of this agreement, Ultronics computed the S&P 500 Stock Composite Index, the 425 Stock Industrial Index, the 50 Stock Utility Index, and the 25 Stock Rail Index. Throughout the market day these statistics were furnished to Standard & Poor's. In addition, Ultronics also computed and reported the 94 S&P sub-indexes.[14]
Price history
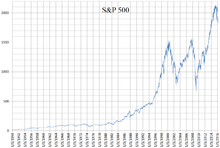
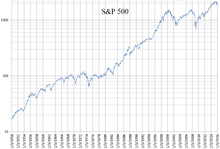
On August 12, 1982, the index closed at 102.42.
The index reached a relative intraday high—which was not exceeded for over seven years—of 1,552.87, on March 24, 2000, during the dot-com bubble. The index then declined by approximately 50%, to 768.63, on October 10, 2002, during the stock market downturn of 2002.[15] On May 30, 2007, the S&P 500 closed at 1,530.23, to set its first all-time closing high in more than seven years. Although the index achieved a new all-time intraday high on October 11, 2007, at 1,576.09, following a record close of 1,565.15 on October 9, the index finished 2007 at 1,468.36 points—just below its 1999 annual close. Less than a month later, it dropped to 1,400, and would not see similar levels again for five years.
In mid-2007, the subprime mortgage crisis spread to the wider U.S. financial sector. The resulting situation became acute in September 2008, ushering in a period of unusual market volatility, encompassing record 100-point swings in both directions and reaching the highest levels since 1929.[16] On November 20, 2008, the index closed at 752.44, its lowest since early 1997.[17] A modest recovery the following day still left the index down 45.5% for the year. This year-to-date loss was the greatest since 1931, when the broad market declined more than 50%.[18] The index closed the year at 903.25, for a loss of 38.5%.[19] The market continued to decline in early 2009, surrounding the financial crisis of 2008. The index reached a nearly 13-year low, closing at 676.53, on March 9, 2009.
On March 23, 2009, the S&P 500 marked a 20% gain when it hit 822.92.[20] The Dow Jones Industrial Average soon followed.[21] The close for 2009 was 1,115.10, making it the second-best year of the decade.[22] On April 14, 2010 the index broke 1200 closing at 1210.65, but by July 2, 2010 it had closed at 1022.58. On April 29, 2011, the index closed at 1363.61, but it had a sharp drop in August and briefly broke 1100 in October (with the VIX hitting 40). Gains continued despite significant volatility amid electoral and fiscal uncertainty, and the 2012 close of the S&P 500 following QE3 was its third-highest ever, at 1,426.22 points. Many people hated the bull market.[23] On March 28, 2013, it closed above the closing high from 2007.[24] On April 10, 2013, it also closed above the intraday high from 2007.[25]
On May 3, 2013—more than 13 years since its first close above 1,500—the S&P 500 closed above 1,600 for the first time, at 1,614.42. This would be the first of three 100-point milestones in 2013: 1,600 on May 3, 2013;[26] 1,700 on August 1, 2013;[27] and 1,800 on November 22, 2013.[28] The S&P 500 closed out 2013 at a record high, finishing the December 31, 2013, trading day at 1,848.36.[29] On May 23, 2014, the index for the first time closed above 1,900, at 1,900.53.[30] On August 26, 2014, the index closed above 2,000 for the very first time,[31] and on December 22 the S&P 500 climbed to 2078, an all-time high.[32] The index closed on December 29 at 2,090.57 with a closing of 2,058.90 at the end of 2014.[33][34] This was a gain of 85% (in price return, and 105% in total return) for the five years 2010-2014. On February 17, 2015, the index first closed above 2,100, closing at 2,100.34. On February 25, 2015 it reached 2,119.59 during mid-day, and on the following day it closed at record high of 2,115.48.[35] On May 21, 2015, the index closed at 2,130.82, its high point for the year. At the end of 2015, the index closed at 2,043.94, down 0.73% for the year. A period of over a year with no new record highs ended on July 11, 2016 (closing at 2,137.16).[36]
Selection criteria
The components of the S&P 500 are selected by committee. This is similar to the Dow Jones Industrial Average, but different from others such as the Russell 1000, which are strictly rule-based. When considering the eligibility of a new addition, the committee assesses the company's merit using eight primary criteria: market capitalization, liquidity, domicile, public float, sector classification, financial viability, length of time publicly traded and listing exchange.[5]
The committee selects the companies in the S&P 500 so they are representative of the industries in the United States economy. In order to be added to the index, a company must satisfy these liquidity-based size requirements:[5]
- market capitalization is greater than or equal to US$5.3 billion
- annual dollar value traded to float-adjusted market capitalization is greater than 1.0
- minimum monthly trading volume of 250,000 shares in each of the six months leading up to the evaluation date.
The securities must be publicly listed on either the NYSE (including NYSE Arca or NYSE MKT) or NASDAQ (NASDAQ Global Select Market, NASDAQ Select Market or the NASDAQ Capital Market). Securities that are ineligible for inclusion in the index are limited partnerships, master limited partnerships, OTC bulletin board issues, closed-end funds, ETFs, ETNs, royalty trusts, tracking stocks, preferred stock, unit trusts, equity warrants, convertible bonds, investment trusts, ADRs, ADSs and MLP IT units.[5]
The index includes non-U.S. companies (27 as of December 23, 2013), both formerly U.S.-incorporated companies that have re-incorporated outside the United States, as well as firms that have never been incorporated in the United States.
Components
Versions
The "S&P 500" generally quoted is a price return index; there are also "total return" and "net total return" versions of the index. These versions differ in how dividends are accounted for. The price return version does not account for dividends; it only captures the changes in the prices of the index components. The total return version reflects the effects of dividend reinvestment. Finally, the net total return version reflects the effects of dividend reinvestment after the deduction of withholding tax.[37][38]
Weighting
The index has traditionally been capitalization-weighted; that is, movements in the prices of stocks with higher market capitalizations (the share price times the number of shares outstanding) have a greater impact on the value of the index than do companies with smaller market caps. That is, Standard & Poor's now calculates the market capitalization of each company relevant to the index using only the number of shares available for public trading (called the "float"). This transition was made in two steps, the first on March 18, 2005 and the second on September 16, 2005.[39]
Index maintenance
In order to keep the S&P 500 Index consistent over time, it is adjusted to capture corporate actions which affect market capitalization, such as additional share issuance, dividends and restructuring events such as mergers or spin-offs. Additionally, to remain indicative of the U.S. stock market, the constituent stocks are changed from time to time.[5] Between January 1, 2005 and January 1, 2015, 188 index components were replaced by other components.[40]
To prevent the value of the Index from changing merely as a result of corporate financial actions, all such actions affecting the market value of the Index require a divisor adjustment. Also, when a company is dropped and replaced by another with a different market capitalization, the divisor needs to be adjusted in such a way that the value of the S&P 500 Index remains constant. All divisor adjustments are made after the close of trading and after the calculation of the closing value of the S&P 500 Index. There is a large range of different corporate actions that can require the divisor to be adjusted. These are listed in the table below:[41]
| Type of Action | Divisor Adjustment |
|---|---|
| Stock split (e.g., 2×1) | No |
| Share issuance | Yes |
| Share repurchase | Yes |
| Special cash dividend | Yes |
| Company change | Yes |
| Rights offering | Yes |
| Spinoffs | Yes |
| Mergers | Yes |
Calculation
To calculate the value of the S&P 500 Index, the sum of the adjusted market capitalization of all 500 stocks is divided by a factor, usually referred to as the Divisor.[41][42] For example, if the total adjusted market cap of the 500 component stocks is US$13 trillion and the Divisor is set at 8.933 billion, then the S&P 500 Index value would be 1,455.28. Although the adjusted market capitalization of the entire index can be accessed from Standard & Poor's website,[43] the Divisor is considered to be proprietary to the firm. However, the Divisor's value is approximately 8.9 billion.[44]
The formula to calculate the S&P 500 Index value is:

where P is the price of each stock in the index and Q is the number of shares publicly available for each stock.
The divisor is adjusted in the case of stock issuance, spin-offs or similar structural changes, to ensure that such events do not in themselves alter the numerical value of the Index.[41]
Update frequency
The index value is updated every 15 seconds during trading sessions and is disseminated by Reuters America, Inc., a subsidiary of Thomson Reuters Corporation.[45]
Investing
Many index funds and exchange-traded funds attempt to replicate (before fees and expenses) the performance of the S&P 500 by holding the same stocks as the index, in the same proportions. Many other mutual funds are benchmarked to the S&P 500. Consequently, a company whose stock is added to the list of S&P 500 stocks may see its stock price rise, as index funds must purchase that company's stock in order to continue tracking the S&P 500 index. Mutual fund managers provide index funds that track the S&P 500, the first of which was The Vanguard Group's Vanguard 500 in 1976.[46]
In addition to investing in a mutual fund indexed to the S&P 500, investors may also purchase shares of an exchange-traded fund (ETF) which represents ownership in a portfolio of the equity securities that comprise the Standard & Poor's 500 Index. These exchange-traded funds track the S&P 500 index and may be used to trade the index. Some S&P 500 index ETFs are listed in the United States as follows:[47]
| ETF Symbol | ETF Name | Fees, per year |
|---|---|---|
| IVV | iShares Core S&P 500 | 4 bps |
| SPY | SPDR S&P 500 | 11 bps |
| VOO | Vanguard S&P 500 | 5 bps |
S&P 500 index ETFs are also available in the United Kingdom, e.g., iShares S&P 500 (LSE: IUSA) and Vanguard S&P 500 (LSE: VUSA), as well as in Japan (TYO: 1547) and in Hong Kong (SEHK: 3140).
Investors may also invest in all the stocks of the S&P 500 directly, which is usually called index replication.
In the derivatives market, the Chicago Mercantile Exchange (CME) offers futures contracts (ticker symbols /SP for the full-sized contract and /ES for the E-mini contract that is one-fifth the size of /SP) that track the index and trade on the exchange floor in an open outcry auction, or on CME's Globex platform, and are the exchange's most popular product. Additionally, the Chicago Board Options Exchange (CBOE) offers options on the S&P 500 as well as S&P 500 ETFs, inverse ETFs and leveraged ETFs.
Market statistics
Milestones
On October 11, 2007, S&P index set a milestone with its all-time intraday high of 1,576.09.[48] On March 28, 2013, the S&P finally surpassed its closing high level of 1,565.15, recovering all its losses from the financial crisis.[48] On March 2, 2015, the S&P finally closed at a new all-time inflation-adjusted closing high, though it has yet to achieve a new all-time inflation-adjusted intraday high, both of which were set back in 2000.[49][50]
Annual returns
(total return) Calculation used for CAGR (Compound Annual Growth Rate, Annualized Return):
CAGR = ((Ending Value)/(Starting Value))∧(1/ (# of years)) - 1
The current CAGR is calculated at 10.47%.
| Year | Change in Index | Total Annual Return Including Dividends | Value of $1.00 Invested on 1970‑01‑01 | 5 Year Annualized Return | 10 Year Annualized Return | 15 Year Annualized Return | 20 Year Annualized Return | 25 Year Annualized Return |
|---|---|---|---|---|---|---|---|---|
| 1970 | 0.10% | 4.01% | $1.04 | - | - | - | - | - |
| 1971 | 10.79% | 14.31% | $1.19 | - | - | - | - | - |
| 1972 | 15.63% | 18.98% | $1.41 | - | - | - | - | - |
| 1973 | −17.37% | −14.66% | $1.21 | - | - | - | - | - |
| 1974 | −29.72% | −26.47% | $0.89 | −2.35% | - | - | - | - |
| 1975 | 31.55% | 37.20% | $1.22 | 3.21% | - | - | - | - |
| 1976 | 19.15% | 23.84% | $1.51 | 4.87% | - | - | - | - |
| 1977 | −11.50% | −7.18% | $1.40 | −0.21% | - | - | - | - |
| 1978 | 1.06% | 6.56% | $1.49 | 4.32% | - | - | - | - |
| 1979 | 12.31% | 18.44% | $1.77 | 14.76% | 5.86% | - | - | - |
| 1980 | 25.77% | 32.50% | $2.34 | 13.96% | 8.45% | - | - | - |
| 1981 | −9.73% | −4.92% | $2.23 | 8.10% | 6.47% | - | - | - |
| 1982 | 14.76% | 21.55% | $2.71 | 14.09% | 6.70% | - | - | - |
| 1983 | 17.27% | 22.56% | $3.32 | 17.32% | 10.63% | - | - | - |
| 1984 | 1.40% | 6.27% | $3.52 | 14.81% | 14.78% | 8.76% | - | - |
| 1985 | 26.33% | 31.73% | $4.64 | 14.67% | 14.32% | 10.49% | - | - |
| 1986 | 14.62% | 18.67% | $5.51 | 19.87% | 13.83% | 10.76% | - | - |
| 1987 | 2.03% | 5.25% | $5.80 | 16.47% | 15.27% | 9.86% | - | - |
| 1988 | 12.40% | 16.61% | $6.76 | 15.31% | 16.31% | 12.17% | - | - |
| 1989 | 27.25% | 31.69% | $8.90 | 20.37% | 17.55% | 16.61% | 11.55% | - |
| 1990 | −6.56% | −3.10% | $8.63 | 13.20% | 13.93% | 13.94% | 11.16% | - |
| 1991 | 26.31% | 30.47% | $11.26 | 15.36% | 17.59% | 14.34% | 11.90% | - |
| 1992 | 4.46% | 7.62% | $12.11 | 15.88% | 16.17% | 15.47% | 11.34% | - |
| 1993 | 7.06% | 10.08% | $13.33 | 14.55% | 14.93% | 15.72% | 12.76% | - |
| 1994 | −1.54% | 1.32% | $13.51 | 8.70% | 14.38% | 14.52% | 14.58% | 10.98% |
| 1995 | 34.11% | 37.58% | $18.59 | 16.59% | 14.88% | 14.81% | 14.60% | 12.22% |
| 1996 | 20.26% | 22.96% | $22.86 | 15.22% | 15.29% | 16.80% | 14.56% | 12.55% |
| 1997 | 31.01% | 33.36% | $30.48 | 20.27% | 18.05% | 17.52% | 16.65% | 13.07% |
| 1998 | 26.67% | 28.58% | $39.19 | 24.06% | 19.21% | 17.90% | 17.75% | 14.94% |
| 1999 | 19.53% | 21.04% | $47.44 | 28.56% | 18.21% | 18.93% | 17.88% | 17.25% |
| 2000 | −10.14% | −9.10% | $43.12 | 18.33% | 17.46% | 16.02% | 15.68% | 15.34% |
| 2001 | −13.04% | −11.89% | $37.99 | 10.70% | 12.94% | 13.74% | 15.24% | 13.78% |
| 2002 | −23.37% | −22.10% | $29.60 | −0.59% | 9.34% | 11.48% | 12.71% | 12.98% |
| 2003 | 26.38% | 28.68% | $38.09 | −0.57% | 11.07% | 12.22% | 12.98% | 13.84% |
| 2004 | 8.99% | 10.88% | $42.23 | −2.30% | 12.07% | 10.94% | 13.22% | 13.54% |
| 2005 | 3.00% | 4.91% | $44.30 | 0.54% | 9.07% | 11.52% | 11.94% | 12.48% |
| 2006 | 13.62% | 15.79% | $51.30 | 6.19% | 8.42% | 10.64% | 11.80% | 13.37% |
| 2007 | 3.53% | 5.49% | $54.12 | 12.83% | 5.91% | 10.49% | 11.82% | 12.73% |
| 2008 | −38.49% | −37.00% | $34.09 | −2.19% | −1.38% | 6.46% | 8.43% | 9.77% |
| 2009 | 23.45% | 26.46% | $43.11 | 0.42% | −0.95% | 8.04% | 8.21% | 10.54% |
| 2010 | 12.78% | 15.06% | $49.61 | 2.29% | 1.41% | 6.76% | 9.14% | 9.94% |
| 2011 | 0.00% | 2.11% | $50.65 | −0.25% | 2.92% | 5.45% | 7.81% | 9.28% |
| 2012 | 13.41% | 16.00% | $58.76 | 1.66% | 7.10% | 4.47% | 8.22% | 9.71% |
| 2013 | 29.60% | 32.39% | $77.79 | 17.94% | 7.40% | 4.68% | 9.22% | 10.27% |
| 2014 | 11.39% | 13.69% | $88.43 | 15.45% | 7.67% | 4.24% | 9.85% | 9.62% |
| 2015 | −0.73% | 1.38% | $89.65 | 12.56% | 7.30% | 5.00% | 8.18% | 9.81% |
| High | 34.11% | 37.58% | $89.65 | 28.56% | 19.21% | 18.93% | 17.88% | 17.25% |
| Low | −38.47% | −37.00% | $0.89 | −2.35% | −1.38% | 4.24% | 7.81% | 9.28% |
| Median | 12.64% | 15.79% | $12.11 | 13.96% | 13.83% | 12.22% | 11.92% | 12.98% |
| Year | Change in Index | Total Annual Return Including Dividends | Value of $1.00 Invested on 1970‑01‑01 | 5 Year Annualized Return | 10 Year Annualized Return | 15 Year Annualized Return | 20 Year Annualized Return | 25 Year Annualized Return |
See also
References
- ↑ "S&P 500 factsheet" (PDF). Standard & Poor's. Retrieved January 20, 2013.
- 1 2 "S&P 500 Overview". S&P/Dow Jones Indices LLC. Retrieved January 20, 2013.
- ↑ https://www.spice-indices.com/idpfiles/spice-assets/resources/public/documents/103766_multidiscovery1.pdf
- ↑ http://us.spindices.com/idsenhancedfactsheet/file.pdf?calcFrequency=M&force_download=true&hostIdentifier=48190c8c-42c4-46af-8d1a-0cd5db894797&indexId=340
- 1 2 3 4 5 6 "S&P U.S. Indices Methodology" (PDF). Standard & Poor's. Retrieved May 14, 2016.
- ↑ The S&P is up 9% this month, Marketwatch, 30 October 2015
- ↑ The S&P is Flat for the Year, and that Usually Leads to Huge Moves, Daily FX, 28 December 2015
- ↑ "Standard & Poor's 500 Index - S&P 500". Investopedia. Retrieved June 11, 2012.
- ↑ Edward Renshaw, The Stock Market, Oil Price Shocks, Economic Recessions and the Business Cycle With An Emphasis on Forecasting, December 2002
- ↑ "Yahoo! Finance: ^GSPC". Yahoo!.
- ↑ "Google Finance: .INX". Google.
- ↑ "S&P 500 Index Quote". MarketWatch. Retrieved February 9, 2016.
- 1 2 http://www.britannica.com/topic/SandP-500
- ↑ Ultronic Systems Corp. Annual Report 1964
- ↑ "New High For S&P 500 - JOI News | ETF.com". ETF.com.
- ↑ "S&P 500 actual volatility at highest since 1929". FinanzNachrichten.de. November 21, 2008. Retrieved May 27, 2015.
- ↑ Stocks Plunge, Leaving Dow Below 7600
- ↑ Sommer, Jeff (November 23, 2008). "A Friday Rally Can't Save the Week". The New York Times.
- ↑ "CNNMoney.com Market Report - Dec. 31, 2008".
- ↑ "U.S. Stocks Jump, Capping S&P 500's Best 10-Day Gain Since 1938". Retrieved May 27, 2015.
- ↑ Peter Mckay, Geoffrey Rogow and Rob Curran (March 26, 2009). "Stocks' Momentum Keeps Building". The Wall Street Journal. Retrieved April 4, 2013.
- ↑ Wall St closes out '09 with best gains since 2003 Reuters
- ↑ Lara Hoffmans (August 17, 2012). "The Most Hated Bull Market Ever". Forbes. Retrieved May 27, 2015.
- ↑ "S&P 500 Closes At All-Time High". The Huffington Post. Retrieved May 27, 2015.
- ↑ Maureen Farrell (April 10, 2013). "Dow and S&P 500 close at new record highs". CNNMoney. Retrieved May 27, 2015.
- ↑ Dow tops 15,000 on jobs report - May. 3, 2013 CNN
- ↑ CWS Market Review – August 2, 2013 Crossing Wall Street Crossing Wall Street
- ↑ "Stocks: Bulls continue record run - Nov. 22, 2013".
- ↑ Adam Shell, USA TODAY (December 31, 2013). "Stock market ends 2013 on a new "high" note". USA TODAY. Retrieved May 27, 2015.
- ↑ "S&P 500 ends at record on housing, HP; transports fly".
- ↑ "S&P 500 closes above 2,000 for first time - Southtown Star".
- ↑ "Stocks Consolidate as S&P 500 Reaches New High".
- ↑ Stock Market News for December 30, 2014 Zacks
- ↑ U.S. stocks finish solid year on a down note MarketWatch
- ↑ "S&P, edge down with Apple; Dow ends at record high".
- ↑ Reuters (July 11, 2016). Strong economy, earnings bets propel S&P 500 to record high.
- ↑ "S&P - Indices > Equity Indices - S&P 500 - Index Table". standardandpoors.com.
- ↑ "Description". standardandpoors.com.
- ↑ "Standard & Poor's Announces Changes to U.S. Investable Weight Factors and Final Float Transition Schedule". PRNewswire. March 9, 2005. Retrieved January 20, 2013.
- ↑ MarketCapitalizations.com "Changes in S&P 500 components during the past ten years", March 25, 2015.
- 1 2 3 "S&P Indices Index Mathematics Methodology" (PDF). The McGraw-Hill Companies, Inc. Retrieved January 20, 2013.
- ↑ http://www.spindices.com/documents/index-policies/methodology-index-math.pdf S&P Dow Jones Index Mathematics Methodology (March 2014) PG. 6
- ↑ "S&P 500 Details". Standard & Poor's. Retrieved January 20, 2013.
- ↑ "How is the value of the S&P 500 calculated?". Retrieved January 20, 2013.
- ↑ "S&P Indices" (PDF).
- ↑ "Investopedia Vanguard Profile".
- ↑ "S&P 500 ETFs".
- 1 2 Park, JeeYeon. "Record-Smashing Quarter: S&P 500 Ends Above 2007's Record Close, Dow Posts Best Q1 Since 1998". CNBC.com Writer. Retrieved March 28, 2013.
- ↑ "CPI Inflation Calculator". Retrieved September 13, 2015.
- ↑ "CPI Inflation Calculator". Retrieved September 13, 2015.
External links
- Official website
- Yahoo! Finance page for ^GSPC
- Reuters page for .SPX
- CNN Money page for SPX
- Bloomberg page for SPX:IND
- Interactive Historical Chart of the S&P 500 Since 1927
- Historical total market capitalization of S&P 500 index