Saarland state election, 2009
Saarland state election, 2009

|
|
|
|
All 51 seats of the Landtag of Saarland
26 seats needed for a majority |
| |
First party |
Second party |
Third party |
| |
 |
 |
_in_Hamm_(10571425525).jpg) |
| Leader |
Peter Müller |
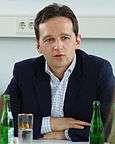
Heiko Maas |
Oskar Lafontaine |
| Party |
CDU |
SPD |
Left |
| Last election |
27 seats, 47.5% |
18 seats, 30.8% |
0 seats, 2.3%[1] |
| Seats before |
27 |
18 |
1 |
| Seats won |
19 |
13 |
11 |
| Seat change |
 8 8 |
 5 5 |
 10 10 |
| Percentage |
34.5% |
24.5% |
21.5% |
| Swing |
 13.0% 13.0% |
 6.3% 6.3% |
 19.2% 19.2% |
|
| |
Fourth party |
Fifth party |
| |
 |
 |
| Leader |
Christoph Hartmann |
Hubert Ulrich |
| Party |
FDP |
Green |
| Last election |
3 seats, 5.2% |
3 seats, 5.6% |
| Seats before |
3 |
2 |
| Seats won |
5 |
3 |
| Seat change |
 2 2 |
 1 1 |
| Percentage |
9.2% |
5.9% |
| Swing |
 4.0% 4.0% |
 0.3% 0.3% |
|
|
|
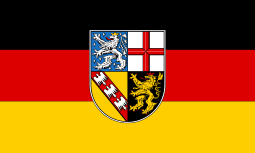
State elections were held in Saarland on 30 August 2009, the same date as the Saxony and Thuringia state elections. The election decided control of the Landtag of Saarland (Saarland's parliament).
Results
Significant losses by the CDU Christian Democratic Union (CDU) and SPD were matched by a substantial rise in the Left vote and smaller rises for the Greens and Free Democratic Party (FDP). Neither the Black–Yellow (center-right) nor Red–Red (center-left/left) coalitions won enough seats for an absolute majority to elect a Minister-President and form a government. As a result, the Greens held the balance of power. In the end, the Greens chose to support a "Jamaica coalition" (named after the color combination of the Jamaican flag - black, yellow and green) of the CDU, FDP, and Greens, with Peter Müller (CDU) continuing as Minister-President.[2]
Prior election
Minister-President Peter Müller of the CDU won a second term in the previous election. He and his party won an absolute majority of 27 out of 51 seats.
Parties
The following parties are contesting the election:
Opinion polling
The following opinion polls have been conducted during the campaign:[3]
| Pollster |
Date |
CDU |
SPD |
Green |
FDP |
The Left |
Family |
Other |
|---|
| Forschungs-gruppe Wahlen |
21 Aug 2009 |
36 |
26 |
6 |
9 |
16 |
– |
7 |
| Infratest dimap |
20 Aug 2009 |
38 |
26 |
6 |
9 |
15 |
3 |
3 |
| Infratest dimap |
22 April 2009 |
36 |
27 |
7 |
9 |
18 |
– |
3 |
| Emnid |
16 April 2009 |
38 |
23 |
5 |
8 |
22 |
– |
4 |
| Infratest dimap |
28 Oct 2008 |
38 |
25 |
5 |
6 |
23 |
– |
3 |
| Forsa |
3 Sept 2008 |
37 |
23 |
5 |
7 |
24 |
– |
4 |
References


_in_Hamm_(10571425525).jpg)

