Sampling bias
In statistics, sampling bias is a bias in which a sample is collected in such a way that some members of the intended population are less likely to be included than others. It results in a biased sample, a non-random sample[1] of a population (or non-human factors) in which all individuals, or instances, were not equally likely to have been selected.[2] If this is not accounted for, results can be erroneously attributed to the phenomenon under study rather than to the method of sampling.
Medical sources sometimes refer to sampling bias as ascertainment bias.[3][4] Ascertainment bias has basically the same definition,[5][6] but is still sometimes classified as a separate type of bias.[5]
Distinction from selection bias
Sampling bias is mostly classified as a subtype of selection bias,[7] sometimes specifically termed sample selection bias,[8][9][10] but some classify it as a separate type of bias.[11] A distinction, albeit not universally accepted, of sampling bias is that it undermines the external validity of a test (the ability of its results to be generalized to the rest of the population), while selection bias mainly addresses internal validity for differences or similarities found in the sample at hand. In this sense, errors occurring in the process of gathering the sample or cohort cause sampling bias, while errors in any process thereafter cause selection bias.
However, selection bias and sampling bias are often used synonymously.[12]
Types of sampling bias
- Selection from a specific real area. For example, a survey of high school students to measure teenage use of illegal drugs will be a biased sample because it does not include home-schooled students or dropouts. A sample is also biased if certain members are underrepresented or overrepresented relative to others in the population. For example, a "man on the street" interview which selects people who walk by a certain location is going to have an overrepresentation of healthy individuals who are more likely to be out of the home than individuals with a chronic illness. This may be an extreme form of biased sampling, because certain members of the population are totally excluded from the sample (that is, they have zero probability of being selected).
- Self-selection bias (see also Non-response bias), which is possible whenever the group of people being studied has any form of control over whether to participate (as current standards of human-subject research ethics require for many real-time and some longitudinal forms of study). Participants' decision to participate may be correlated with traits that affect the study, making the participants a non-representative sample. For example, people who have strong opinions or substantial knowledge may be more willing to spend time answering a survey than those who do not. Another example is online and phone-in polls, which are biased samples because the respondents are self-selected. Those individuals who are highly motivated to respond, typically individuals who have strong opinions, are overrepresented, and individuals that are indifferent or apathetic are less likely to respond. This often leads to a polarization of responses with extreme perspectives being given a disproportionate weight in the summary. As a result, these types of polls are regarded as unscientific.
- Pre-screening of trial participants, or advertising for volunteers within particular groups. For example, a study to "prove" that smoking does not affect fitness might recruit at the local fitness center, but advertise for smokers during the advanced aerobics class, and for non-smokers during the weight loss sessions.
- Exclusion bias results from exclusion of particular groups from the sample, e.g. exclusion of subjects who have recently migrated into the study area (this may occur when newcomers are not available in a register used to identify the source population). Excluding subjects who move out of the study area during follow-up is rather equivalent of dropout or nonresponse, a selection bias in that it rather affects the internal validity of the study.
- Healthy user bias, when the study population is likely healthier than the general population, e.g. workers (i.e. someone in ill-health is unlikely to have a job as manual laborer).
- Berkson's fallacy, when the study population is selected from a hospital and so is less healthy than the general population. This can result in a spurious negative correlation between diseases: a hospital patient without diabetes is more likely to have another given disease such as cholecystis, since they must have had some reason to enter the hospital in the first place.
- Overmatching, matching for an apparent confounder that actually is a result of the exposure. The control group becomes more similar to the cases in regard to exposure than the general population.
- Survivorship bias, in which only "surviving" subjects are selected, ignoring those that fell out of view. For example, using the record of current companies as an indicator of business climate or economy ignores the businesses that failed and no longer exist.
Symptom-based sampling
The study of medical conditions begins with anecdotal reports. By their nature, such reports only include those referred for diagnosis and treatment. A child who can't function in school is more likely to be diagnosed with dyslexia than a child who struggles but passes. A child examined for one condition is more likely to be tested for and diagnosed with other conditions, skewing comorbidity statistics. As certain diagnoses become associated with behavior problems or intellectual disability, parents try to prevent their children from being stigmatized with those diagnoses, introducing further bias. Studies carefully selected from whole populations are showing that many conditions are much more common and usually much milder than formerly believed.
Truncate selection in pedigree studies
Geneticists are limited in how they can obtain data from human populations. As an example, consider a human characteristic. We are interested in deciding if the characteristic is inherited as a simple Mendelian trait. Following the laws of Mendelian inheritance, if the parents in a family do not have the characteristic, but carry the allele for it, they are carriers (e.g. a non-expressive heterozygote). In this case their children will each have a 25% chance of showing the characteristic. The problem arises because we can't tell which families have both parents as carriers (heterozygous) unless they have a child who exhibits the characteristic. The description follows the textbook by Sutton.[13]
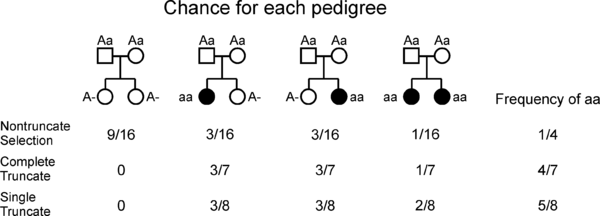
The figure shows the pedigrees of all the possible families with two children when the parents are carriers (Aa).
- Nontruncate selection. In a perfect world we should be able to discover all such families with a gene including those who are simply carriers. In this situation the analysis would be free from ascertainment bias and the pedigrees would be under "nontruncate selection" In practice, most studies identify, and include, families in a study based upon them having affected individuals.
- Truncate selection. When afflicted individuals have an equal chance of being included in a study this is called truncate selection, signifying the inadvertent exclusion (truncation) of families who are carriers for a gene. Because selection is performed on the individual level, families with two or more affected children would have a higher probability of becoming included in the study.
- Complete truncate selection is a special case where each family with an affected child has an equal chance of being selected for the study.
The probabilities of each of the families being selected is given in the figure, with the sample frequency of affected children also given. In this simple case, the researcher will look for a frequency of 4⁄7 or 5⁄8 for the characteristic, depending on the type of truncate selection used.
The caveman effect
An example of selection bias is called the "caveman effect". Much of our understanding of prehistoric peoples comes from caves, such as cave paintings made nearly 40,000 years ago. If there had been contemporary paintings on trees, animal skins or hillsides, they would have been washed away long ago. Similarly, evidence of fire pits, middens, burial sites, etc. are most likely to remain intact to the modern era in caves. Prehistoric people are associated with caves because that is where the data still exists, not necessarily because most of them lived in caves for most of their lives.
Problems caused by sampling bias
A biased sample causes problems because any statistic computed from that sample has the potential to be consistently erroneous. The bias can lead to an over- or under-estimation of the corresponding parameter in the population. Almost every sample in practice is biased because it is practically impossible to ensure a perfectly random sample. If the degree of misrepresentation is small, the sample can be treated as a reasonable approximation to a random sample. Also, if the sample does not differ markedly in the quantity being measured, then a biased sample can still be a reasonable approximation.
The word bias has a strong negative connotation. Indeed, biases sometimes come from deliberate intent to mislead or other scientific fraud. In statistical usage, bias merely represents a mathematical property, no matter if it is deliberate or either unconscious or due to imperfections in the instruments used for observation. While some individuals might deliberately use a biased sample to produce misleading results, more often, a biased sample is just a reflection of the difficulty in obtaining a truly representative sample, or ignorance of the bias in their process of measurement or analysis. An example of how ignorance of a bias can exist is in the widespread use of a ratio (a.k.a. 'fold change) as a measure of difference in biology. Because it is easier to achieve a large ratio with two small numbers with a given difference, and relatively more difficult to achieve a large ratio with two large numbers with a larger difference, large a significant differences may be missed when comparing relatively large numeric measurements. Some have called this a 'demarcation bias' because the use of a ratio (division) instead of a difference (subtraction) removes the results of the analysis from science into pseudoscience (See Demarcation Problem).
Some samples use a biased statistical design which nevertheless allows the estimation of parameters. The U.S. National Center for Health Statistics, for example, deliberately oversamples from minority populations in many of its nationwide surveys in order to gain sufficient precision for estimates within these groups.[14] These surveys require the use of sample weights (see later on) to produce proper estimates across all ethnic groups. Provided that certain conditions are met (chiefly that the weights are calculated and used correctly) these samples permit accurate estimation of population parameters.
Historical examples
A classic example of a biased sample and the misleading results it produced occurred in 1936. In the early days of opinion polling, the American Literary Digest magazine collected over two million postal surveys and predicted that the Republican candidate in the U.S. presidential election, Alf Landon, would beat the incumbent president, Franklin Roosevelt, by a large margin. The result was the exact opposite. The Literary Digest survey represented a sample collected from readers of the magazine, supplemented by records of registered automobile owners and telephone users. This sample included an over-representation of individuals who were rich, who, as a group, were more likely to vote for the Republican candidate. In contrast, a poll of only 50 thousand citizens selected by George Gallup's organization successfully predicted the result, leading to the popularity of the Gallup poll.
Another classic example occurred in the 1948 presidential election. On election night, the Chicago Tribune printed the headline DEWEY DEFEATS TRUMAN, which turned out to be mistaken. In the morning the grinning president-elect, Harry S. Truman, was photographed holding a newspaper bearing this headline. The reason the Tribune was mistaken is that their editor trusted the results of a phone survey. Survey research was then in its infancy, and few academics realized that a sample of telephone users was not representative of the general population. Telephones were not yet widespread, and those who had them tended to be prosperous and have stable addresses. (In many cities, the Bell System telephone directory contained the same names as the Social Register.) In addition, the Gallup poll that the Tribune based its headline on was over two weeks old at the time of the printing.[16]
Statistical corrections for a biased sample
If entire segments of the population are excluded from a sample, then there are no adjustments that can produce estimates that are representative of the entire population. But if some groups are underrepresented and the degree of underrepresentation can be quantified, then sample weights can correct the bias. However, the success of the correction is limited to the selection model chosen. If certain variables are missing the methods used to correct the bias could be inaccurate.[17]
For example, a hypothetical population might include 10 million men and 10 million women. Suppose that a biased sample of 100 patients included 20 men and 80 women. A researcher could correct for this imbalance by attaching a weight of 2.5 for each male and 0.625 for each female. This would adjust any estimates to achieve the same expected value as a sample that included exactly 50 men and 50 women, unless men and women differed in their likelihood of taking part in the survey.
See also
- Selection bias
- Cherry picking (fallacy)
- File drawer problem
- Friendship paradox
- Reporting bias
- Spectrum bias
- Censored regression model
- Truncated regression model
References
- ↑ Medical Dictionary - 'Sampling Bias' Retrieved on September 23, 2009
- ↑ TheFreeDictionary – biased sample Retrieved on 2009-09-23. Site in turn cites: Mosby's Medical Dictionary, 8th edition.
- ↑ Weising, Kurt (2005). DNA fingerprinting in plants: principles, methods, and applications. London: Taylor & Francis Group. p. 180. ISBN 0-8493-1488-7.
- ↑ Page 34 in: Selection and linkage desequilibrium tests under complex demographies and ascertainment bias Francesc Calafell i Majó, Anna Ramírez i Soriano. July 2008
- 1 2 Panacek: Error in research Society for Academic Emergency Medicine. Retrieved on November 14, 2009
- ↑ medilexicon Medical Dictionary - 'Ascertainment Bias' Retrieved on November 14, 2009
- ↑ Dictionary of Cancer Terms – Selection Bias Retrieved on September 23, 2009
- ↑ Ards, Sheila; Chung, Chanjin; Myers, Samuel L. (1998). "The effects of sample selection bias on racial differences in child abuse reporting". Child Abuse & Neglect. 22 (2): 103–115. doi:10.1016/S0145-2134(97)00131-2. PMID 9504213.
- ↑ Cortes, Corinna; Mohri, Mehryar; Riley, Michael; Rostamizadeh, Afshin (2008). "Sample Selection Bias Correction Theory" (PDF). Algorithmic Learning Theory. 5254: 38–53. doi:10.1007/978-3-540-87987-9_8.
- ↑ Cortes, Corinna; Mohri, Mehryar (2014). "Domain adaptation and sample bias correction theory and algorithm for regression" (PDF). Theoretical Computer Science. 519: 103–126. doi:10.1016/j.tcs.2013.09.027.
- ↑ Fadem, Barbara (2009). Behavioral Science. Lippincott Williams & Wilkins. p. 262. ISBN 978-0-7817-8257-9.
- ↑ Wallace, Robert (2007). Maxcy-Rosenau-Last Public Health and Preventive Medicine (15th ed.). McGraw Hill Professional. p. 21. ISBN 978-0-07-159318-2.
- ↑ Sutton, Harry Eldon (1988). An Introduction to Human Genetics (4th ed.). Harcourt Brace Jovanovich. ISBN 978-0-15-540099-3.
- ↑ National Center for Health Statistics (2007). Minority Health.
- ↑ "Browser Statistics". Refsnes Data. June 2008. Retrieved 2008-07-05.
- ↑ Based on http://www.uh.edu/engines/epi1199.htm retrieved on September 29, 2007
- ↑ Cuddeback, Gary; Wilson, Orme,Combs-Orme (2004). "Detecting and Statistically Correcting Sample Selection Bias" (PDF). Journal of Social Service Research. The Haworth Press, Inc. 30 (3). doi:10.1300/J079v30n03_02. Retrieved 2016-09-20.
| Correlative-based fallacies | |
|---|---|
| Fallacies of illicit transference | |
| Deductive fallacies | |
| Inductive fallacies | |
| Questionable cause | |
| Vagueness / ambiguity | |
| Equivocation | |
| Question-begging fallacies | |
| |