Demographics of Senegal
This article is about the demographic features of the population of Senegal, including population density, ethnicity, education level, health of the populace, economic status, religious affiliations and other aspects of the population.
About 70% of Senegal's population is rural. In rural areas, population density varies from about 77 per square kilometer (200/mile²) in the west-central region to 2 per square kilometer (5/mile²) in the arid eastern section. About 50,000 Europeans (mostly French) and Lebanese and Vietnamese reside in Senegal, mainly in the cities. French is the official language but is used regularly only by the literate minority. Almost all Senegalese speak an indigenous language, of which Wolof has the largest usage. Many Senegalese live in Europe, particularly in France, Italy and Spain.
Population
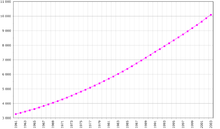
According to the 2010 revision of the World Population Prospects the total population was 12,434,000 in 2010, compared to only 2,416,000 in 1950. The proportion of children below the age of 15 in 2010 was 43.7%, 53.9% was between 15 and 65 years of age, while 2.4% was 65 years or older .[1]
| Total population (x 1000) | Population aged 0–14 (%) | Population aged 15–64 (%) | Population aged 65+ (%) | |
|---|---|---|---|---|
| 1950 | 2,416 | 41.6 | 55.0 | 3.4 |
| 1955 | 2,684 | 41.5 | 55.6 | 2.9 |
| 1960 | 3,048 | 41.9 | 55.5 | 2.6 |
| 1965 | 3,505 | 43.0 | 54.6 | 2.4 |
| 1970 | 4,096 | 44.3 | 53.5 | 2.3 |
| 1975 | 4,786 | 45.3 | 52.5 | 2.2 |
| 1980 | 5,414 | 47.2 | 50.5 | 2.2 |
| 1985 | 6,232 | 47.7 | 50.0 | 2.3 |
| 1990 | 7,242 | 47.2 | 50.4 | 2.4 |
| 1995 | 8,369 | 46.2 | 51.3 | 2.5 |
| 2000 | 9,506 | 45.4 | 52.1 | 2.5 |
| 2005 | 10,872 | 44.4 | 53.1 | 2.5 |
| 2010 | 12,434 | 43.7 | 53.9 | 2.4 |
Vital statistics
Registration of vital events is in Senegal not complete. The Population Departement of the United Nations prepared the following estimates. [1]
| Period | Live births per year | Deaths per year | Natural change per year | CBR* | CDR* | NC* | TFR* | IMR* |
|---|---|---|---|---|---|---|---|---|
| 1950-1955 | 115,000 | 68,000 | 47,000 | 45.2 | 26.8 | 18.4 | 6.05 | 131 |
| 1955-1960 | 137,000 | 73,000 | 64,000 | 47.7 | 25.4 | 22.3 | 6.42 | 128 |
| 1960-1965 | 163,000 | 82,000 | 81,000 | 49.7 | 24.9 | 24.8 | 6.85 | 123 |
| 1965-1970 | 193,000 | 92,000 | 101,000 | 50.8 | 24.2 | 26.6 | 7.25 | 117 |
| 1970-1975 | 224,000 | 100,000 | 125,000 | 50.5 | 22.4 | 28.1 | 7.45 | 108 |
| 1975-1980 | 251,000 | 99,000 | 153,000 | 49.3 | 19.3 | 29.9 | 7.50 | 99 |
| 1980-1985 | 274,000 | 93,000 | 181,000 | 47.1 | 16.0 | 31.0 | 7.28 | 89 |
| 1985-1990 | 303,000 | 92,000 | 211,000 | 45.0 | 13.6 | 31.4 | 6.90 | 80 |
| 1990-1995 | 335,000 | 98,000 | 237,000 | 42.9 | 12.5 | 30.3 | 6.36 | 72 |
| 1995-2000 | 365,000 | 104,000 | 261,000 | 40.8 | 11.6 | 29.2 | 5.77 | 66 |
| 2000-2005 | 405,000 | 108,000 | 297,000 | 39.8 | 10.6 | 29.2 | 5.36 | 60 |
| 2005-2010 | 450,000 | 111,000 | 339,000 | 38.6 | 9.5 | 29.1 | 5.03 | 55 |
| * CBR = crude birth rate (per 1000); CDR = crude death rate (per 1000); NC = natural change (per 1000); IMR = infant mortality rate per 1000 births; TFR = total fertility rate (number of children per woman) | ||||||||
Births and deaths [2]
| Year | Population (x1000) | Live births | Deaths | Natural increase | Crude birth rate | Crude death rate | Rate of natural increase | TFR |
|---|---|---|---|---|---|---|---|---|
| 2009 | 498 714 | 138 182 | 360 532 | 41,0 | 11,4 | 29,6 | 4,91 | |
| 2010 | 456 212 | 132 218 | 323 994 | 36,5 | 10,6 | 25,9 | 4,86 | |
| 2011 | 464 464 | 134 450 | 330 014 | 36,2 | 10,5 | 25,7 | ||
| 2012 | 471 629 | 135 468 | 336 161 | 35,7 | 10,3 | 25,5 | ||
| 2013 | 12 874 | 478 898 | 136 460 | 342 438 | 35,3 | 10,1 | 25,2 | |
Fertility and Births
Total Fertility Rate (TFR) (Wanted Fertility Rate) and Crude Birth Rate (CBR):[3]
| Year | CBR (Total) | TFR (Total) | CBR (Urban) | TFR (Urban) | CBR (Rural) | TFR (Rural) |
|---|---|---|---|---|---|---|
| 1980-82 | 7,4 | 6,3 | 7,9 | |||
| 1983-85 | 6,6 | 5,4 | 7,1 | |||
| 1992-93 | 40,8 | 6,03 (5,1) | 37,4 | 5,06 (3,8) | 42,9 | 6,74 (5,9) |
| 1997 | 37 | 5,67 (4,6) | 31 | 4,29 (3,2) | 42 | 6,74 (5,6) |
| 1999 | 36 | 5,2 | 30 | 3,9 | 40 | 6,1 |
| 2005 | 39,3 | 5,3 (4,5) | 33,4 | 4,1 (3,3) | 44,0 | 6,4 (5,7) |
| 2008-2009 | 37,3 | 4,9 | 33,4 | 4,0 | 40,1 | 5,8 |
| 2010-2011 | 37,4 | 5,0 (3,2) | 32,3 | 3,9 (2,6) | 41,6 | 6,0 (3,8) |
| 2012-2013 | 38,6 | 5,3 | 32,9 | 4,1 | 42,7 | 6,3 |
| 2014 | 37,6 | 5,0 (3,7) | 33,4 | 4,0 (3,1) | 41,6 | 6,3 (4,4) |
| 2015 | 35.7 | 4.9 (4.3) | 28.1 | 3.5 (3.1) | 41.5 | 6.1 (5.4) |
Ethnic groups[4]
- Wolof 38.7%, Pular 26.5%, Serer 15%, Mandinka 4.2%, Jola 4%, Soninke 2.3%, Other 9.3% (includes Europeans and persons of Lebanese descent) (2010-11 est.)
| Ethnic group |
census 1976 [5] | census 1988[6] | ||
|---|---|---|---|---|
| Number | % | Number | % | |
| Wolof | 2,001,416 | 41.0 | 2,890,402 | 42.7 |
| Serer | 716,919 | 14.7 | 1,009,921 | 14.9 |
| Peul | 605,584 | 12.4 | 978,366 | 14.4 |
| Toucouleur | 528,490 | 10.8 | 631,892 | 9.3 |
| Diola | 265,353 | 5.4 | 357,672 | 5.3 |
| Mandingue | 179,050 | 3.7 | 245,651 | 3.6 |
| Soce | 42,751 | 0.6 | ||
| Sarakhole | 84,102 | 1.7 | 113,184 | 1.7 |
| Bambara | 65,096 | 1.3 | 91,071 | 1.3 |
| Maure | 59,784 | 1.2 | 67,726 | 1.0 |
| Mandjaag | 41,628 | 0.9 | 66,605 | 1.0 |
| Lebou | 94,837 | 1.9 | 56,758 | 0.8 |
| Balant | 33,915 | 0.7 | 54,398 | 0.8 |
| Malinke | 202,472 | 4.1 | 28,643 | 0.4 |
| Mancagne | 23,180 | 0.3 | ||
| Laobe | 18,250 | 0.3 | ||
| Bassari | 6,195 | 0.1 | ||
| Khassonke | 1,752 | 0.0 | ||
| Coniagui | 1,119 | 0.0 | ||
| Fula | 108 | 0.0 | ||
| Other | 87,773 | 1.3 | ||
| Total | 4,879,103 | 6,773,417 | ||
Languages
French (official), Wolof, Pulaar, Serer, Jola, Mandinka
Religion[4]
- Islam 95.4% (mostly Sufi)
- Christian 4.2% (mostly Roman Catholic)
- Animist 0.4%
CIA World Factbook demographic statistics
The following demographic statistics are from the CIA World Factbook, unless otherwise indicated.[7]
Gender ratio
- At birth: 1.03 male(s)/female
- Under 15 years: 1.01 male(s)/female
- 15-64 years: 0.98 male(s)/female
- 65 years and over: 0.87 male(s)/females
- Total population: 0.99 male(s)/female (2011 est.)
Life expectancy at birth
Total population
- 59.78 years (2011 est.)
- 59.25 years (2006 est.)
Male
- 57.85 years (2011 est.)
- 57.7 years (2006 est.)
Female
- 61.77 years (2011 est.)
- 60.85 years (2006 est.)
Nationality
noun:
Senegalese (singular and plural)
adjective:
Senegalese
Literacy
Total population: 39.3%
Male: 51.1%
Female: 29.2% (2002 est.)
See also
References
| Wikimedia Commons has media related to Demographics of Senegal. |
- 1 2 Population Division of the Department of Economic and Social Affairs of the United Nations Secretariat, World Population Prospects: The 2010 Revision
- ↑ http://unstats.un.org/unsd/demographic/products/dyb/dyb2.htm
- ↑ http://microdata.worldbank.org/index.php/catalog/dhs#_r=&collection=&country=&dtype=&from=1890&page=14&ps=&sk=&sort_by=nation&sort_order=&to=2014&topic=&view=s&vk=
- 1 2 "Africa :: SENEGAL". CIA The World Factbook.
- ↑ Rapport National de Présentation du Recensement Général de la Population 1976 (RGP I)
- ↑ UN Demographic Yearbooks
- ↑ The World Factbook - Senegal
Serer topics | |||||||||||||||||||||||||
|---|---|---|---|---|---|---|---|---|---|---|---|---|---|---|---|---|---|---|---|---|---|---|---|---|---|
|  | ||||||||||||||||||||||||
|
| |||||||||||||||||||||||||
| |||||||||||||||||||||||||
| |||||||||||||||||||||||||
| |||||||||||||||||||||||||
Years in Senegal (1960–present) | |
|---|---|
|