Shaler Area School District
| Shaler Area School District | |
|---|---|
|
To provide a dynamic learning environment to the communities of Etna, Millvale, Reserve and Shaler. | |
| Location | |
|
1800 Mount Royal Blvd Glenshaw, PA 15116-2117 (North of Pittsburgh) Allegheny County, Pennsylvania United States | |
| District information | |
| Type | Public |
| Grades | K-12 |
| Superintendent | Mr. Alex Dibucci |
| Asst. Superintendent(s) | Dr. Bryan O'Black |
| Budget | |
| Students and staff | |
| Students |
|
| Staff | 261.5 non teaching staff |
| Student-teacher ratio | 12.92 to 1 |
| District mascot | Titan |
| Colors | Navy Blue, White and Red |
| Other information | |
| Per pupil spending |
$12,993 (2008) $14,190.71 (2010) |
| Website |
www |
Shaler Area School District is a large, suburban public school district located in Allegheny County, Pennsylvania. Shaler Area School District encompasses approximately 14 square miles (36 km2), including: Shaler Township, Etna Borough, Millvale Borough, and Reserve Township. According to 2000 federal census data, it served a resident population of 41,565. By 2010, the district's population declined to 39,293 people.[5] In 2009, Shaler Area School District residents’ per capita income was $21,333, while the median family income was $52,135.[6] In the Commonwealth, the median family income was $49,501[7] and the United States median family income was $49,445, in 2010.[8] By 2013, the median household income in the United States rose to $52,100.[9]
Shaler Area School District is experiencing a steady decline in enrollment. Per District officials, there were: 5,467 pupils in 2005-06, 5,367 pupils in 2006-07. For 2007-08, Shaler Area School District provided basic educational services to 5,078 pupils. In 2010, enrollment had again declined to 4970 students.[10] In 2012-13, the enrollment in the District was 4,654 pupils an over 800 students less than in 2005-06.
According to District officials, in school year 2005-06, Shaler Area School District employed: 428 teachers, 136 full-time and part-time support personnel, and 31 administrators. Shaler Area School District received more than $17.1 million in state funding in school year 2005-06. In 2008, Shaler Area District reported employing 429 teachers, 158 full-time and part-time support personnel, and 29 administrators. Shaler Area School District received more than $19.5 million in state funding for the school year 2007-08.[11] In 2011, Shaler Area School District employed 387.5 teachers and another 261.5 staff members including 29 administrators.[12]
Superintendent, Administrators & Principals
The current superintendent of Shaler Area School District is Mr. Sean Aiken. The Central Administration Cabinet members include: Assistant to the Superintendent Dr. Bryan O'Black, Director of Curriculum and Technology Dr. Bryan O'Black and Director of Business Affairs Ms. Sherri L. Ludwig. The High School's Principal is Dr. Timothy Royall, and the Assistant Principals are Ms. Heather Berney, Mr. Thomas Misko, and Mrs. JoAnne Townsend. The Middle School Principal is Mr. Martin Martynuska and the Assistant Principal is Mrs. Shannon Howard. The Shaler Area Elementary School's Principal is Mr. Ian Miller and the Assistant Principals are Ms. Lori Mish and Ms. Venice Piveronas. Burchfield Primary School's Principal is Mr. Jeffrey Rojik. Jeffery Primary School's Principal is Mrs. Kristy Batis. Marzolf Primary School's Principal is Mr. Rick Pelkofer. Reserve Primary School's Principal is Mrs. Eloise Groegler. Rogers Primary School's Principal is Ms. Cynthia Foht.
Schools
There are eight schools in the Shaler Area School District. The schools in order from lowest grade levels to highest are:
- Burchfield Primary (K - 3rd Grade)
- Jefferey Primary (K - 3rd Grade)
- Marzolf Primary (K - 3rd Grade)
- Reserve Primary (K - 3rd Grade)
- Rogers Primary (K - 3rd Grade)
- Shaler Area Upper Elementary (4th - 6th Grade)
- Shaler Area Middle School (7th and 8th Grade)
- Shaler Area High School (9th - 12th Grade)
Academic achievement
Shaler Area School District was ranked 265th out of 498 Pennsylvania school districts in 2013, by the Pittsburgh Business Times. The ranking was based on the last three years of student academic performance on the reading, writing, math and science PSSAs.[13] The PSSAs are given to all children in grades 3rd through 8th and the 11th grade in high school. Adapted examinations are given to children in the special education programs.
- 2012 - 251st
- 2011 - 226th[14]
- 2010 - 217th[15]
- 2009 - 194th[16]
- 2008 - 195th
- 2007 - 200th out of 501 school districts.[17]
- Overachievers Ranking
In 2013, the Pittsburgh Business Times reported an Overachievers Ranking for 498 Pennsylvania school districts. Shaler Area School District ranked 463rd. The editor describes the ranking as: "a ranking answers the question - which school districts do better than expectations based upon economics? This rank takes the Honor Roll rank and adds the percentage of students in the district eligible for free and reduced-price lunch into the formula. A district finishing high on this rank is smashing expectations, and any district above the median point is exceeding expectations."[18]
- 2012 - 441st
- 2011 - 407th
- 2010 - 407th
Western Pennsylvania local ranking Shaler Area School District was ranked 59th out of 104 western Pennsylvania school districts, in 2013, by the Pittsburgh Business Times. The ranking was based on the last three years of student academic performance on the PSSAs on: math, reading, writing and science.[19] (includes 105 districts in: Allegheny County, Armstrong County, Beaver County, Butler County, Fayette County, Washington County and Westmoreland County excludes Duquesne City School District & Midland Borough School District due to no high schools) In 2012 - 60th.
In 2009, the academic achievement of the students of Shaler Area School District was in the 44th percentile among 500 Pennsylvania school districts. Scale - (0-99; 100 is state best)[20]
District AYP status history
In 2012, Shaler Area School District declined to Warning Adequate Yearly Progress (AYP) status due to a sharp decline in its graduation rate.[21] In 2011, Shaler Area School District achieved AYP status. In 2011, 94 percent of the 500 Pennsylvania public school districts achieved the No Child Left Behind Act progress level of 72% of students reading on grade level and 67% of students demonstrating on grade level math. In 2011, 46.9 percent of Pennsylvania school districts achieved Adequate Yearly Progress (AYP) based on student performance. An additional 37.8 percent of Pennsylvania public school districts made AYP based on a calculated method called safe harbor, 8.2 percent on the growth model and 0.8 percent on a two-year average performance.[22] Shaler Area School District achieved AYP status each year from 2006 to 2010, while in 2003 and 2005 the District was in Warning status due to lagging student academic achievement.[23]
Graduation rate
In 2012, the Shaler Area School District graduation rate declined sharply to 88%. In 2011, the graduation rate was 93%.[24] In 2010, the Pennsylvania Department of Education issued a new, 4-year cohort graduation rate. High School's rate was 92% for 2010.[25]
- According to traditional graduation rate calculations
High school
Shaler Area High School is located at 381 Wible Run Road, Pittsburgh, PA. According to the National Center for Education Statistics, in 2010, the school reported an enrollment of 1,810 pupils in grades 9th through 12th, with 359 pupils eligible for a federal free or reduced-price lunch. The school is not a federally designated Title I school. The school employed 124 teachers, yielding a student–teacher ratio of 14:1.[30]
In 2012, Shaler Area High School declined further to Corrective Action II 5th Year due to low student achievement and a low graduation rate.[31] In 2011, Shaler Area High School declined to Corrective Action II 4th Year AYP status due to chronic low student reading and mathematics achievement. In 2010, the school was in Corrective Action II 3rd Year AYP status.[32] Under the federal No Child Left Behind Law, the school administration was required to notify parents of the poor achievement. Additionally, the Pennsylvania Department of Education required the administration to develop a School Improvement Plan to address the chronic low student achievement. In 2011, the school reported that 14 core courses were taught by teachers who were designated "Non‐Highly Qualified Teachers" under NCLB. Sixteen teachers had emergency certification.[33]
In 2012, Shaler Area High School was ranked 63rd out of 123 high schools in the region.[34] In 2011, the 11th grade was ranked 50th out of 122 western Pennsylvania high schools based on three years of student academic achievement in PSSAs in: reading, math writing and science.[35] (Includes schools in: Allegheny County, Beaver County, Butler County, Fayette County, Westmoreland County, and Washington County. In 2010, Shaler Area School District ranked 53rd out of 122 high schools in western Pennsylvania.
- PSSA Results
- 11th Grade Reading
- 2012 - 71% on grade level, (10% below basic). State - 67% of 11th graders are on grade level.[36]
- 2011 - 71% (13% below basic). State - 69.1%[37]
- 2010 - 75%, (12% below basic). State - 66%[38]
- 2009 - 75% (17% below basic). State - 65%[39]
- 2008 - 73% (9% below basic). State - 65%[40]
- 2007 - 71% (12% below basic). State - 65%[41]
11th Grade Math:
- 2012 - 59% on grade level (23% below basic). In Pennsylvania, 59% of 11th graders are on grade level.[42]
- 2011 - 59% (23% below basic). State - 60.3%[43]
- 2010 - 62% (21% below basic). State - 59%[44]
- 2009 - 59% (22% below basic). State - 56%[45]
- 2008 - 64% (16% below basic). State - 56%[46]
- 2007 - 59% (17% below basic). State - 53%[47]
- 11th Grade Science
- 2012 - 44% on grade level (8% below basic). State - 42% of 11th graders were on grade level.[48]
- 2011 - 48% (10% below basic). State - 40%[49]
- 2010 - 50% (12% below basic). State - 39%
- 2009 - 46% (12% below basic). State - 40%[50]
- 2008 - 45% (11% below basic). State - 39%
College remediation rate
According to a Pennsylvania Department of Education study released in January 2009, 37% of the Shaler Area High School graduates required remediation in mathematics and or reading before they were prepared to take college level courses in the Pennsylvania State System of Higher Education or community colleges.[51] Less than 66% of Pennsylvania high school graduates, who enroll in a four-year college in Pennsylvania, will earn a bachelor's degree within six years. Among Pennsylvania high school graduates pursuing an associate degree, only one in three graduate in three years.[52] Per the Pennsylvania Department of Education, one in three recent high school graduates who attend Pennsylvania's public universities and community colleges takes at least one remedial course in math, reading or English.
SAT scores
In 2012, 321 Shaler Area School District students took the SAT exams. The District's Verbal Average Score was 499. The Math average score was 515. The Writing average score was 497. The statewide Verbal SAT exams results were: Verbal 491, Math 501, Writing 480. In the USA, 1.65 million students took the exams achieving scores: Verbal 496, Math 514, Writing 488. According to the College Board the maximum score on each section was 800, and 360 students nationwide scored a perfect 2,400.
In 2011, 296 students took the SAT exams. The district's Verbal Average Score was 504. The Math average score was 514. The Writing average score was 498.[53] Pennsylvania ranked 40th among states with SAT scores: Verbal - 493, Math - 501, Writing - 479.[54] In the United States 1.65 million students took the exam in 2011. They averaged 497 (out of 800) verbal, 514 math and 489 in writing.[55]
Dual enrollment
The Shaler Area High School offers a dual enrollment program. This state program permits high school students to take courses, at local higher education institutions, to earn college credits. Students remain enrolled at their high school. The courses count towards high school graduation requirements and towards earning a college degree. The students continue to have full access to activities and programs at their high school. The college credits are offered at a deeply discounted rate. The state offered a small grant to assist students in costs for tuition, fees and books[56] Under the Pennsylvania Transfer and Articulation Agreement, many Pennsylvania colleges and universities accept these credits for students who transfer to their institutions.[57] For the 2009-10 funding year, the Shaler Area School District received a state grant of $3,041 for the program.[58] In 2010, Governor Edward Rendell eliminated the grants to students, from the Commonwealth, due to a state budget crisis.
Graduation requirements
The Shaler Area School Board has determined that a pupil must earn 24 credits to graduate, including: math 3 credits, English 4 credits, social studies 3 credits, science 3 credits, Physical Education 2 credits, health 1 credit and electives 8 credits. The Shaler Area School District Board of Education amended high school graduation requirements to include a PSSA score in the Advanced or Proficient category on both Reading and Math PSSA tests in the 8th and 11th grades.[59]
By law, all Pennsylvania secondary school students must complete a project as a part of their eligibility to graduate from high school. The type of project, its rigor and its expectations are set by the individual school district.[60] Effective with the graduating class of 2017, the Pennsylvania State Board of Education eliminated the state mandate that students complete a culminating project in order to graduate.[61]
By Pennsylvania School Board regulations, for the graduating class of 2017, students must demonstrate successful completion of secondary level course work in Algebra I, Biology, English Composition, and Literature by passing the state's Keystone Exams on each subject.[62] The exam is given at the end of the course. Keystone Exams replace the PSSAs for 11th grade. Students have several opportunities to pass the exam, with those who do not able to perform a project in order to graduate.[63][64][65] For the class of 2019, a Composition exam will be added. For the class of 2020, passing a civics and government exam will be added to the graduation requirements.[66] In 2011, Pennsylvania high school students field tested the Algebra 1, Biology and English Lit exams. The statewide results were: Algebra I - 38% on grade level, Biology - 35% on grade level and English Lit - 49% on grade level.[67] Individual student, school or district reports were not made public, although they were reported to district officials by the Pennsylvania Department of Education.
Advanced Placement
The school offers the following Advanced Placement Courses:
Middle school
Shaler Area Middle School is located at 1810 Mount Royal Blvd., Glenshaw, Pennsylvania. According to the National Center for Education Statistics, in 2010, the school reported an enrollment of 747 pupils in grades 7th and 8th, with 185 pupils eligible for a federal free or reduced-price lunch. Shaler Area Middle School employed 72 teachers, yielding a student–teacher ratio of 10:1.[68] In 2012 and 2011, all the teachers were reported as highly qualified under No Child Left Behind Act.[69]
In 2010 through 2012, Shaler Area Middle School achieved AYP status each year.[70]
- Eighth Grade
In 2013, Shaler Area Middle School eighth grade ranked 73rd out of 105 eighth grades in western Pennsylvania based on three years of student academic achievement in PSSAs in: reading, math writing and science.[71] (Includes schools in: Allegheny County, Beaver County, Butler County, Fayette County, Westmoreland County and Washington County.)
- 2012 - 68th[72]
- 2011 - 64th
- 2010 - 60th among 155 local eighth grades.[73]
- 2009 - 57th out of 141 western Pennsylvania middle schools.[74]
- PSSA Results
|
|
- 8th Grade Science
- 2012 - 65% (13% below basic). State - 59%
- 2011 - 62% (19% below basic). State – 58.3%
- 2010 - 66% (19% below basic). State – 57%[80]
- 2009 - 61% (16% below basic). State - 55%[81]
- 2008 - 56% (16% below basic), State - 52% (SAIS)[82]
- Seventh Grade
In 2013, Shaler Area Middle School's seventh grade ranked 83rd out of 105 seventh grades in western Pennsylvania based on three years of student academic achievement in PSSAs in: reading, math writing and science.[83] (Includes schools in: Allegheny County, Beaver County, Butler County, Fayette County, Westmoreland County and Washington County.)
- 2012 - 85th
- 2011 - 68th[84]
- 2010 - 49th among 155 local seventh grades.[85]
- 2009 - 48th out of 141 western Pennsylvania middle schools.[86]
- PSSA Results
|
|
Shaler Area Upper Elementary
Shaler Area Upper Elementary School is located at 705 Scott Avenue, Glenshaw, Pennsylvania. According to the National Center for Education Statistics, in 2010, the school reported an enrollment of 1,082 pupils in grades 4th through 6th, with 334 pupils eligible for a federal free or reduced-price lunch. The school employed 79 teachers, yielding a student–teacher ratio of 14:1.[87] In 2011, all the teachers, at Shaler Area Upper Elementary School, were reported as highly qualified.
In 2012, Shaler Area Upper Elementary School achieved AYP status even though it missed all reading metrics and most mathematic metrics. In 2011 and 2010, Shaler Area Upper Elementary School achieved AYP status.[88]
|
6th Grade Reading: |
6th Grade Math:
|
|
|
|
|
- 4th Grade Science
- 2012 - 88% (2% below basic). State - 82%
- 2011 - 85% (6% below basic), State – 82.9%
- 2010 - 89%, (3% below basic), State - 81%
- 2009 - 90%, (2% below basic), State - 83%
Burchfield Primary School
Burchfield Primary School is located at 1500 Burchfield Road, Allison Park. According to the National Center for Education Statistics, in 2011, the school reported an enrollment of 344 pupils in grades kindergarten through 3rd, with 86 pupils receiving a federal free or reduced price lunch due to family poverty. The school is a federally designated Title I school. The school employed 27.5 teachers yielding a student-teacher ratio of 12:1.[93] According to a report by the Pennsylvania Department of Education, 100% of its teachers were rated "Highly Qualified" under the federal No Child Left Behind Act.[94] Burchfield Primary School has provided universal all-day kindergarten since the 2008-09 school year.
In 2011 and 2012, Burchfield Primary School achieved Adequate Yearly Progress (AYP).[95] Burchfield Primary School achieved Adequate Yearly Progress each school year since 2004. Only the third grade is tested towards AYP.
- PSSA Results
|
|
Jeffery Primary School
Jeffery Primary School is located at 201 Wetzel Road, Glenshaw. According to the National Center for Education Statistics, in 2011, the School reported an enrollment of 234 pupils in grades kindergarten through 3rd, with 71 pupils receiving a federal free or reduced price lunch due to family poverty. The school is a federally designated Title I school. The school employed 19 teachers yielding a student-teacher ratio of 12:1.[98] According to a report by the Pennsylvania Department of Education, 100% of its teachers were rated "Non‐Highly Qualified" under No Child Left Behind.[99]
In both 2011 and 2012, Jeffery Primary School achieved AYP status.[100] In 2012, Jeffery Primary third graders missed all reading target metrics measured on the PSSAs. only 68% of third grade boys were reading on grade level. Jeffery Primary School achieved AYP status each year since 2004. Only the third grade is tested towards AYP. In 2012, the attendance rate was 95.64%.
- PSSA Results
|
|
Marzolf Primary School
Marzolf Primary School is located at 101 Marzolf Rd Ext, Pittsburgh. According to the National Center for Education Statistics, in 2011, the School reported an enrollment of 351 pupils in grades kindergarten through 3rd, with 142 pupils receiving a federal free or reduced price lunch due to family poverty. The school is a federally designated Title I school. The school employed 27 teachers yielding a student-teacher ratio of 13:1.[104] According to a report by the Pennsylvania Department of Education, 100% of its teachers were rated "Non‐Highly Qualified" under No Child Left Behind.[105] Only the third grade is tested towards AYP. In 2012, the attendance rate was 94.7%.
In 2009 through 2012, Marzolf Primary School achieved AYP status. In 2008, Marzolf Primary School declined to Warning AYP status due to lagging students achievement.[106]
- PSSA Results
|
|
Special education
In December 2011, Shaler Area School District administration reported that 761 pupils or 15.7% of the district's pupils received Special Education services. Forty one percent of the special education students were identified as having a specific learning disability. In December 2010, the district administration reported that 937 pupils or 18.7% of the district's pupils received Special Education services. Forty three percent of the special education students were identified as having a specific learning disability. In 2009 the district reported that 964 pupils or 19% of its students were identified as needing special education services.[110][111]
In order to comply with state and federal Individuals with Disabilities Education Act rules and regulations, the school district engages in identification procedures to ensure that eligible students receive an appropriate educational program consisting of special education and related services, individualized to meet student needs. At no cost to the parents, these services are provided in compliance with state and federal law; and are reasonably calculated to yield meaningful educational benefit and student progress .[112] To identify students who may be eligible for special education services, various screening activities are conducted on an ongoing basis. These screening activities include: review of group-based data (cumulative records, enrollment records, health records, report cards, ability and achievement test scores); hearing, vision, motor, and speech/language screening; and review by the Special Education administration. When screening results suggest that the student may be eligible, the District seeks parental consent to conduct a multidisciplinary evaluation. Parents who suspect their child is eligible may verbally request a multidisciplinary evaluation from a professional employee of the District or contact the district's Special Education Department.[113][114] The IDEA 2004 requires each school entity to publish a notice to parents, in newspapers or other media, including the student handbook and website regarding the availability of screening and intervention services and how to access them.
In 2010, the state of Pennsylvania provided $1,026,815,000 for special education services. This funding is in addition to the state's basic education per pupil funding, as well as, all other state and federal funding.[115] The Pennsylvania Special Education funding system assumes that 16% of the district’s students receive special education services. It also assumes that each student’s needs accrue the same level of costs.[116] The state requires each district to have a three-year special education plan to meet the unique needs of its special education students.[117] Overidentification of students, in order to increase state funding, has been an issue in the Commonwealth. Some districts have more than 20% of its students receiving special education services while others have 10% supported through special education.[118] The state requires each public school district and charter school to have a three-year special education plan to meet the unique needs of its special education students.[119] In 2012, the Obama Administration's US Department of Education issued a directive that schools include students with disabilities in extracurricular activities, including sports.[120]
Shaler Area School District received a $3,163,866 supplement for special education services in 2010.[121] For the 2011-12, 2012–13 and 2013-14 school years, all Pennsylvania public school districts received the same level of funding for special education that they received in 2010-11. This level funding is provided regardless of changes in the number of pupils who need special education services and regardless of the level of services the respective students required.[122][123] Additionally, the state provides supplemental funding for extraordinarily impacted students. The District must apply for this added funding.
Gifted education
The District Administration reported that 338 or 6.26% of its students were gifted in 2009.[124] The highest percentage of gifted students reported among all 500 school districts and 100 public charter schools in Pennsylvania was North Allegheny School District with 15.5% of its students identified as gifted. By law, the district must provide mentally gifted programs at all grade levels. The referral process for a gifted evaluation can be initiated by teachers or parents by contacting the student’s building principal and requesting an evaluation. All requests must be made in writing. The timetable for testing does not begin until the signed consent form is received by the school. To be eligible for mentally gifted programs in Pennsylvania, a student must have a cognitive ability of at least 130 as measured on a standardized ability test by a certified school psychologist. Other factors that indicate giftedness will also be considered for eligibility.[125][126]
Wellness policy
Shaler Area School Board established a district wellness policy in 2006.[127] The policy deals with nutritious meals served at school, the control of access to some foods and beverages during school hours, age appropriate nutrition education for all students, and physical education for students K-12. The policy is in response to state mandates and federal legislation (P.L. 108 – 265). The law dictates that each school district participating in a program authorized by the Richard B. Russell National School Lunch Act (42 U.S.C. 1751 et seq) or the Child Nutrition Act of 1966 (42 U.S.C. 1771 et seq) "shall establish a local school wellness policy by School Year 2006." Most districts identified the superintendent and school foodservice director as responsible for ensuring local wellness policy implementation.[128]
The legislation placed the responsibility of developing a wellness policy at the local level so the individual needs of each district can be addressed. According to the requirements for the Local Wellness Policy, school districts must set goals for nutrition education, physical activity, campus food provision, and other school-based activities designed to promote student wellness. Additionally, districts were required to involve a broad group of individuals in policy development and to have a plan for measuring policy implementation. Districts were offered a choice of levels of implementation for limiting or prohibiting low nutrition foods on the school campus. In final implementation these regulations prohibit some foods and beverages on the school campus.[129] The Pennsylvania Department of Education required the district to submit a copy of the policy for approval.
Shaler Area School District offers a free school breakfast and free or reduced-price lunch to children in low income families. All students attending the school can eat breakfast and lunch. Children from families with incomes at or below 130 percent of the federal poverty level are provided a breakfast and lunch at no cost to the family. Children from families with incomes between 130 and 185 percent of the federal poverty level can be charged no more than 30 cents per breakfast. A foster child whose care and placement is the responsibility of the State or who is placed by a court with a caretaker household is eligible for both a free breakfast and a free lunch. Runaway, homeless and Migrant Youth are also automatically eligible for free meals.[130] The meals are partially funded with federal dollars through the United States Department of Agriculture.[131]
In 2013, the USDA issued new restrictions to foods in public schools. The rules apply to foods and beverages sold on all public school district campuses during the day. They limit vending machine snacks to a maximum of 200 calories per item. Additionally, all snack foods sold at school must meet competitive nutrient standards, meaning they must have fruits, vegetables, dairy or protein in them or contain at least 10 percent of the daily value of fiber, calcium, potassium, and Vitamin D.[132] In order to comply with the Healthy, Hunger-Free Kids Act of 2010 all US public school districts are required to raise the price of their school lunches to $2.60 regardless of the actual cost of the lunch.[133]
Shaler Area School District provides health services as mandated by the Commonwealth and the federal government. Nurses are available in each building to conduct annual health screenings (data reported to the PDE and state Department of Health) and to dispense prescribed medications to students during the school day. Students can be excluded from school unless they comply with all the State Department of Health’s extensive immunization mandates. School nurses monitor each pupil for this compliance.[134] Nurses also monitor each child's weight.
Highmark Healthy High 5 grant
In 2011, the Shaler Area School District received funding through a Highmark Healthy High 5 grant. Shaler Area Middle School received $9,900 which was used to purchase treadmills to support fitness initiative.[135] Additionally, Shaler Area Elementary School received $8,925 for 2 treadmills, 2 indoor cycling bikes, two power steppers and heart rate monitors. In 2011, Shaler Area MIddle School received $7,757.00 for its SAMS Program (Action-Based Students) & B.A.S.I.C. Training Room. Rogers School received $8,065 for its Health and Physical Education program. Shaler Area High School received $7,877 for its Shaler Area Mountain Bike Adventure. Beginning in 2006, Highmark Foundation engaged in a 5-year, $100 million program to promote lifelong healthy behaviors in children and adolescents through local nonprofits and schools.
The District participated in Highmark Healthy High 5 Health eTools for Schools which enabled mobile data collection of pertinent health and physical fitness screening data on students K-12 in a database held by InnerLink, Inc. in Lancaster, Pennsylvania. Health eTools for Schools also provided interdisciplinary research-based curriculum in nutrition, physical education and physical activity to participating districts. The program was discontinued in 2013.[136]
Budget
Pennsylvania public school districts budget and expend funds according to procedures mandated by the General Assembly and the Pennsylvania Department of Education (PDE). An annual operating budget is prepared by school district administrative officials. A uniform form is furnished by the PDE and submitted to the board of school directors for approval prior to the beginning of each fiscal year on July 1.
Under Pennsylvania’s Taxpayer Relief Act, Act 1 of the Special Session of 2006, all school districts of the first class A, second class, third class and fourth class must adopt a preliminary budget proposal. The proposal must include estimated revenues and expenditures and the proposed tax rates. This proposed budget must be considered by the Board no later than 90 days prior to the date of the election immediately preceding the fiscal year. The preliminary budget proposal must also be printed and made available for public inspection at least 20 days prior to its adoption. The board of school directors may hold a public hearing on the budget, but are not required to do so. The board must give at least 10 days’ public notice of its intent to adopt the final budget according to Act 1 of 2006.[137]
In September 2012, the Shaler Area Teachers Union declared a strike, shuttering the schools district wide.[138] In 1997, the Shaler Area Teachers union also declared a strike against the District. Of nearly 140 teacher strikes that occurred nationally between 2000 and 2007, 60 percent took place in Pennsylvania, according to a report released in August by the Allegheny Institute for Public Policy.[139] Pennsylvania is one of 13 states in which teacher strikes are legal. Pennsylvania has the highest rate of teacher strikes in the United States. In the Commonwealth of Pennsylvania, there were three teacher union strikes in 2010; one teacher union strike in 2011, one teacher union strike in 2012 and three teacher union strikes in 2013.[140] State law gives the Pennsylvania Department of Education the power to order the teachers to return so that students will complete 180 days of school by June 15.
In 2011, the average teacher salary in Shaler Area School District was $56,690 a year, while the cost of the benefits teachers received was $22,985 per employee, for a total annual average teacher compensation of $79,675.99.[141] The District employed 420 teachers with an average salary of $59,273 and a top salary of $119,539, in 2012.[142]
According to a study conducted at the American Enterprise Institute, in 2011, public school teachers’ total compensation is roughly 50 percent higher than they would likely receive in the private sector. The study found that the most generous benefits that teachers receive are not accounted for in many studies of compensation including: pension, retiree health benefits and job security.[143]
In 2009, the Shaler Area School District reported employing 537 teachers and administrators with a salary range of $40,000 to $148,231.[144] Additionally, the teachers received: a defined benefit pension, health insurance, dental insurance, vision insurance, life insurance, professional development reimbursement, paid personal days, 10 paid sick days, and other benefits.[145]
In 2007, Shaler Area School District employed 376 teachers. The average teacher salary in the district was $53,071 for 180 days worked.[146] As of 2007, Pennsylvania ranked in the top 10 states in average teacher salaries. When adjusted for cost of living Pennsylvania ranked fourth in the nation for teacher compensation.[147]
Shaler Area School District administrative costs per pupil in 2008 was $644.75 per pupil. The lowest administrative cost per pupil in Pennsylvania was $398 per pupil.[148] The Pennsylvania School Boards Association keeps statistics on salaries of public school district employees in Pennsylvania. According to the association's report, the average salary for a superintendent, for the 2007-08 school year, was $122,165. Shaler Area SD's Superintendent was paid $148,231. Superintendents and administrators receive an extensive benefit package commensurate with that offered to the district's teachers' union.[149]
Per pupil spending In 2008, the Shaler Area School District administration reported that per pupil spending was $12,993 which ranked 176th among Pennsylvania's 501 school districts. In 2010, the per pupil spending had increased to $13,787.33[150] In 2012, the District's per pupil spending roe to $14,190.71. Among the states, Pennsylvania’s total per pupil revenue (including all sources) ranked 11th at $15,023 per student, in 2008-09.[151] In 2007, the Pennsylvania per pupil total expenditures was $12,759.[152]
The U.S. Census Bureau reported that Pennsylvania spent $8,191 per pupil in school year 2000-01.[153] In 2007, the Pennsylvania per pupil total expenditures was reported as $12,759.[154] Among the fifty states, Pennsylvania’s total per pupil revenue (including all sources) ranked 11th at $15,023 per student, in 2008-09.[155] Pennsylvania’s total revenue per pupil rose to $16,186 ranking 9th in the nation in 2011.[156]
Reserves In 2008, Shaler Area School District reported a balance of $$3,843,438 in an unreserved-designated fund. The unreserved-undesignated fund balance was reported as $3,368,367.[157] In 2010, Shaler Area School District Administration reported a decrease to $3,775,000 in the unreserved-designated fund balance. The unreserved-undesignated fund balance was reported as $3,479,203. By 2013, the Districts reserves were $7,760,746. Pennsylvania school district reserve funds are divided into two categories – designated and undesignated. The undesignated funds are not committed to any planned project. Designated funds and any other funds, such as capital reserves, are allocated to specific projects. School districts are required by state law to keep 5 percent of their annual spending in the undesignated reserve funds to preserve bond ratings. According to the Pennsylvania Department of Education, from 2003 to 2010, as a whole, Pennsylvania school districts amassed nearly $3 billion in reserved funds.[158] By 2013, reserves held by Pennsylvania public school districts, as a whole, had increased to over $3.8 billion.[159]
Audit In December 2010, the Pennsylvania Auditor General conducted a performance audit of the district. The findings were reported to the school board and administration.[160]
Tuition Students who live in the Shaler Area School District's attendance area may choose to attend one of Pennsylvania's 157 public charter schools. A student living in a neighboring public school district or a foreign exchange student may seek admission to Shaler Area School District. For these cases, the Pennsylvania Department of Education sets an annual tuition rate for each school district. It is the amount the public school district pays to a charter school for each resident student that attends the charter and it is the amount a nonresident student's parents must pay to attend the Shaler Area School District's schools. The 2012 tuition rates are Elementary School - $9,818.52, High School - $10,002.[161]
Shaler Area School District is funded by a combination of: a local earned income tax 0.5%, a property tax, a real estate transfer tax 0.5%, coupled with substantial funding from the Commonwealth of Pennsylvania and the federal government. Grants can provide an opportunity to supplement school funding without raising local taxes. Interest earnings on accounts also provide nontax income to the District. In the Commonwealth of Pennsylvania, pension income and Social Security income are exempted from state personal income tax and local earned income tax, regardless of the level of the individual’s personal wealth.[162] The average Pennsylvania public school teacher pension in 2011 exceeds $60,000 a year plus they receive federal Social Security benefits: both are free of Pennsylvania state income tax and local income tax which funds local public schools.[163]
State basic education funding
For the 2013-14 school year, the Shaler Area School District will receive a 2.9% increase or $10,749,132 in Pennsylvania Basic Education Funding. This is $307,957 more than its 2012-13 state BEF to the District. Additionally, Shaler Area School District will receive $263,166 in Accountability Block Grant funding to focus on academic achievement and level funding for special education services. Among the public school districts in Allegheny County, South Fayette Township School District received the highest percentage increase at 5.5%. The District has the option of applying for several other state and federal grants to increase revenues. The Commonwealth’s budget increased Basic Education Funding statewide by $123 million to over $5.5 billion. Most of Pennsylvania’s 500 public school districts received an increase of Basic Education Funding in a range of 0.9% to 4%. Eight public school districts received exceptionally high funding increases of 10% to 16%. The highest increase in state funding was awarded to Austin Area School District which received a 22.5% increase in Basic Education Funding.[164] The state funded the PSERS (Pennsylvania school employee pension fund) with $1,017,000,000 and Social Security payments for school employees of $495 million.[165]
For the 2012-13 school year, the Shaler Area School District received $10,441,175.[166] The Governor's Executive Budget for 2012-2013 included $9.34 billion for kindergarten through 12th grade public education, including $5.4 billion in basic education funding, which was an increase of $49 million over the 2011-12 budget. In addition, the Commonwealth provided $100 million for the Accountability Block Grant (ABG) program. Shaler Area School District received $263,166 in Accountability Block Grant funding. The state also provided a $544.4 million payment for School Employees’ Social Security and $856 million for School Employees’ Retirement fund called PSERS.[167] This amount was a $21,823,000 increase (0.34%) over the 2011-2012 appropriations for Basic Education Funding, School Employees' Social Security, Pupil Transportation, Nonpublic and Charter School Pupil Transportation. Since taking office, Corbett’s first two budgets have restored more than $918 million in support of public schools, compensating for the $1 billion in federal stimulus dollars lost at the end of the 2010-11 school year.
In 2011-12, Shaler Area School District received a $10,441,175, allocation, of state Basic Education Funding.[168][169] Additionally, Shaler Area School District received $263,166 in Accountability Block Grant funding. The enacted Pennsylvania state Education budget includes $5,354,629,000 for the 2011-2012 Basic Education Funding appropriation. This amount is a $233,290,000 increase (4.6%) over the enacted State appropriation for 2010-2011.[170] The highest increase in state basic education funding was awarded to Duquesne City School District, which got a 49% increase in state funding for 2011-12.[171] In 2010, Shaler Are School District reported that 1,320 students received free or reduced-price lunches, due to the family meeting the federal poverty level.[172]
In the 2010-2011 budget year, the Commonwealth of Pennsylvania provided a 2.99% increase in Basic Education Funding for a total of $10,649,998. Among the districts in Allegheny County, the highest increase went to South Fayette Township School District which got an 11.32% increase. Fifteen (15) Pennsylvania public school districts received a BEF increase of greater than 10%. One hundred fifty Pennsylvania school districts received the base 2% increase. The highest increase in 2010-11 went to Kennett Consolidated School District in Chester County which received a 23.65% increase in state funding.[173] The state's hold harmless policy regarding state basic education funding continued where a public school district received at least the same amount as the year before, even where enrollment had significantly declined. The amount of increase each school district received was set by Governor Edward G. Rendell and then Secretary of Education Gerald Zahorchak, as a part of the state budget proposal given each February. This was the second year of the Governor’s policy to fund some districts at a much greater rate than others.
In the 2009-10 budget year, the Commonwealth of Pennsylvania provided a 2% increase in Basic Education Funding, to Shaler Area School District, for a total of $10,649,999. Among the public school districts in Allegheny County, the highest increase went to Chartiers Valley School District which received an 8.14% increase in BEF. Ninety school districts received a 2% increase in 2010. Muhlenberg School District in Berks County received a 22.31% increase in state basic education funding in 2009.[174] The amount of increase each school district received was set by Governor Edward G. Rendell and the Secretary of Education Gerald Zahorchak, as a part of the state budget proposal.[175]
The state Basic Education Funding to Shaler Area School District, in 2008-09, was $10,441,175.10. According to the Pennsylvania Department of Education, 1,064 district students received free or reduced-price lunches due to low family income in the 2007–2008 school year.[176] According to the U.S. Census Bureau, Pennsylvania spent $7,824 Per Pupil in the year 2000. This amount increased up to $12,085 by the year 2008.[177][178]
Accountability Block Grants
Beginning in 2004-2005, the state launched the Accountability Block Grant school funding. This program has provided $1.5 billion to Pennsylvania’s school districts. The Accountability Block Grant program requires that its taxpayer dollars are focused on specific interventions that are most likely to increase student academic achievement. These interventions include: teacher training, all-day kindergarten, lower class size K-3rd grade, literacy and math coaching programs that provide teachers with individualized job-embedded professional development to improve their instruction, before or after school tutoring assistance to struggling students. For 2010-11, the District applied for and received $714,299 in addition to all other state and federal funding. The District used the funding to provide extended instruction to students, to pay teacher coaches who instruct teachers on various techniques, to provide extensive training to teachers to improve their instruction and reduced class size K-3rd grade.[179][180]
Classrooms for the Future grant
The Classroom for the Future state program provided districts with hundreds of thousands of extra state funding to buy laptop computers for each core curriculum high school class (English, Science, History, Math) and paid for teacher training to optimize the computers use. The program was funded from 2006-2009. Shaler Area School District received $223,133 in 2006-07. In 2007-08, the District received another $300,000. The District received $75,909 in 2008-09 for a total funding of $599,042.[181] In Allegheny County, the highest award was given to Highlands School District which received $835,286. The highest funding statewide was awarded to Philadelphia City School District in Philadelphia County - $9,409,073. In 2010, Classrooms for the Future funding was curtailed statewide due to a massive state financial crisis.
Other grants
Shaler Area School District did not participate in: Pennsylvania Department of Environmental Protection's Environmental Education annual grants, PA Science Its Elementary grants (discontinued effective with 2009-10 budget by Governor Rendell), Education Assistance Grants, 2012 Striving Readers Comprehensive Literacy grant, nor the federal 21st Century Learning grants.
Federal Stimulus grant
Shaler Area School District received an extra $3,618,821 in ARRA - Federal Stimulus money to be used in specific programs like special education and meeting the academic needs of low-income students.[182] The funding was limited to the 2009-10 and 2010-2011 school years.[183] Due to the temporary nature of the funding, schools were repeatedly advised to use the funds for one-time expenditures like acquiring equipment, making repairs to buildings, training teachers to provide more effective instruction or purchasing books and software.
Race to the Top grant
Shaler Area School District officials did not apply for the federal Race to the Top grant which would have provided over one million dollars in additional federal funding to improve student academic achievement.[184] Participation required the administration, the school board and the local teachers' union to sign an agreement to prioritize improving student academic success. In Pennsylvania, 120 public school districts and 56 charter schools agreed to participate.[185] Pennsylvania was not approved for the grant. The failure of districts to agree to participate was cited as one reason that Pennsylvania was not approved.[186][187][188]
Common Cents state initiative
The School Board elected to participate in the Pennsylvania Department of Education Common Cents program. The program called for the state to audit the district, at no cost to local taxpayers, to identify ways the district could save tax dollars.[189] After the review of the information, the district was not required to implement the recommended cost savings changes. The review found over one half million dollars in potential savings through shared services. One suggestion was to share food service director positions across several local school districts.
Real estate taxes
Property tax rates in 2012-14 were set by the school board at 20.3700 mills.[190] A mill is $1 of tax for every $1,000 of a property's assessed value. Allegheny County underwent a property reassessment which caused the millage to be reduced to avoid the Districts gaining a windfall. Irregular property reassessments have become a serious issue in the commonwealth as it creates a significant disparity in taxation within a community and across a region.[191] Property taxes, in the Commonwealth of Pennsylvania, apply only to real estate - land and buildings. The property tax is not levied on cars, business inventory, or other personal property. Certain types of property are exempt from property taxes, including: places of worship, places of burial, private social clubs, charitable and educational institutions and government property. Additionally, service related, disabled US military veterans may seek an exemption from paying property taxes. Pennsylvania school district revenues are dominated by two main sources: 1) Property tax collections, which account for the vast majority (between 75-85%) of local revenues; and 2) Act 511 tax collections, which are around 15% of revenues for school districts.[192] When a Pennsylvania public school district includes municipalities in two counties, each of which has different rates of property tax assessment, a state board equalizes the tax rates between the counties.[193] In 2010, miscalculations by the State Tax Equalization Board (STEB) were widespread in the Commonwealth and adversely impacted funding for many school districts, including those that did not cross county borders.[194]
- 2012-13 - 25.6300 mills
- 2011-12 - 25.6300 mills
- 2010-11 - 25.6300 mills[195]
- 2009-10 - 24.7000 mills.[196]
- 2008-09 - 24.7000 mills.[197]
- 2007-08 - 24.7000 mills.[198]
- 2006-07 - 24.2500 mills.[199]
- 2005-06 - 23.5000 mills.[200]
Act 1 Adjusted Index
The Act 1 of 2006 Index regulates the rates at which each school district can raise property taxes in Pennsylvania. Districts are not allowed to raise taxes above that index unless they allow voters to vote by referendum, or they seek an exception from the state Department of Education. The base index for the 2011-2012 school year is 1.4 percent, but the Act 1 Index can be adjusted higher, depending on a number of factors, such as property values and the personal income of district residents. Act 1 included 10 exceptions, including: increasing pension costs, increases in special education costs, a catastrophe like a fire or flood, increase in health insurance costs for contracts in effect in 2006 or dwindling tax bases. The base index is the average of the percentage increase in the statewide average weekly wage, as determined by the PA Department of Labor and Industry, for the preceding calendar year and the percentage increase in the Employment Cost Index for Elementary and Secondary Schools, as determined by the Bureau of Labor Statistics in the U.S. Department of Labor, for the previous 12-month period ending June 30. For a school district with a market value/personal income aid ratio (MV/PI AR) greater than 0.4000, its index equals the base index multiplied by the sum of .75 and its MV/PI AR for the current year.[201] In June 2011, the Pennsylvania General Assembly eliminated six of the ten the exceptions to the Act 1 Index.[202] The following exceptions were maintained: 1) costs to pay interest and principal on indebtedness incurred prior to September 4, 2004 for Act 72 schools and prior to June 27, 2006 for non-Act 72 schools; 2) costs to pay interest and principal on electoral debt; 3) costs incurred in providing special education programs and services (beyond what is already paid by the State); and 4) costs due to increases of more than the Index in the school’s share of payments to PSERS (PA school employees pension fund) taking into account the state mandated PSERS contribution rate.[203][204] The legislature also froze the payroll amount public school districts use to calculate the pension-plan exception at the 2012 payroll levels. Further increases in payroll cannot be used to raise the district’s exception for pension payments.
A specific timeline for Act I Index decisions is published annually, by the Pennsylvania Department of Education.[205]
The School District Adjusted Index for the Shaler Area School District 2006-2007 through 2011-2012.[206]
|
For the 2013-14 budget year, Shaler Area School Board did not apply for exceptions to exceed their Act 1 Index limit. For the school budget year 2013-14, 311 Pennsylvania public school districts adopted a resolution certifying that tax rates would not be increased above their index. Another 171 school districts adopted a preliminary budget leaving open the option of exceeded the Index limit. For the exception for pension costs, 89 school districts received approval to exceed the Index in full while others received a partial approval of their request. For special education costs, 75 districts received approval to exceed their tax limit. For the pension costs exception, 169 school districts received approval to exceed the Index. Eleven Pennsylvania public school districts received an approval for grandfathered construction debts.[209]
For the 2011-12 and the 2012-13 school years, the Shaler Area School Board did not apply for an exception to exceed the Act 1 Index. Each year, the Shaler Area School Board has the option of adopting either 1) a resolution in January certifying they will not increase taxes above their index or 2) a preliminary budget in February. A school district adopting the resolution may not apply for referendum exceptions or ask voters for a tax increase above the inflation index. A specific timeline for these decisions is published annually, by the Pennsylvania Department of Education.[210]
According to a state report, for the 2012-2013 school year budgets, 274 school districts adopted a resolution certifying that tax rates would not be increased above their index; 223 school districts adopted a preliminary budget. Of the districts who sought exceptions: 194 used the pension costs exemption and 129 sought a Special Education costs exemption. Twenty four school districts sought an exemption for grandfathered School Construction Project.[211]
For the 2011-2012 school year budgets, 247 school districts adopted a resolution certifying that tax rates would not be increased above their index; 250 school districts adopted a preliminary budget. Of the 250 school districts that adopted a preliminary budget, 231 adopted real estate tax rates that exceeded their index. Tax rate increases in the other 19 school districts that adopted a preliminary budget did not exceed the school district’s index. Of the districts who sought exceptions: 221 used the pension costs exemption and 171 sought a Special Education costs exemption. Only 1 school district sought an exemption for Nonacademic School Construction Project, while 1 sought an exception for Electoral debt for school construction.[212]
The Shaler Area School Board did not use any exceptions to exceed the Act 1 index for the budget in the 2010-11 school year.[213] For 2009-10 school budget, the board did not exceed its Act 1 Index.[214] In the Spring of 2010, 135 Pennsylvania school boards asked to exceed their adjusted index. Approval was granted to 133 of them and 128 sought an exception for pension costs increases.[215]
Extracurriculars
The Shaler Area School District offers a variety of clubs, activities and an extensive sports program. Eligibility for participation is determined by school board policy. The District has both a marching band and an orchestra.
By Pennsylvania law, all K-12 students residing in the district, including those who attend a private nonpublic school, cyber charter school, charter school and those homeschooled, are eligible to participate in the extracurricular programs, including all athletics. They must meet the same eligibility rules as the students enrolled in the district's schools.[216]
Sports
The District funds:
|
|
According to PIAA directory July 2013.[217]
Shaler's teams are all nicknamed "The Titans." Shaler athletics compete in the WPIAL/PIAA AAAA/AAA divisions depending on sport.
Shaler's biggest rival is the neighboring North Allegheny Tigers and North Hills Indians, who also compete in the same section.
Shaler's softball team took home numerous PIAA and WPIAL titles from 2000-2009.
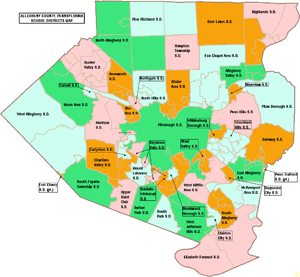
Neighboring Districts
Shaler Area School District neighbors are: North Hills S.D. to the west, Hampton Township S.D. to the north, Fox Chapel Area S.D. to the east, and the Pittsburgh S.D. to the south.
Transportation
First Student is Shaler's contractor.
References
- ↑ Shaler Area School District (2012). "Shaler Area School District 2012-13 Operating Budget" (PDF).
- ↑ Shaler Area School District Administration (2011). "Shaler Area School District Budget report 2011-12" (PDF).
- ↑ Federal Education Budget Project (2010). "Shaler Area School District data report".
- ↑ Pennsylvania Department of Education, Enrollment by LEA 2012-13, 2013
- ↑ US Census Bureau, 2010 Census Poverty Data by Local Educational Agency, 2011
- ↑ US Census Bureau, American Fact Finder, 2009
- ↑ US Census Bureau (2010). "American Fact Finder, State and County quick facts".
- ↑ US Census Bureau (September 2011). "Income, Poverty, and Health Insurance Coverage in the United States: 2010" (PDF).
- ↑ Michael Sauter & Alexander E.M. Hess, (August 31, 2013). "America's most popular six-figure jobs". USA Today.
- ↑ Pennsylvania Department of Education, Enrollment and projections by LEA 2010, July 20, 2010
- ↑ Pennsylvania Auditor General, Shaler Area School District Report, 2010
- ↑ National Center for Education Statistics (2013). "Common Core of Data - Shaler Area School District report 2011".
- ↑ "Statewide Honor Roll Rankings 2013". Pittsburgh Business Times. April 5, 2013.
- ↑ Pittsburgh Business Times, Statewide Honor Roll Rankings information 2011, April 4, 2011
- ↑ Pittsburgh Business Times, Statewide Honor Roll Rankings 2010, April 30, 2010
- ↑ Pittsburgh Business Times, Statewide Honor Roll Rankings 2009, May 3, 2009
- ↑ "Three of top school districts in state hail from Allegheny County". Pittsburgh Business Times. May 23, 2007.
- ↑ "Overachiever statewide ranking". Pittsburgh Business Times. May 6, 2010.
- ↑ Pittsburgh Business Times (April 6, 2012). "Honor Roll Local Ranking Information".
- ↑ The Morning Call (2009). "2009 PSSA RESULTS School District".
- ↑ Pennsylvania Department of Education (September 21, 2012). "Shaler Area School District AYP Overview 2012".
- ↑ Pennsylvania Department of Education, Pennsylvania Public School District AYP History, 2011
- ↑ Pennsylvania Department of Education, Pennsylvania District AYP History 2003-2010, 2011
- ↑ Pennsylvania Department of Education (September 29, 2011). "Shaler Area School District AYP Data Table".
- ↑ Pennsylvania Department of Education (March 15, 2011). "New 4-year Cohort Graduation Rate Calculation Now Being Implemented".
- ↑ Pennsylvania Department of Education, Shaler Area High School AYP Report Card Data table 2010, October 20, 2010
- ↑ The Times-Tribune (June 27, 2010). "PA School District Statistical Snapshot Database 2008-09".
- ↑ The Times-Tribune (June 25, 2009). "Allegheny County School Districts Graduation Rates 2008".
- ↑ Pennsylvania Partnerships for Children (2008). "High School Graduation rate 2007" (PDF).
- ↑ National Center for Education Statistics - Common Care Data - Shaler Area High School, 2010
- ↑ Pennsylvania Department of Education, Shale Area High School AYP Overview 2012, September 21, 2012
- ↑ Pennsylvania Department of Education (September 29, 2011). "Shaler Area High School AYP Overview".
- ↑ Pennsylvania Department of Education, Professional Qualifications of Teachers Report - Shaler Area High School, September 29, 2011
- ↑ Pittsburgh Business Times (April 6, 2013). "The Rankings: Eleventh grade".
- ↑ Pittsburgh Business Times (April 4, 2011). "The Rankings: Eleventh grade".
- ↑ Pennsylvania Department of Education (September 29, 2012). "2011-2012 PSSA and AYP Results".
- ↑ Pennsylvania Department of Education (September 29, 2011). "2010-2011 PSSA and AYP Results".
- ↑ Pennsylvania Department of Education (2010). "2009-2010 PSSA and AYP Results".
- ↑ The Times-Tribune. (September 14, 2009). "Grading Our Schools database, 2009 PSSA results,".
- ↑ Pennsylvania Department of Education (August 15, 2008). "2007-2008 PSSA and AYP Results".
- ↑ Pennsylvania Department of Education (2007). "PSSA Math and Reading results".
- ↑ Pittsburgh Post Gazette (October 15, 2012). "How is your school doing?".
- ↑ Pennsylvania Department of Education, Shaler Area High School Academic Achievement Report Card 2011, September 29, 2011
- ↑ Pennsylvania Department of Education, Shaler Area High School Academic Achievement Report Card 2010, October 20, 2010
- ↑ Pennsylvania Department of Education, Shaler Area High School Academic Achievement Report Card 2009, September 14, 2010
- ↑ Pennsylvania Department of Education, Shaler Area High School Academic Achievement Report Card 2008, August 15, 2008
- ↑ Pennsylvania Department of Education, Shaler Area High School Academic Achievement Report Card 2007, 2007
- ↑ Pennsylvania Department of Education (September 21, 2012). "Shaler Area High School Academic Achievement Report Card 2012" (PDF).
- ↑ Pennsylvania Department of Education (September 29, 2011). "2010-2011 PSSA results in Science".
- ↑ The Times-Tribune (2009). "Grading Our Schools database, 2009 Science PSSA results".
- ↑ Pennsylvania Department of Education (January 20, 2009). "Pennsylvania College Remediation Report,".
- ↑ National Center for Education Statistics, IPEDS Integrated Postsecondary Education Data System, 2008
- ↑ Pennsylvania Department of Education (2011). "Public School SAT Scores 2011".
- ↑ College Board (September 2011). "SAT Scores State By State - Pennsylvania".
- ↑ "While U.S. SAT scores dip across the board, N.J. test-takers hold steady". NJ.com. September 2011.
- ↑ Pennsylvania Department of Education (2010). "Dual Enrollment Guidelines".
- ↑ Commonwealth of Pennsylvania (March 2010). "Pennsylvania Transfer and Articulation Agreement".
- ↑ Pennsylvania Department of Education (2009). "Dual Enrollment Grants 2009 10 Fall Grants by School District".
- ↑ Shaler Area School District Administration (January 8, 2009). "Shaler Area School District Strategic Plan" (PDF).
- ↑ Pennsylvania State Board of Education. "Pennsylvania Code §4.24 (a) High school graduation requirements".
- ↑ Pennsylvania State Board of Education, Proposed changes to Chapter 4, May 10, 2012
- ↑ Pennsylvania Department of Education (2010). "Keystone Exam Overview" (PDF).
- ↑ Pennsylvania Department of Education (September 2011). "Pennsylvania Keystone Exams Overview".
- ↑ Pennsylvania Department of Education (September 2011). "Pennsylvania Keystone Exams Overview".
- ↑ Pennsylvania State Board of Education (2010). "Rules and Regulation Title 22 PA School Code CH. 4".
- ↑ Pennsylvania Department of Education, State Board of Education Finalizes Adoption of Pennsylvania Common Core State Academic Standards and High School Graduation Requirements, March 14, 2013
- ↑ Pennsylvania Department of Education (2011). "Keystone Exams".
- ↑ National Center for Education Statistics - Common Care Data - Shaler Area Middle School, 2010
- ↑ Pennsylvania Department of Education, Professional Qualifications of Teachers Shaler Area Middle School, September 21, 2012
- ↑ Pennsylvania Department of Education (September 29, 2011). "Shaler Area Middle School AYP Overview".
- ↑ Pittsburgh Business Times (April 4, 2013). "The Rankings: Eighth grade 2013".
- ↑ Pittsburgh Business Times (April 4, 2011). "The Rankings: Eighth grade 2011,".
- ↑ Pittsburgh Business Times (April 29, 2010). "The Rankings: Eighth grade 2010".
- ↑ Pittsburgh Business Times, The Rankings 2009: Eighth grade, May 15th, 2009
- ↑ Pittsburgh Post Gazette (October 15, 2012). "How is your school doing?".
- ↑ Pennsylvania Department of Education (September 29, 2011). "Shaler Area Middle School Academic Achievement Report Card 2011" (PDF).
- ↑ Pennsylvania Department of Education, Shaler Area Middle School Academic Achievement Report Card 2010, October 20, 2010
- ↑ Pennsylvania Department of Education, Shaler Area Middle School Academic Achievement Report Card 2009, September 14, 2009
- ↑ Pennsylvania Department of Education (September 21, 2012). "Shaler Middle School Academic Achievement Report Card 2012" (PDF).
- ↑ Pennsylvania Department of Education Report (August 2010). "Science PSSA 2010 by Schools".
- ↑ Pennsylvania Department of Education Report (August 2009). "Science PSSA 2009 by Schools".
- ↑ Pennsylvania Department of Education Report (August 15, 2008). "Science PSSA 2008 by Schools".
- ↑ Pittsburgh Business Times (April 6, 2013). "The Rankings: seventh grade 2013".
- ↑ Pittsburgh Business Times, The Rankings: seventh grade 2011, April 4, 2011
- ↑ Pittsburgh Business Times (April 29, 2010). "The Rankings: seventh grade 2010".
- ↑ Pittsburgh Business Times, The Rankings 2009: Seventh grade, May 15th, 2009
- ↑ National Center for Education Statistics - Common Care Data - Shaler Area Upper Elementary School, 2010
- ↑ Pennsylvania Department of Education (September 29, 2011). "Shaler Area Upper Elementary School AYP Overview".
- ↑ Pennsylvania Department of Education (September 21, 2012). "Shaler Area Upper Elementary Academic Achievement Report Card 2012" (PDF).
- ↑ Pennsylvania Department of Education, Shaler Area Upper Elementary Academic Achievement Report Card 2011, September 29, 2011
- ↑ Pennsylvania Department of Education, Shaler Area Upper Elementary Academic Achievement Report Card 2010, October 20, 2010
- ↑ Pennsylvania Department of Education, Shaler Area Upper Elementary Academic Achievement Report Card 2009, September 14, 2009
- ↑ National Center for Education Statistics, Common Core Data – Burchfield Primary School, 2011
- ↑ Pennsylvania Department of Education, Professional Qualifications of Teachers Burchfield Primary School, September 21, 2012
- ↑ Pennsylvania Department of Education, Burchfield Primary School AYP Overview 2012, 2012
- ↑ Pittsburgh Post Gazette (October 15, 2012). "How is your school doing?".
- ↑ Pennsylvania Department of Education (September 21, 2012). "Burchfield Primary School Academic Achievement Report Card 2012" (PDF).
- ↑ National Center for Education Statistics, Common Core Data – Jeffery Primary School, 2011
- ↑ Pennsylvania Department of Education, Professional Qualifications of Teachers Jeffery Primary School, September 21, 2012
- ↑ Pennsylvania Department of Education, Elementary School AYP Overview, September 21, 2012
- ↑ Pittsburgh Post Gazette (October 15, 2012). "How is your school doing?".
- ↑ Pennsylvania Department of Education, Jeffery Primary School Academic Achievement Report Card 2010, October 20, 2010
- ↑ Pennsylvania Department of Education (September 21, 2012). "Jeffery Primary School Academic Achievement Report Card 2012" (PDF).
- ↑ National Center for Education Statistics, Common Core Data – Marzolf Primary School, 2011
- ↑ Pennsylvania Department of Education, Professional Qualifications of Teachers Marzolf Primary School, September 21, 2012
- ↑ Pennsylvania Department of Education, Marzolf Primary School AYP Overview, September 21, 2012
- ↑ Pittsburgh Post Gazette (October 15, 2012). "How is your school doing?".
- ↑ Pennsylvania Department of Education, Marzolf Primary School Academic Achievement Report Card 2010, October 20, 2010
- ↑ Pennsylvania Department of Education (September 21, 2013). "Marzolf Primary School Academic Achievement Report Card 2012" (PDF).
- ↑ Pennsylvania Bureau of Special Education Services (2009–2010). "Area School District Special Education Data Report LEA Performance on State Performance Plan (SPP) Targets".
- ↑ Pennsylvania Bureau of Special Education Services (September 2008). "Area School District Special Education Data Report LEA Performance on State Performance Plan (SPP) Targets".
- ↑ Pennsylvania Bureau of Special Education (2008). "Pennsylvania Parent Guide to Special Education Services".
- ↑ Pennsylvania Department of Education - School District Administration (January 6, 2011). "Procedural Safeguards Notice".
- ↑ Pennsylvania Department of Education, Bureau of Special Education (September 2005). "Gaskin Settlement Agreement Overview Facts Sheet" (PDF).
- ↑ Pennsylvania Department of Education. "Pennsylvania Special Education Funding".
- ↑ Senator Patrick Browne (November 1, 2011). "Senate Education Committee Holds Hearing on Special Education Funding & Accountability".
- ↑ Pennsylvania Department of Education Amy Morton, Executive Deputy Secretary (November 11, 2011). "Public Hearing: Special Education Funding & Accountability Testimony".
- ↑ Baruch Kintisch Education Law Center (November 11, 2011). "Public Hearing: Special Education Funding & Accountability Testimony" (PDF).
- ↑ Amy Morton, Executive Deputy Secretary, Public Hearing: Special Education Funding & Accountability Testimony, Pennsylvania Department of Education, November 11, 2011
- ↑ US Department of Education, U.S. Department of Education Clarifies Schools' Obligation to Provide Equal Opportunity to Students with Disabilities to Participate in Extracurricular Athletics, January 25, 2013
- ↑ Pennsylvania Department of Education (July 2010). "Special Education Funding from Pennsylvania State_2010-2011".
- ↑ Pennsylvania Department of Education (2011). "Special Education Funding 2011-2012 Fiscal Year".
- ↑ Pennsylvania Department of Education, (April 2012). "Investing in PA kids,".
- ↑ Pennsylvania Department of Education (Revised December 1, 2009 Child Count (Collected July 2010)). "Gifted Students as Percentage of Total Enrollment by School District/Charter School" (PDF). Check date values in:
|date=(help) - ↑ Pennsylvania Department of Education and Pennsylvania School Board. "CHAPTER 16. Special Education For Gifted Students". Retrieved February 4, 2011.
- ↑ Pennsylvania Department of Education (March 26, 2010). "Special Education for Gifted Students Notice of Parental rights" (PDF).
- ↑ Shaler Area School Board Policy Manual, Student Wellness Policy 246, July 2006
- ↑ Probart C; McDonnell E; Weirich JE; Schilling L; Fekete V. (September 2008). "Statewide assessment of local wellness policies in Pennsylvania public school districts.". J Am Diet Assoc. 108 (9): 1497–502. doi:10.1016/j.jada.2008.06.429. PMID 18755322.
- ↑ Pennsylvania Department of Education – Division of Food and Nutrition (July 2008). "Nutrition Standards for Competitive Foods in Pennsylvania Schools for the School Nutrition Incentive".
- ↑ USDA, Child Nutrition Programs - Eligibility Manual for School Meals, 2012
- ↑ Pennsylvania Hunger Action Center, The Pennsylvania School Breakfast Report Card, 2009
- ↑ USDA, Child Nutrition Programs, June 27, 2013
- ↑ United States Department of Agriculture (2011). "Food and Nutrition Service Equity in School Lunch Pricing Fact Sheet" (PDF).
- ↑ Pennsylvania State Department of Health (2010). "Pennsylvania Bulletin Doc. No. 10-984 School Immunizations; Communicable and Noncommunicable Diseases".
- ↑ Highmark Foundation, 2009 School Challenge Grants, 2009
- ↑ PR Newswire, Highmark Healthy High 5 Health eTools for Schools Available Free Through 2009, 2007
- ↑ Pennsylvania General Assembly, Taxpayer Relief Act, Act 1 of the Special Session of 2006, June 27, 2006
- ↑ Molly Born (September 3, 2013). "Shaler Teachers Strike".
- ↑ Allegheny Institute for Public Policy (May 2012). "Teacher Strikes".
- ↑ Mary Niederberger., Laws, tax limits hinder negotiations, Pittsburgh Post-Gazette, September 5, 2013
- ↑ Pennsylvania Department of Education (2012). "Investing in Pennsylvania Students".
- ↑ "Shaler Area School District Payroll report 2011". OpenPA Gov.org. 2013.
- ↑ American Enterprise Institute, (2011). "Assessing the Compensation of Public School Teachers".
- ↑ Asbury Park Press (2009). "PA. Public School Salaries".
- ↑ Shaler Area School Board (2009). "Shaler Area School District Teacher Union Employment Contract 2010".
- ↑ Fenton, Jacob., Average classroom teacher salary in Allegheny County, 2006-07, The Morning Call March 2009
- ↑ PA Delaware County Times, Teachers need to know enough is enough, April 20, 2010.
- ↑ Fenton, Jacob. (February 2009). "Pennsylvania School District Data: Will School Consolidation Save Money?,". The Morning Call.
- ↑ Pennsylvania School Board Association (October 2009). "Public School Salaries 11th Annual".
- ↑ Pennsylvania Department of Education (2010). "2009-10 Selected Data - 2009-10 Total Expenditures per ADM".
- ↑ United States Census Bureau (2009). "States Ranked According to Per Pupil Elementary-Secondary Public School System Finance Amounts: 2008-09" (PDF).
- ↑ US Census Bureau (2009). "Total and current expenditures per pupil in fall enrollment in public elementary and secondary education, by function and state or jurisdiction: 2006-07".
- ↑ US Census Bureau (March 2003). "Public Education Finances 2000-01 Annual Survey of Local Government Finances" (PDF).
- ↑ US Census Bureau (2009). "Total and current expenditures per pupil in fall enrollment in public elementary and secondary education, by function and state or jurisdiction: 2006-07".
- ↑ United States Census Bureau (2009). "States Ranked According to Per Pupil Elementary-Secondary Public School System Finance Amounts: 2008-09" (PDF).
- ↑ US Census Bureau (May 2013). "States Ranked According to Per Pupil Public Elementary-Secondary School System Finance Amounts: Fiscal Year 2011" (PDF).
- ↑ Pennsylvania Department of Education. "Fund Balances by Local Education Agency 1997 to 2008".
- ↑ Murphy, Jan., Pennsylvania's public schools boost reserves, CentreDaily Times, September 22, 2010
- ↑ Melissa Daniels (June 1, 2013). "PA school districts look to cash stash to balance budgets". PA Independent.
- ↑ Pennsylvania Auditor General (December 2010). "Shaler Area School District Allegheny County, Pennsylvania Performance Audit Report".
- ↑ Pennsylvania Department of Education (May 2012). "Pennsylvania Public School District Tuition Rates".
- ↑ Pennsylvania Department of Revenue (April 2010). "Personal Income Taxation Guidelines".
- ↑ John Finnerty (2013). "PA teachers pensions". CNHI Harrisburg Bureau.
- ↑ Democrat Appropriations Committee, Report on Education funding by LEA, July 2, 2013
- ↑ Pennsylvania Office of the Budget, 2013-14 State Budget Highlights, 2013
- ↑ Senator Jake Corman (June 28, 2012). "Pennsylvania Education funding by Local School District" (PDF).
- ↑ Pennsylvania General Assembly Sen Jake Corman (June 29, 2012). "SB1466 of 2012 General Fund Appropriation".
- ↑ PA Senate Appropriations Committee (June 28, 2011). "School District 2011-12 Funding Report".
- ↑ Pennsylvania Department of Education (July 2011). "Basic Education Funding".
- ↑ Pennsylvania Department of Education (June 30, 2011). "Basic Education Funding".
- ↑ Pennsylvania Department of Education (June 30, 2011). "Basic Education Funding 2011-2012 Fiscal Year".
- ↑ Pennsylvania Department of Education, District Allocations Report 2009, 2009-10
- ↑ Pennsylvania House Appropriations Committee Education Budget information (June 30, 2010). "PA Basic Education Funding-Printout2 2010-2011" (PDF).
- ↑ Pennsylvania Department of Education (October 2009). "Funding Allocations by district".
- ↑ Pennsylvania Office of Budget (February 2009). "Governor's Budget Proposal 2009 Pennsylvania Department of Education Budget Proposal 2009,".
- ↑ Pennsylvania Department of Education, Funding Report by LEA, 2009
- ↑ U.S. Census Bureau., Annual Survey of Local Government Finances., 2000
- ↑ U.S. Census Bureau., 2008 Survey of Local Government Finances – School Systems, 2010
- ↑ Pennsylvania Department of Education (2010). "Accountability Block Grant report Grantee list 2010".
- ↑ Pennsylvania Department of Education (2008). "Accountability Block Grant Mid Year report".
- ↑ Pennsylvania Auditor General (December 22, 2008). "Classrooms for the Future grants audit" (PDF).
- ↑ Commonwealth of Pennsylvania (2009). "Allegheny County ARRA FUNDING Report".
- ↑ "School stimulus money". Pittsburgh Post-Gazette. March 12, 2009.
- ↑ Pennsylvania Department of Education (December 9, 2009). "Race To The Top Webinar powerpoint for districts December 2009" (PDF).
- ↑ Governor's Press Office release (January 20, 2010). "Pennsylvania's 'Race to the Top' Fueled by Effective Reforms, Strong Local Support,".
- ↑ Race to the Top Fund, U.S. Department of Education, March 29, 2010.
- ↑ Gerald Zahorchak (December 2008). "Pennsylvania Race to the Top Letter to Superintendents" (PDF).
- ↑ Pennsylvania Department of Education (January 19, 2009). "Pennsylvania Race to the Top -School Districts Title I Allocations 2009-10".
- ↑ Pennsylvania Department of Education (2007). "Common Cents program - Making Every Dollar Count".
- ↑ Bethany Hofstetter (June 26, 2013). "Tax hike coming for some residents of Shaler Area".
- ↑ Pennsylvania Department of Education (2011). "Real Estate Tax Rates by School District 2011-12 Real Estate Mills".
- ↑ Pennsylvania Department of Education (2004). "Act 511 Tax Report".
- ↑ State Tax Equalization Board (2011). "State Tax Equalization Board About US".
- ↑ Pennsylvania Auditor General office - Bureau of Audits (February 2011). "A Special Performance Audit of the Pennsylvania State Tax Equalization Boards" (PDF).
- ↑ Pennsylvania Department of Education (2010). "Real Estate Tax Millage by School District,".
- ↑ Pennsylvania Department of Education (2010). "Financial Elements Reports".
- ↑ Pennsylvania Department of Education (2009). "Financial Elements Reports 2008-09 Real Estate Mills".
- ↑ Pennsylvania Department of Education (2008). "Real Estate Tax Millage by School District,".
- ↑ Pennsylvania Department of Education (2007). "Real Estate Tax Millage by School District,".
- ↑ Pennsylvania Department of Education (2007). "Real Estate Tax Millage by School District,".
- ↑ Pennsylvania Department of Education (2010). "2010-11 Act 1 of 2006 Referendum Exception Guidelines".
- ↑ Kaitlynn Riely (August 4, 2011). "Law could restrict school construction projects". Pittsburgh Post-Gazette.
- ↑ Pennsylvania General Assembly (June 29, 2011). "SB330 of 2011".
- ↑ Eric Boehm (July 1, 2011). "Property tax reform final piece of state budget". PA Independent.
- ↑ Pennsylvania Department of Education (2011). "Special Session Act 1 of 2006 the Taxpayer Relief Act information".
- ↑ Pennsylvania Department of Education (May 2010). "Special Session Act 1 of 2006 School District Adjusted Index for 2006-2007 through 2010-2011".
- ↑ Pennsylvania Department of Education (May 2011). "2012-2013 School District Adjusted Index Listing".
- ↑ Pennsylvania Department of Education, 2013-2014 School District Adjusted Index, May 2012
- ↑ Pennsylvania Department of Education, Report on Referendum Exceptions For School Year 2013-2014, April 2013
- ↑ Pennsylvania Department of Education (2011). "Special Session Act 1 of 2006 the Taxpayer Relief Act information".
- ↑ Pennsylvania Department of Education (April 2012). "Report on Exceptions".
- ↑ Pennsylvania Department of Education (April 2011). "Report on Exceptions".
- ↑ Pennsylvania Department of Education (May 2010). "Report on Referendum Exceptions for 2010-2011".
- ↑ Pennsylvania Department of Education (May 2009). "Report on Referendum Exceptions for 2009-2010".
- ↑ Scarcella, Frank & Pursell, Tricia (May 25, 2010). "Local school tax assessments exceed state averages". The Daily Item.
- ↑ Pennsylvania Office of the Governor Press Release, (November 10, 2005). "Home-Schooled, Charter School Children Can Participate in School District Extracurricular Activities".
- ↑ Pennsylvania Interscholastic Athletics Association (2013). "PIAA School Directory".