South African municipal elections, 2011
Municipal elections were held in South Africa on 18 May 2011,[1] electing new councils for all municipalities in the country. Municipal elections are held every five years,[2] and the previous municipal elections were held in 2006. The first municipal elections following the reorganisation of municipalities took place in December 2000.
Half of the seats (rounded up for odd numbers) in each municipality are elected on the first past the post system in single member wards. The other half of the seats are allocated to restore proportionality as follows:
The total number of seats are allocated using the largest remainder method by using a modified Hare quota. Proportional seats are allocated based on the difference. Overhang seats are theoretically possible. These do not affect the quota but will reduce the number of remainder seats if any. Independent candidates are allowed for in the ward seats, and the proportionality calculations effectively ignore votes for these candidates and are adjusted for seats allocated to them.[3]
Background
The ruling party of South Africa, the African National Congress (ANC), has been facing a growing opposition from the Democratic Alliance (DA). The DA holds control of the Western Cape area, with Cape Town the major city of the province. The DA had made it known that there was a possibility of victory in the Northern Cape province.[4]
The ANC faced tough challenges from the opposition parties over issues of service delivery, corruption, healthcare reform, poverty and unemployment rates.
The Congress of the People (COPE) (a breakaway party formed from within the ANC) and the Inkatha Freedom Party (IFP) were determined to prove that they could increase their control in areas as well. Various other parties were expected to contest the elections as well; however, based on previous elections and expected changes since then, they are expected to hold a minority power relative to the ANC, DA, Cope and IFP parties respectively.
The election was generally peaceful, with the exception of an attack on an IFP councilor that resulted in his death.[5]
Cities
Former DA leader Helen Zille attempted to improve her party's success at multi-party governance in Cape Town and also bring the ANC's support under 50% in other major cities. Initial reports suggested that Port Elizabeth was the most vulnerable for the ANC, with Pretoria, Johannesburg, Ekurhuleni and almost all municipalities in the Northern Cape facing stiff challenges from the DA and COPE.
Port Elizabeth lies in a unique region roughly at the border between the Black and Coloured (i.e. mixed raced) population groups. It was predicted that there would be a strong effort from minorities in the city to try to gain control of the council. Although the Nelson Mandela Bay municipality is over 60% black, the DA hoped that by using COPE and the United Democratic Movement, the vote for the ANC could have possibly been lowered under 50% (i.e. minority power) enabling the DA to form a coalition with smaller parties and assume governance of the area. The Nelson Mandela Bay municipality was heavily contested in the elections with the ANC managing to secure 63 seats to the DA's 48 seats. Zille attributed the failure of the DA to win the metro to the decline of COPE, claiming that the latter's retention of votes could have unseated the ANC allowing a coalition government in the metro.[6]

Election boycott
The Poor People's Alliance called for a boycott of the election under the slogan No Land! No House! No Vote!.[7]
There were vote boycott campaigns by a number of civil society organisations including Soundz of the South, the Mandela Park Backyarders, the Mitchell's Plain Backyarders Association and various communities such as Blikkiesdorp in Western Cape, Morutsi in Limpopo, King William's Town and Grahamstown in the Eastern Cape, Cato Ridge in KwaZulu-Natal, Ermelo in Mpumalanga and elsewhere around the country.[8]
There was also significant abstention by ANC members and supporters who felt the selection of ANC candidates was biased but refused to vote for any other party.[9]
Election results
The statistics in this section are all sourced from the Independent Electoral Commission's official website unless specified otherwise.
The voter turnout for this election was predicted to be higher than the previous election in 2006. 23.65 million people were registered to vote (with more than five million people eligible to vote not being registered),[10] while the actual turnout of voters was 13.66 million people representing a 57.64% turnout, making it the highest voter turnout ever since the first municipal election in 2000.[11] The percentage of spoilt votes was 1.89%.
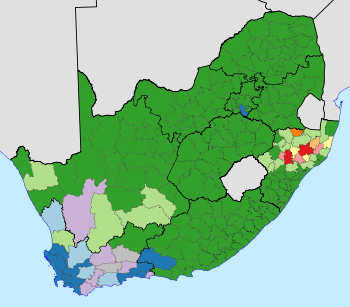
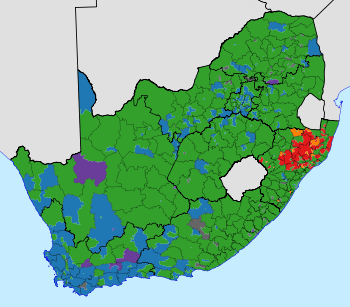
The ANC won just under 62% of the vote and the DA won just under 24% of the vote.[12] There was a decline in ANC support and an increase in support for the DA as the ANC lost voters in every province with the exception of Kwa-ZuluNatal where it captured votes from former IFP voters.[13]
| Party | Ward | PR | Ward + PR | DC | |||||
|---|---|---|---|---|---|---|---|---|---|
| Votes | % | Votes | % | Votes | % | Votes | % | ||
| African National Congress | 8,143,397 | 61.0% | 8,405,429 | 62.9% | 16,548,826 | 62.0% | 5,455,411 | 69.4% | |
| Democratic Alliance | 3,177,883 | 23.8% | 3,216,006 | 24.1% | 6,393,886 | 23.9% | 1,202,562 | 15.3% | |
| Inkatha Freedom Party | 478,400 | 3.6% | 475,621 | 3.6% | 954,021 | 3.6% | 406,319 | 5.2% | |
| National Freedom Party | 326,565 | 2.4% | 318,352 | 2.4% | 644,917 | 2.4% | 247,340 | 3.1% | |
| Congress of the People | 274,074 | 2.1% | 296,624 | 2.2% | 570,698 | 2.1% | 236,396 | 3.0% | |
| United Democratic Movement | 83,728 | 0.6% | 84,623 | 0.6% | 168,351 | 0.6% | 67,487 | 0.9% | |
| African Christian Democratic Party | 86,865 | 0.7% | 78,737 | 0.6% | 165,602 | 0.6% | 43,948 | 0.6% | |
| Freedom Front Plus | 66,588 | 0.5% | 53,931 | 0.4% | 120,519 | 0.5% | 32,640 | 0.4% | |
| Pan Africanist Congress | 63,976 | 0.5% | 54,846 | 0.4% | 118,822 | 0.4% | 28,918 | 0.4% | |
| Minority Front | 60,153 | 0.5% | 53,042 | 0.4% | 113,195 | 0.4% | 958 | 0.0% | |
| African People's Convention | 38,159 | 0.3% | 54,332 | 0.4% | 92,491 | 0.3% | 22,650 | 0.3% | |
| United Christian Democratic Party | 25,031 | 0.2% | 25,971 | 0.2% | 51,002 | 0.2% | 466 | 0.0% | |
| Azanian People's Organisation | 24,331 | 0.2% | 26,300 | 0.2% | 50,631 | 0.2% | 19,202 | 0.2% | |
| 108 other parties | 202,595 | 1.5% | 213,697 | 1.6% | 416,292 | 1.6% | 93,512 | 1.2% | |
| Independent | 302,242 | 2.3% | N/A | 302,242 | 1.1% | N/A | |||
| Total | 13,353,987 | 13,357,511 | 26,711,498 | 7,857,809 | |||||
| Spoilt votes | 235,014 | 235,345 | 470,359 | 196,248 | |||||
Note: "Ward" column indicates votes cast for individual ward councillors. "PR" column indicates proportional representation votes cast for parties in the election of local and metropolitan municipal councils. "DC" column indicate proportional representation votes cast for parties for the directly elected components of district councils. All voters cast Ward and PR ballots, but those resident in the metropolitan municipalities (approximately 40% of the population) do not cast DC ballots.
Eastern Cape
In the Eastern Cape, the ANC captured a majority in all but one municipality; the lone exception, Baviaans,was won by the DA with four seats to the ANC's three. The Nelson Mandela Bay Metro was closely contested however, with the ANC dropping 15% of the vote, but retaining a narrow majority.
| Municipality | ANC | COPE | DA | UDM | Others | Total |
|---|---|---|---|---|---|---|
| Buffalo City | 71 | 3 | 21 | 0 | 5 | 100 |
| Nelson Mandela Bay | 63 | 6 | 48 | 1 | 2 | 120 |
| Camdeboo | 8 | 0 | 6 | 0 | 0 | 14 |
| Blue Crane Route | 7 | 0 | 4 | 0 | 0 | 11 |
| Ikwezi | 5 | 0 | 2 | 0 | 0 | 7 |
| Makana | 20 | 1 | 6 | 0 | 1 | 28 |
| Ndlambe | 13 | 0 | 6 | 0 | 1 | 20 |
| Sundays River Valley | 12 | 0 | 3 | 0 | 1 | 16 |
| Baviaans | 3 | 0 | 4 | 0 | 0 | 7 |
| Kouga | 15 | 0 | 14 | 0 | 0 | 29 |
| Kou-Kamma | 6 | 0 | 5 | 0 | 0 | 11 |
| Mbhashe | 41 | 9 | 1 | 7 | 3 | 61 |
| Mnquma | 47 | 7 | 2 | 4 | 2 | 62 |
| Great Kei | 11 | 0 | 2 | 0 | 0 | 13 |
| Amahlathi | 33 | 3 | 2 | 0 | 2 | 40 |
| Ngqushwa | 24 | 0 | 1 | 0 | 0 | 25 |
| Nkonkobe | 35 | 2 | 2 | 0 | 2 | 41 |
| Nxuba | 5 | 0 | 2 | 0 | 1 | 8 |
| Inxuba Yethemba | 12 | 0 | 6 | 0 | 0 | 18 |
| Tsolwana | 7 | 1 | 1 | 0 | 1 | 10 |
| Inkwanca | 5 | 1 | 1 | 0 | 0 | 7 |
| Lukhanji | 45 | 2 | 5 | 1 | 1 | 54 |
| Intsika Yethu | 37 | 2 | 0 | 2 | 1 | 42 |
| Emalahleni | 30 | 1 | 1 | 1 | 1 | 34 |
| Engcobo | 35 | 0 | 0 | 3 | 2 | 40 |
| Sakhisizwe | 14 | 1 | 1 | 0 | 1 | 17 |
| Elundini | 28 | 0 | 2 | 2 | 2 | 34 |
| Senqu | 32 | 0 | 2 | 1 | 2 | 37 |
| Maletswai | 9 | 0 | 2 | 1 | 0 | 12 |
| Gariep | 7 | 0 | 3 | 0 | 0 | 10 |
| Ngquza Hill | 55 | 4 | 1 | 1 | 1 | 62 |
| Port St Johns | 32 | 1 | 2 | 1 | 3 | 39 |
| Nyandeni | 53 | 2 | 2 | 4 | 0 | 61 |
| Mhlontlo | 48 | 1 | 0 | 3 | 0 | 52 |
| King Sabata Dalindyebo | 46 | 2 | 2 | 18 | 2 | 70 |
| Matatiele | 39 | 2 | 3 | 1 | 7 | 52 |
| Umzimvubu | 46 | 1 | 2 | 2 | 3 | 54 |
| Mbizana | 54 | 2 | 1 | 1 | 3 | 61 |
| Ntabankulu | 31 | 2 | 1 | 1 | 1 | 36 |
| Total | 1084 | 56 | 169 | 55 | 51 | 1415 |
Free State
The ANC won a majority in every municipality in the Free State, including the newly upgraded Mangaung Metropolitan Municipality, in which it won 65 of the 97 available seats, against the DA's 26.
| Municipality | ANC | COPE | DA | Others | Total |
|---|---|---|---|---|---|
| Mangaung | 65 | 3 | 26 | 3 | 97 |
| Letsemeng | 8 | 1 | 2 | 0 | 11 |
| Kopanong | 10 | 1 | 3 | 1 | 15 |
| Mohokare | 9 | 0 | 2 | 0 | 11 |
| Naledi | 6 | 1 | 1 | 0 | 8 |
| Masilonyana | 16 | 1 | 2 | 1 | 20 |
| Tokologo | 5 | 1 | 1 | 1 | 8 |
| Tswelopele | 12 | 1 | 2 | 0 | 15 |
| Matjhabeng | 52 | 3 | 16 | 1 | 72 |
| Nala | 18 | 2 | 3 | 1 | 24 |
| Setsoto | 26 | 2 | 6 | 1 | 35 |
| Dihlabeng | 30 | 1 | 8 | 1 | 40 |
| Nketoana | 14 | 0 | 2 | 2 | 18 |
| Maluti-a-Phofung | 52 | 1 | 4 | 12 | 69 |
| Phumelela | 12 | 0 | 3 | 0 | 15 |
| Mantsopa | 13 | 1 | 3 | 0 | 17 |
| Moqhaka | 34 | 3 | 11 | 2 | 50 |
| Ngwathe | 28 | 1 | 9 | 1 | 39 |
| Metsimaholo | 26 | 0 | 15 | 1 | 42 |
| Mafube | 12 | 2 | 3 | 0 | 17 |
| Total | 448 | 25 | 122 | 28 | 623 |
Gauteng
The ANC won a majority in all but one of the municipalities in Gauteng, the lone exception being Midvaal, which was won by the DA. The following table shows the number of seats won by the various parties in the metropolitan and local municipalities in the province.
| Municipality | ANC | COPE | DA | IFP | VF+ | Others | Total |
|---|---|---|---|---|---|---|---|
| Ekurhuleni (East Rand) | 125 | 2 | 62 | 2 | 1 | 10 | 202 |
| City of Johannesburg | 153 | 3 | 90 | 4 | 1 | 9 | 260 |
| City of Tshwane (Pretoria) | 118 | 2 | 82 | 0 | 4 | 4 | 210 |
| Emfuleni | 64 | 1 | 21 | 0 | 1 | 2 | 89 |
| Midvaal | 11 | 0 | 15 | 0 | 1 | 0 | 27 |
| Lesedi | 19 | 0 | 6 | 0 | 1 | 0 | 26 |
| Mogale City (Krugersdorp) | 41 | 1 | 23 | 1 | 1 | 1 | 68 |
| Randfontein | 27 | 1 | 16 | 0 | 0 | 0 | 44 |
| Westonaria | 23 | 1 | 4 | 1 | 0 | 2 | 31 |
| Merafong City | 41 | 1 | 11 | 1 | 0 | 2 | 56 |
| Total | 622 | 11 | 330 | 9 | 10 | 30 | 1013 |
KwaZulu-Natal
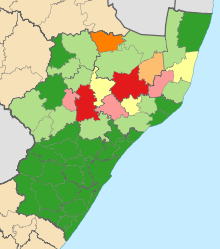
In the following table, green rows indicate municipalities won by the ANC, red rows indicate those won by the Inkatha Freedom Party (IFP), yellow rows indicate those won by the National Freedom Party (NFP), and grey rows indicate those with no majority party.
| Municipality | ANC | DA | IFP | NFP | Others | Total | Coalitions |
|---|---|---|---|---|---|---|---|
| eThekwini | 126 | 43 | 9 | 10 | 17 | 205 | |
| Vulamehlo | 12 | 0 | 2 | 5 | 0 | 20 | |
| Umdoni | 12 | 4 | 1 | 1 | 1 | 19 | |
| Umzumbe | 26 | 1 | 2 | 8 | 1 | 38 | |
| uMuziwabantu | 12 | 1 | 2 | 4 | 0 | 19 | |
| Ezingoleni | 8 | 0 | 1 | 2 | 0 | 11 | |
| Hibiscus Coast | 41 | 11 | 3 | 2 | 1 | 58 | |
| uMshwathi | 19 | 2 | 3 | 2 | 0 | 26 | |
| uMngeni | 14 | 9 | 0 | 0 | 0 | 23 | |
| Mpofana | 5 | 1 | 1 | 0 | 0 | 7 | |
| Impendle | 6 | 0 | 1 | 0 | 0 | 7 | |
| Msunduzi | 49 | 15 | 4 | 4 | 1 | 73 | |
| Mkhambathini | 9 | 1 | 3 | 1 | 0 | 14 | |
| Richmond | 11 | 1 | 0 | 0 | 2 | 14 | |
| Emnambithi/Ladysmith | 34 | 4 | 8 | 6 | 1 | 53 | |
| Indaka | 6 | 0 | 8 | 6 | 0 | 20 | ANC-NFP |
| Umtshezi | 8 | 1 | 5 | 3 | 0 | 17 | ANC-NFP |
| Okhahlamba | 13 | 1 | 8 | 6 | 0 | 28 | ANC-NFP |
| Imbabazane | 12 | 1 | 5 | 7 | 0 | 25 | ANC-NFP |
| Endumeni | 6 | 3 | 2 | 1 | 0 | 12 | ANC-NFP |
| Nquthu | 14 | 1 | 14 | 5 | 0 | 34 | ANC-NFP |
| Msinga | 12 | 0 | 21 | 4 | 0 | 37 | |
| Umvoti | 10 | 1 | 9 | 2 | 0 | 22 | ANC-NFP |
| Newcastle | 33 | 5 | 12 | 5 | 6 | 61 | |
| eMadlangeni | 4 | 1 | 2 | 1 | 0 | 8 | ANC-NFP |
| Dannhauser | 11 | 1 | 6 | 3 | 1 | 22 | ANC-NFP |
| eDumbe | 4 | 1 | 2 | 8 | 0 | 15 | |
| uPhongolo | 11 | 1 | 7 | 8 | 0 | 27 | ANC-NFP |
| Abaqulusi | 17 | 3 | 16 | 7 | 1 | 44 | ANC-NFP |
| Nongoma | 6 | 0 | 17 | 19 | 0 | 42 | NFP-ANC |
| Ulundi | 6 | 0 | 28 | 13 | 0 | 47 | |
| uMhlabuyalingana | 22 | 0 | 8 | 4 | 0 | 34 | |
| Jozini | 20 | 0 | 16 | 4 | 0 | 40 | ANC-NFP |
| The Big Five False Bay | 3 | 0 | 3 | 1 | 0 | 7 | ANC-NFP |
| Hlabisa | 4 | 0 | 8 | 4 | 0 | 16 | ANC-NFP |
| Mtubatuba | 16 | 0 | 15 | 7 | 0 | 38 | ANC-NFP |
| Mbonambi | 17 | 0 | 10 | 3 | 0 | 30 | |
| uMhlathuze | 36 | 6 | 10 | 6 | 2 | 60 | |
| Ntambanana | 7 | 0 | 6 | 3 | 0 | 16 | ANC-NFP |
| uMlalazi | 24 | 1 | 18 | 9 | 0 | 52 | ANC-NFP |
| Mthonjaneni | 5 | 0 | 5 | 1 | 0 | 11 | ANC-NFP |
| Nkandla | 11 | 0 | 13 | 3 | 0 | 27 | ANC-NFP |
| Mandeni | 23 | 1 | 4 | 6 | 0 | 34 | |
| KwaDukuza | 37 | 8 | 4 | 2 | 2 | 53 | |
| Ndwedwe | 25 | 1 | 5 | 5 | 1 | 37 | |
| Maphumulo | 12 | 0 | 8 | 2 | 0 | 22 | |
| Ingwe | 16 | 1 | 3 | 2 | 0 | 22 | |
| Kwa Sani | 5 | 2 | 0 | 0 | 0 | 7 | |
| Greater Kokstad | 12 | 3 | 0 | 0 | 1 | 16 | |
| Ubuhlebezwe | 18 | 1 | 2 | 3 | 0 | 24 | |
| Umzimkhulu | 36 | 0 | 1 | 2 | 1 | 40 | |
| Total | 906 | 137 | 341 | 210 | 39 | 1633 |
Limpopo
The ANC's complete dominance of Limpopo remained unchallenged as other parties achieved only small minorities.
| Municipality | ANC | COPE | DA | Others | Total |
|---|---|---|---|---|---|
| Greater Giyani | 50 | 0 | 2 | 8 | 60 |
| Greater Letaba | 51 | 4 | 1 | 1 | 57 |
| Greater Tzaneen | 59 | 2 | 5 | 2 | 68 |
| Ba-Phalaborwa | 29 | 2 | 4 | 1 | 36 |
| Maruleng | 19 | 2 | 2 | 4 | 27 |
| Musina | 9 | 1 | 0 | 2 | 12 |
| Mutale | 23 | 1 | 1 | 1 | 26 |
| Thulamela | 70 | 2 | 3 | 5 | 80 |
| Makhado | 64 | 3 | 5 | 3 | 75 |
| Blouberg | 37 | 1 | 2 | 1 | 41 |
| Aganang | 32 | 2 | 1 | 2 | 37 |
| Molemole | 24 | 1 | 1 | 1 | 27 |
| Polokwane | 61 | 3 | 9 | 3 | 76 |
| Lepelle-Nkumpi | 47 | 4 | 2 | 4 | 57 |
| Thabazimbi | 16 | 0 | 5 | 2 | 23 |
| Lephalale | 20 | 1 | 3 | 24 | |
| Mookgophong | 6 | 1 | 2 | 1 | 10 |
| Modimolle | 13 | 0 | 4 | 1 | 18 |
| Bela-Bela | 12 | 0 | 4 | 1 | 17 |
| Mogalakwena | 53 | 2 | 5 | 3 | 63 |
| Ephraim Mogale | 23 | 1 | 2 | 6 | 32 |
| Elias Motsoaledi | 41 | 1 | 4 | 14 | 60 |
| Makhuduthamaga | 52 | 3 | 1 | 5 | 61 |
| Fetakgomo | 21 | 2 | 1 | 1 | 25 |
| Greater Tubatse | 50 | 3 | 3 | 6 | 62 |
| Total | 882 | 42 | 72 | 78 | 1074 |
Mpumalanga
The ANC's control of this province was not significantly challenged with the DA only gaining some support in the more urbanised municipalities.
| Municipality | ANC | COPE | DA | Others | Total |
|---|---|---|---|---|---|
| Albert Luthuli | 44 | 1 | 3 | 1 | 49 |
| Msukaligwa | 31 | 1 | 5 | 1 | 38 |
| Mkhondo | 28 | 0 | 6 | 4 | 38 |
| Pixley ka Seme | 16 | 0 | 3 | 2 | 21 |
| Lekwa | 23 | 0 | 6 | 1 | 30 |
| Dipaleseng | 7 | 0 | 2 | 3 | 12 |
| Govan Mbeki | 45 | 1 | 16 | 1 | 63 |
| Delmas | 13 | 0 | 3 | 1 | 17 |
| Emalahleni | 49 | 0 | 18 | 1 | 68 |
| Steve Tshwete | 39 | 1 | 17 | 1 | 58 |
| Emakhazeni | 11 | 0 | 4 | 0 | 15 |
| Thembisile Hani | 51 | 0 | 4 | 9 | 64 |
| Dr JS Moroka | 52 | 1 | 4 | 5 | 62 |
| Thaba Chweu | 20 | 0 | 6 | 1 | 27 |
| Mbombela | 66 | 0 | 10 | 2 | 78 |
| Umjindi | 15 | 0 | 3 | 0 | 18 |
| Nkomazi | 60 | 0 | 4 | 1 | 65 |
| Bushbuckridge | 55 | 3 | 3 | 13 | 74 |
| Total | 625 | 8 | 117 | 47 | 797 |
North West
The North West remains firmly under ANC control with the DA getting some support in the larger towns.
| Municipality | ANC | COPE | DA | Others | Total |
|---|---|---|---|---|---|
| Moretele | 46 | 1 | 3 | 5 | 55 |
| Madibeng | 54 | 1 | 14 | 3 | 72 |
| Rustenburg | 55 | 1 | 15 | 5 | 76 |
| Kgetlengrivier | 9 | 0 | 3 | 12 | |
| Moses Kotane | 49 | 4 | 3 | 6 | 62 |
| Ratlou | 22 | 2 | 1 | 3 | 28 |
| Tswaing | 22 | 0 | 7 | 1 | 30 |
| Mafikeng | 44 | 3 | 7 | 8 | 62 |
| Ditsobotla | 32 | 1 | 7 | 2 | 42 |
| Ramotshere Moiloa | 29 | 2 | 2 | 6 | 39 |
| Naledi | 12 | 1 | 5 | 0 | 18 |
| Mamusa | 12 | 1 | 2 | 0 | 15 |
| Greater Taung | 43 | 2 | 3 | 3 | 51 |
| Lekwa-Teemane | 10 | 1 | 3 | 0 | 14 |
| Kagisano-Molopo | 24 | 1 | 2 | 3 | 30 |
| Ventersdorp | 10 | 0 | 2 | 0 | 12 |
| Tlokwe | 30 | 1 | 19 | 2 | 52 |
| Matlosana | 51 | 1 | 16 | 2 | 70 |
| Maquassi Hills | 17 | 1 | 3 | 0 | 21 |
| Total | 571 | 24 | 117 | 49 | 761 |
Northern Cape
The ANC's control in this province was challenged only in the thinly populated Afrikaans speaking Karoo areas adjoining the DA dominated Western Cape. The more densely populated and Tswana dominated northern districts remain firmly in the hands of the ANC.
| Municipality | ANC | COPE | DA | Others | Total | Coalitions |
|---|---|---|---|---|---|---|
| Richtersveld | 5 | 0 | 3 | 0 | 8 | |
| Nama Khoi | 8 | 3 | 6 | 0 | 17 | DA-COPE |
| Kamiesberg | 4 | 1 | 2 | 0 | 7 | |
| Hantam | 4 | 1 | 4 | 0 | 9 | DA-COPE |
| Karoo Hoogland | 3 | 2 | 2 | 0 | 7 | COPE-DA |
| Khâi-Ma | 4 | 2 | 1 | 0 | 7 | |
| Ubuntu | 4 | 1 | 3 | 0 | 8 | ANC[14] |
| Umsobomvu | 7 | 2 | 1 | 0 | 10 | |
| Emthanjeni | 7 | 1 | 5 | 1 | 14 | ANC-IND |
| Kareeberg | 4 | 1 | 2 | 0 | 7 | |
| Renosterberg | 4 | 2 | 1 | 0 | 7 | |
| Thembelihle | 5 | 2 | 1 | 0 | 8 | |
| Siyathemba | 4 | 2 | 1 | 0 | 7 | |
| Siyancuma | 7 | 2 | 2 | 0 | 11 | |
| Mier | 4 | 1 | 2 | 0 | 7 | |
| Kai !Garib | 10 | 3 | 4 | 0 | 17 | |
| //Khara Hais | 16 | 4 | 7 | 0 | 27 | |
| !Kheis | 4 | 2 | 1 | 0 | 7 | |
| Tsantsabane | 6 | 1 | 2 | 2 | 11 | |
| Kgatelopele | 5 | 1 | 2 | 0 | 8 | |
| Sol Plaatje | 40 | 5 | 16 | 1 | 62 | |
| Dikgatlong | 10 | 1 | 2 | 0 | 13 | |
| Magareng | 6 | 1 | 2 | 0 | 9 | |
| Phokwane | 13 | 1 | 3 | 1 | 18 | |
| Joe Morolong | 23 | 3 | 1 | 2 | 29 | |
| Ga-Segonyana | 20 | 1 | 3 | 1 | 25 | |
| Gamagara | 6 | 1 | 3 | 0 | 10 | |
| Total | 233 | 47 | 82 | 8 | 370 |
Western Cape
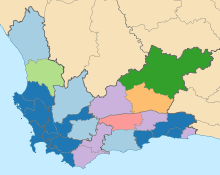
The Western Cape swung heavily to the DA, which won outright the City of Cape Town metropolitan municipality, as well as 11 of the 24 local municipalities in the province. In a further four local municipalities the DA was the largest party but did not hold a majority of seats. The ANC won outright only the Beaufort West Local Municipality, and was the largest party in the Cederberg Local Municipality but did not hold a majority there. Five local municipalities were evenly split between the ANC and the DA, with other parties holding the balance of power. In the Kannaland Local Municipality, the Independent Civic Organisation of South Africa won a plurality of three seats while the ANC and the DA won two each; a similar situation obtained in the Prince Albert Local Municipality, where the Karoo Gemeenskaps Party won three seats and the ANC and the DA two each.
In the following table, blue rows indicate municipalities won by the DA, green rows indicate those won by the ANC, and grey rows indicate those with no majority party.
| Municipality | ANC | COPE | DA | Others | Total |
|---|---|---|---|---|---|
| City of Cape Town | 73 | 3 | 135 | 10 | 221 |
| Matzikama | 6 | 0 | 7 | 2 | 15 |
| Cederberg | 5 | 1 | 4 | 1 | 11 |
| Bergrivier | 5 | 1 | 7 | 0 | 13 |
| Saldanha Bay | 8 | 1 | 15 | 1 | 25 |
| Swartland | 6 | 1 | 15 | 1 | 23 |
| Witzenberg | 8 | 1 | 10 | 4 | 23 |
| Drakenstein | 19 | 2 | 35 | 5 | 61 |
| Stellenbosch | 11 | 1 | 25 | 6 | 43 |
| Breede Valley | 14 | 1 | 22 | 4 | 41 |
| Langeberg | 7 | 1 | 11 | 4 | 23 |
| Theewaterskloof | 9 | 1 | 13 | 2 | 25 |
| Overstrand | 9 | 0 | 15 | 1 | 25 |
| Cape Agulhas | 4 | 0 | 4 | 1 | 9 |
| Swellendam | 4 | 0 | 4 | 1 | 9 |
| Kannaland | 2 | 0 | 2 | 3 | 7 |
| Hessequa | 6 | 1 | 7 | 1 | 15 |
| Mossel Bay | 10 | 0 | 16 | 1 | 27 |
| George | 19 | 1 | 25 | 4 | 49 |
| Oudtshoorn | 11 | 1 | 11 | 2 | 25 |
| Knysna | 7 | 1 | 10 | 1 | 19 |
| Bitou | 6 | 1 | 6 | 0 | 13 |
| Laingsburg | 3 | 1 | 3 | 0 | 7 |
| Prince Albert | 2 | 0 | 2 | 3 | 7 |
| Beaufort West | 7 | 0 | 5 | 1 | 13 |
| Total | 261 | 20 | 409 | 58 | 748 |
References
- ↑ "Local Elections on 18 May". BuaNews. 3 March 2011. Retrieved 9 March 2011.
- ↑ Section 159 in Chapter 7 of the Constitution of South Africa. A municipal council's term expires after 5 years, but the council continue with its functions until the election of a new council, which must be held within 90 days of the expiry of the council's term.
- ↑ Schedule 1 to the Local Government: Municipal Structures Act, No. 117 of 1998, as amended.
- ↑ http://fromtheold.com/south-african-municipal-election-2011
- ↑ IFP councillor dies after alleged assault
- ↑ "ANC wins Nelson Mandela Bay". Times Live. 19 May 2011. Retrieved 21 May 2011.
- ↑ W Cape voters ‘not predictable’, Quinton Mtyala and Babalo Ndenze, The Cape Argus, 18 May 2011
- ↑ (These citations relate to various boycott campaigns in different localities.)
- Residents to boycott elections over houses, Moses Mackay, Sowetan, 17 May 2011
- Backyarders refuse to vote, Zara Nicholson, IOL, 19 May 2011
- Angry Residents Won't Vote, Luzuko Pongoma, TNA, 2 May 2011
- Local not so lekker for citizens in rural Limpopo
- We won’t vote for ‘a stranger’, Vuvu Vena, The Daily Dispatch, 19 May 2011
- Disillusioned voters snub Ficksburg poll, Kwanele Sosibo, Mail & Guardian, 20 May 2011
- ANC choice of candidate sparks political unrest. 20 May 2011, KARREN BOWDEN AND LEANNE JANSEN, The Mercury
- Unhappy Tantyi residents stay away from polls. Thembeni Plaatjie, Grocott's Mail, 20 May 2011
- ↑ We won’t vote for ‘a stranger’, Vuvu Vena, Dispatch, 19 May 2011
- ↑ Devil in the Data: South Africa's Rich Overrepresented in the Vote, by Ebrahim-Khalil Hassen, SACSIS, 3 June 2011
- ↑ "Voter turnout highest ever - IEC". 21 May 2011. Retrieved 21 May 2011.
- ↑ Zuma is the loser, despite ANC poll win, Business Day, 23 May 2011
- ↑ ‘The swing’s the thing’ that shows the political trend, Alistair Sparks, Business Day, 25 May 2011
- ↑ http://www.news24.com/Archives/City-Press/Ancestors-shine-on-ANCs-coin-toss-20150430
External links
| General elections | |
|---|---|
| Municipal elections | |
| Referendums | |
| |