Spanish regional elections, 2011
Spanish regional elections, 2011
|
|
|
|
All 824 seats of the regional parliaments of Aragon, Asturias, Balearic Islands,
Canary Islands, Cantabria, Castile-La Mancha, Castile and León, Extremadura,
Madrid, Murcia, Navarre, La Rioja and Valencia |
| Registered |
19,319,332 |
| Turnout |
13,025,799 (67.4%)
 0.9 pp 0.9 pp |
| |
Majority party |
Minority party |
Third party |
| |
.jpg) |
.jpg) |
 |
| Leader |
Mariano Rajoy |
José Luis Rodríguez Zapatero |
Cayo Lara |
| Party |
PP |
PSOE |
IU |
| Leader since |
2 September 2003 |
22 July 2000 |
14 December 2008 |
| Last election |
367 seats, 45.5% |
327 seats, 37.0% |
28 seats, 6.0% |
| Seats won |
410 |
261 |
34 |
| Seat change |
 43 43 |
66 |
6 |
| Popular vote |
5,895,839 |
3,682,916 |
795,242 |
| Percentage |
46.0% |
28.8% |
6.2% |
| Swing |
0.5 pp |
8.2 pp |
0.2 pp |
|
|
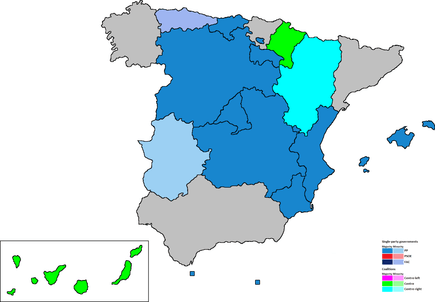
| Regional administrations after the 2011 elections. |
|
The 2011 Spanish regional elections were held on Sunday, 22 May 2011 in Spain, to elect the regional parliaments of 13 of the 17 autonomous communities: Aragon, Asturias, the Balearic Islands, the Canary Islands, Cantabria, Castile-La Mancha, Castile and León, Extremadura, Madrid, Murcia, Navarre, La Rioja and the Valencian Community. Andalusia, Catalonia, Galicia and the Basque Country did not held elections that day because they had separate electoral cycles. Municipal elections were held throughout Spain the same day.[1]
The days before the elections were marked by the protests which had been held in different cities across Spain since 15 May.
The elections resulted in a landslide victory for the opposition People's Party (PP). The governing Spanish Socialist Workers' Party (PSOE) was beaten in every region, including Extremadura and Castile-La Mancha, which the party had held since the first regional elections in 1983. The PP won outright majorities in 8 out of the 13 communities, and was able to govern in another 2 through pacts.
Following the election, the PSOE named Deputy Prime Minister Alfredo Pérez Rubalcaba as prime ministerial candidate for the incoming general election, initially scheduled for March 2012 but finally held in November 2011.[2]
Election date
The determination of the election date varied depending on the autonomous community, as they had different regulations. Initially, regional presidents didn't have the power to dissolve the regional parliaments and call elections of their own, but this notion evolved over time throughout different reforms of the autonomies' electoral laws and/or Statutes of Autonomy.
- The presidents of the Valencian Community (from 2006), Aragon, the Balearic Islands, Castile and León (2007) and Navarre (2010) could dissolve the regional legislatures and hold elections at any time different than the date set by law (usually the fourth Sunday of May).
- The presidents of Madrid (from 1990), Castile-La Mancha (1997), Cantabria, Murcia (1998), Asturias, Extremadura and La Rioja (1999) could dissolve the regional legislatures and hold elections at a time different than the date set by law, but these did not change the period to the next ordinary election, with newly elected MPs merely serving out what remained of the previous projected four-year parliamentary term.
- By the time of the 2011 regional elections, the President of the Canary Islands was the only chief of a regional government that hadn't been granted the power to dissolve the regional legislature, and elections in Canarias were only held at the fixed date set by law.[3]
The fourth Sunday of May 2011 was 22 May, and elections were set to be held that day.
Regional governments
National results
Summary of the 22 May 2011 Spanish regional election results
| Party |
Vote |
Seats |
| Votes |
% |
±pp |
Won |
+/− |
|
People's Party (PP) |
5,932,745 | 46.10 | |
410 | |
|
Spanish Socialist Workers' Party (PSOE) |
3,689,200 | 28.67 | |
261 | |
|
United Left (IU) |
791,614 | 6.15 | |
34 | |
|
Union, Progress and Democracy (UPyD) |
417,377 | 3.24 | New |
8 | |
|
Canarian Coalition (CC) |
225,948 | 1.76 | |
21 | |
|
Asturias Forum (FAC) |
178,031 | 1.38 | New |
16 | |
|
Commitment Coalition (Compromís) |
176,213 | 1.37 | New |
6 | |
|
Navarrese People's Union (UPN) |
111,474 | 0.87 | |
19 | |
|
Regionalist Party of Cantabria (PRC) |
98,887 | 0.77 | |
12 | |
|
New Canaries (NCa) |
82,148 | 0.64 | |
3 | |
|
Aragonese Party (PAR) |
62,193 | 0.48 | |
7 | |
|
Aragonese Union (CHA) |
55,932 | 0.43 | |
4 | |
|
Yes to Navarre 2011 (NaBai 2011) |
49,827 | 0.39 | |
8 | |
|
Bildu (Bildu) |
42,916 | 0.33 | New |
7 | |
|
Socialist Party of Majorca (PSM) |
40,472 | 0.31 | |
5 | |
|
Leonese People's Union (UPL) |
26,660 | 0.21 | |
1 | |
|
Riojan Party (PR) |
8,983 | 0.07 | |
2 | |
|
Others |
877,509 | 6.82 | |
0 | |
|
Blank ballots |
317,657 | 2.47 | |
|
| |
| Total |
12,868,129 | 100.00 | |
824 | |
| |
| Valid votes |
12,868,129 | 98.32 | |
|
| Invalid votes |
220,262 | 1.68 | |
| Votes cast / turnout |
13,088,391 | 67.62 | |
| Abstentions |
6,268,657 | 32.38 | |
| Registered voters |
19,357,048 | |
| |
| Source: Argos Information Portal |
Results
Autonomous communities
| Party |
Votes |
% |
Seats |
| Prev. |
2011 |
±pp |
Prev. |
2011 |
+/− |
| Aragon |
|
People's Party (PP) |
269,729 |
31.1% |
39.7% |
8.6 |
23 |
30 |
7 |
|
Spanish Socialist Workers' Party (PSOE) |
197,189 |
41.1% |
29.0% |
12.1 |
30 |
22 |
8 |
|
Aragonese Party (PAR) |
62,193 |
12.1% |
9.2% |
2.9 |
9 |
7 |
2 |
|
Aragonese Union (CHA) |
55,932 |
8.1% |
8.2% |
0.1 |
4 |
4 |
±0 |
|
United Left (IU) |
41,874 |
4.1% |
6.2% |
2.1 |
1 |
4 |
3 |
| Asturias |
|
Spanish Socialist Workers' Party (PSOE) |
179,619 |
42.0% |
29.9% |
12.1 |
21 |
15 |
6 |
|
Asturias Forum (FAC) |
178,031 |
– |
29.7% |
New |
– |
16 |
16 |
|
People's Party (PP) |
119,767 |
41.5% |
20.0% |
21.5 |
20 |
10 |
10 |
|
United Left (IU) |
61,703 |
9.7% |
10.3% |
0.6 |
4 |
4 |
±0 |
| Balearic Islands |
|
People's Party (PP) |
196,214 |
46.5% |
46.7% |
0.2 |
29 |
35 |
6 |
|
Spanish Socialist Workers' Party (PSOE) |
102,724 |
32.2% |
24.4% |
7.8 |
20 |
18 |
2 |
|
Socialist Party of Majorca (PSM) |
39,904 |
9.8% |
9.5% |
0.3 |
3 |
5 |
2 |
|
United Left (IU) |
13,270 |
w.BpM |
3.2% |
New |
3 |
0 |
3 |
|
Convergence for the Isles (CxI) |
11,913 |
6.7% |
2.8% |
3.9 |
3 |
0 |
3 |
|
Republican Left of Catalonia (ERC) |
5,325 |
w.PSOE |
1.3% |
New |
1 |
0 |
1 |
|
People for Formentera (GxF) |
1,904 |
0.3% |
0.5% |
0.2 |
0 |
1 |
1 |
| Canary Islands |
|
People's Party (PP) |
289,381 |
24.0% |
31.9% |
7.9 |
15 |
21 |
6 |
|
Canarian Coalition (CC) |
225,948 |
29.2% |
24.9% |
4.3 |
19 |
21 |
2 |
|
Spanish Socialist Workers' Party (PSOE) |
190,028 |
34.5% |
21.0% |
13.5 |
26 |
15 |
11 |
|
New Canaries (NC) |
82,148 |
5.4% |
9.1% |
3.7 |
0 |
3 |
3 |
| Cantabria |
|
People's Party (PP) |
156,499 |
41.5% |
46.1% |
4.6 |
17 |
20 |
3 |
|
Regionalist Party of Cantabria (PRC) |
98,887 |
28.6% |
29.1% |
0.5 |
12 |
12 |
±0 |
|
Spanish Socialist Workers' Party (PSOE) |
55,541 |
24.5% |
16.4% |
8.1 |
10 |
7 |
3 |
| Castile and León |
|
People's Party (PP) |
739,505 |
49.2% |
51.6% |
2.4 |
48 |
53 |
5 |
|
Spanish Socialist Workers' Party (PSOE) |
425,777 |
37.7% |
29.7% |
8.0 |
33 |
29 |
4 |
|
United Left (IU) |
69,872 |
3.1% |
4.9% |
1.8 |
0 |
1 |
1 |
|
Leonese People's Union (UPL) |
26,660 |
2.7% |
1.9% |
0.8 |
2 |
1 |
1 |
| Castile-La Mancha |
|
People's Party (PP) |
564,954 |
42.4% |
48.1% |
5.7 |
21 |
25 |
4 |
|
Spanish Socialist Workers' Party (PSOE) |
509,738 |
52.0% |
43.4% |
8.6 |
26 |
24 |
2 |
| Community of Madrid |
|
People's Party (PP) |
1,548,306 |
53.3% |
51.7% |
1.6 |
67 |
72 |
5 |
|
Spanish Socialist Workers' Party (PSOE) |
786,297 |
33.6% |
26.3% |
7.3 |
42 |
36 |
6 |
|
United Left (IU) |
287,707 |
8.9% |
9.6% |
0.7 |
11 |
13 |
2 |
|
Union, Progress and Democracy (UPyD) |
189,055 |
– |
6.3% |
New |
– |
8 |
8 |
| Extremadura |
|
People's Party (PP) |
307,975 |
38.7% |
46.1% |
7.4 |
27 |
32 |
5 |
|
Spanish Socialist Workers' Party (PSOE) |
290,045 |
53.0% |
43.4% |
9.6 |
38 |
30 |
8 |
|
United Left (IU) |
38,157 |
4.5% |
5.7% |
1.2 |
0 |
3 |
3 |
| La Rioja |
|
People's Party (PP) |
85,975 |
48.8% |
52.0% |
3.3 |
17 |
20 |
3 |
|
Spanish Socialist Workers' Party (PSOE) |
50,169 |
40.4% |
30.3% |
10.1 |
14 |
11 |
3 |
|
Riojan Party (PR) |
8,983 |
6.0% |
5.4% |
0.6 |
2 |
2 |
±0 |
| Murcia |
|
People's Party (PP) |
382,871 |
58.3% |
58.8% |
0.5 |
29 |
33 |
4 |
|
Spanish Socialist Workers' Party (PSOE) |
155,506 |
32.0% |
23.9% |
8.1 |
15 |
11 |
4 |
|
United Left (IU) |
50,988 |
6.3% |
7.8% |
1.5 |
1 |
1 |
±0 |
| Navarre |
|
Navarrese People's Union (UPN) |
111,474 |
42.2% |
34.5% |
7.7 |
22 |
19 |
3 |
|
Spanish Socialist Workers' Party (PSOE) |
51,238 |
22.5% |
15.9% |
6.6 |
12 |
9 |
3 |
|
Yes to Navarre (NaBai) |
49,827 |
23.6% |
15.4% |
8.2 |
12 |
8 |
4 |
|
Unite (Bildu) |
42,916 |
– |
13.3% |
New |
– |
7 |
7 |
|
People's Party (PP) |
23,551 |
– |
7.3% |
New |
– |
4 |
4 |
|
Left (I-E) |
18,457 |
4.3% |
5.7% |
1.4 |
2 |
3 |
1 |
|
Democrats' Convergence of Navarre (CDN) |
4,654 |
4.4% |
1.4% |
3.0 |
2 |
0 |
2 |
| Valencian Community |
|
People's Party (PP) |
1,211,112 |
52.5% |
49.4% |
3.1 |
54 |
55 |
1 |
|
Spanish Socialist Workers' Party (PSOE) |
687,141 |
34.5% |
28.0% |
6.5 |
38 |
33 |
5 |
|
Commitment Coalition (Compromís) |
176,213 |
– |
7.2% |
New |
– |
6 |
6 |
|
United Left (IU) |
144,703 |
8.0% |
5.9% |
2.1 |
7 |
5 |
2 |
Autonomous cities
References
External links
|
|---|
|
| General elections | |
|---|
|
| European elections | |
|---|
|
| Local elections | |
|---|
|
| Regional elections | |
|---|
|
| Referendums | |
|---|
|
- See also: Elections and referendums in Andalusia
- Aragon
- Asturias
- Balearic Islands
- Basque Country
- Canary Islands
- Cantabria
- Castile and León
- Castile-La Mancha
- Catalonia
- Extremadura
- Galicia
- Madrid
- Murcia
- Navarre
- La Rioja
- Valencian Community
|