Kansas's 3rd congressional district
| Kansas's 3rd congressional district | ||
|---|---|---|
.tif.png) | ||
| Current Representative | Kevin Yoder (R–Overland Park) | |
| Distribution | 94.65% urban, 5.35% rural | |
| Population (2000) | 672,124 | |
| Median income | $51,118 | |
| Ethnicity | 82.7% White, 8.9% Black, 2.6% Asian, 6.8% Hispanic, 0.7% Native American, 1.2% other | |
| Cook PVI | R+5[1] | |
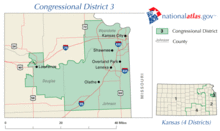
Kansas's 3rd congressional district is a congressional district in the U.S. state of Kansas. Located in eastern Kansas, the district encompasses Wyandotte and Johnson counties, which include the Kansas City Metropolitan Area. The district includes Kansas City and the surrounding suburbs of Overland Park, Lenexa, Shawnee, and Olathe.
The district is currently represented by Republican Kevin Yoder.
Demographics
Following redistricting after the 2000 U.S. Census,[2] there were 672,124 people, 258,439 households, and 173,022 families residing in the district. The population density was 864.4/mi² over a land area of 778 square miles (2,020 km2). There were 272,721 housing units at an average density of 350.7/mi². The racial makeup of the district is 82.70% White, 8.88% Black or African American, 2.60% Asian, 0.70% Native American, 0.04% Pacific Islander, 3.09% from other races, and 1.99% from two or more races. Hispanic or Latino of any race were 6.79% of the population.
There were 258,439 households out of which 36.52% had children under the age of 18 living with them, 53.21% were married couples living together, 10.27% had a female householder with no husband present, and 33.05% were non-families. 26.12% of all households were made up of individuals and 7.35% had someone living alone who was 65 years of age or older. The average household size was 2.55 and the average family size was 3.11.
In the district the population distribution by age is 26.60% under the age of 18, 10.49% from 18 to 24, 31.65% from 25 to 44, 21.17% from 45 to 64, and 10.09% who were 65 years of age or older. The median age was 33.6 years. For every 100 females there were 95.78 males. For every 100 females age 18 and over, there were 92.54 males.
The median income for a household in the district is $51,118, and the median income for a family was $62,695. Males had a median income of $42,348 versus $30,353 for females. The per capita income for the district was $26,133. About 4.9% of families and 7.8% of the population were below the poverty line, including 8.7% of those under age 18 and 6.0% of those age 65 or over.
Among the population aged 16 years and older, 71.0% was in the civilian labor force and 0.1% were in the armed forces. Of the employed civilian workers, 12.8% were government workers and 5.6% were self-employed. Management, professional, and related occupations employed 41.5% of the work force and sales and office occupations an additional 28.8%. Only 0.2% were employed in farming, fishing, and forestry occupations. The largest employment by industry was: educational, health and social services, 19.8%; professional, scientific, management, administrative, and waste management services, 12.0%; retail trade, 11.8%; and manufacturing, 10.4%. Agriculture, forestry, fishing and hunting, and mining industries only employed 0.4%.
List of representatives
| Representative | Party | Years | District home | Note |
|---|---|---|---|---|
| District created |
March 4, 1875 | |||
 William Ripley Brown William Ripley Brown |
Republican | March 4, 1875 – March 3, 1877 | Emporia | Lost renomination |
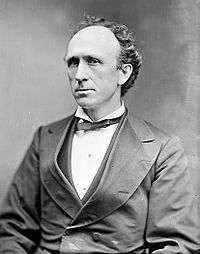 Thomas Ryan Thomas Ryan |
Republican | March 4, 1877 – March 3, 1885 | Topeka | Redistricted to 4th district |
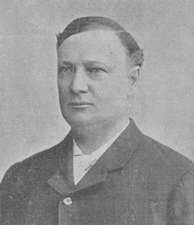 Bishop W. Perkins Bishop W. Perkins |
Republican | March 4, 1885 – March 3, 1891 | Parsons | Redistricted from At-large district |
.jpg) Benjamin H. Clover Benjamin H. Clover |
March 4, 1891 – March 3, 1893 | Douglass | ||
.jpg) Thomas J. Hudson Thomas J. Hudson |
March 4, 1893 – March 3, 1895 | Fredonia | ||
.jpg) Snyder S. Kirkpatrick Snyder S. Kirkpatrick |
Republican | March 4, 1895 – March 3, 1897 | Fredonia | |
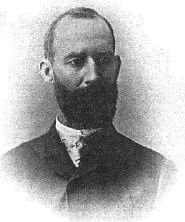 Edwin R. Ridgely Edwin R. Ridgely |
March 4, 1897 – March 3, 1901 | Girard | ||
.jpg) Alfred M. Jackson Alfred M. Jackson |
Democratic | March 4, 1901 – March 3, 1903 | Winfield | |
 Philip P. Campbell Philip P. Campbell |
Republican | March 4, 1903 – March 3, 1923 | Pittsburg | |
 William H. Sproul William H. Sproul |
Republican | March 4, 1923 – March 3, 1931 | Sedan | |
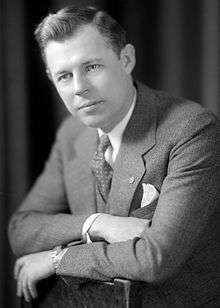 Harold C. McGugin Harold C. McGugin |
Republican | March 4, 1931 – January 3, 1935 | Coffeyville | |
 Edward W. Patterson Edward W. Patterson |
Democratic | January 3, 1935 – January 3, 1939 | Pittsburg | |
 Thomas D. Winter Thomas D. Winter |
Republican | January 3, 1939 – January 3, 1947 | Girard | |
.jpg) Herbert A. Meyer Herbert A. Meyer |
Republican | January 3, 1947 – October 2, 1950 | Independence | Died |
| Vacant |
October 2, 1950 – November 7, 1950 | |||
.jpg) Myron V. George Myron V. George |
Republican | November 7, 1950 – January 3, 1959 | Altamont | |
.png) Denver D. Hargis Denver D. Hargis |
Democratic | January 3, 1959 – January 3, 1961 | Coffeyville | |
 Walter Lewis McVey, Jr. Walter Lewis McVey, Jr. |
Republican | January 3, 1961 – January 3, 1963 | Independence | |
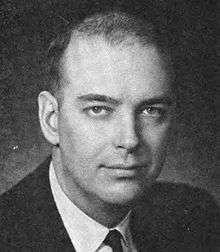 Robert Fred Ellsworth Robert Fred Ellsworth |
Republican | January 3, 1963 – January 3, 1967 | Lawrence | Redistricted from the 2nd district |
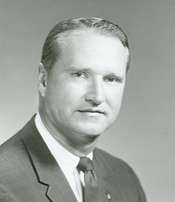 Larry Winn Larry Winn |
Republican | January 3, 1967 – January 3, 1985 | Prairie Village | |
.jpg) Jan Meyers Jan Meyers |
Republican | January 3, 1985 – January 3, 1997 | Overland Park | |
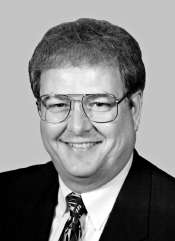 Vince Snowbarger Vince Snowbarger |
Republican | January 3, 1997 –January 3, 1999 | Olathe | |
| |
Democratic | January 3, 1999 – January 3, 2011 | Lenexa | |
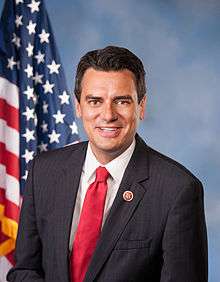 Kevin Yoder Kevin Yoder |
Republican | January 3, 2011 – present | Overland Park | Incumbent |
Recent Election Results
2002
| Party | Candidate | Votes | % | |
|---|---|---|---|---|
| Democratic | Dennis Moore* | 107,931 | 50.16 | |
| Republican | Adam Taff | 100,999 | 46.93 | |
| Reform | Dawn Bly | 4,934 | 2.29 | |
| Libertarian | Doug Martin | 1,328 | 0.62 | |
| Total votes | 215,192 | 100.00 | ||
| Voter turnout | % | |||
| Democratic hold | ||||
2004
| Party | Candidate | Votes | % | |
|---|---|---|---|---|
| Democratic | Dennis Moore* | 184,050 | 54.82 | |
| Republican | Kris Kobach | 145,542 | 43.35 | |
| Libertarian | Joe Bellis | 3,191 | 0.95 | |
| Reform | Richard Wells | 2,956 | 0.88 | |
| Total votes | 335,739 | 100.00 | ||
| Voter turnout | % | |||
| Democratic hold | ||||
2006
| Party | Candidate | Votes | % | |
|---|---|---|---|---|
| Democratic | Dennis Moore* | 149,480 | 64.47 | |
| Republican | Chuck Ahner | 78,446 | 33.84 | |
| Reform | Robert A. Conroy | 3,925 | 1.69 | |
| Total votes | 231,851 | 100.00 | ||
| Voter turnout | % | |||
| Democratic hold | ||||
2008
| Party | Candidate | Votes | % | |
|---|---|---|---|---|
| Democratic | Dennis Moore* | 202,541 | 56.44 | |
| Republican | Nick Jordan | 142,307 | 39.66 | |
| Libertarian | Joe Bellis | 10,073 | 2.81 | |
| Reform | Roger Tucker | 3,937 | 1.10 | |
| Total votes | 358,858 | 100.00 | ||
| Voter turnout | % | |||
| Democratic hold | ||||
2010
| Party | Candidate | Votes | % | |||
|---|---|---|---|---|---|---|
| Republican | Kevin Yoder | 136,246 | 58.40 | |||
| Democratic | Stephene Moore | 90,193 | 38.66 | |||
| Libertarian | Jasmin Talbert | 6,846 | 2.94 | |||
| Total votes | 233,285 | 100.00 | ||||
| Voter turnout | % | |||||
| Republican gain from Democratic | ||||||
2012
| Party | Candidate | Votes | % | |
|---|---|---|---|---|
| Republican | Kevin Yoder (incumbent) | 201,087 | 68.5 | |
| Libertarian | Joel Balam | 92,675 | 31.5 | |
| Total votes | 293,762 | 100 | ||
| Republican hold | ||||
Historical district boundaries
See also
References
- ↑ "Partisan Voting Index Districts of the 113th Congress: 2004 & 2008" (PDF). The Cook Political Report. 2012. Retrieved 2013-01-10.
- ↑ "American FactFinder". United States Census Bureau. Retrieved 2008-01-31.
External links
Coordinates: 38°48′N 94°48′W / 38.8°N 94.8°W