Voter turnout in Canada
Voter turnout is the percentage of eligible voters who cast a ballot in an election. The following presents voter turnout figures for Canada's general elections as compiled by Elections Canada.
- The median voter turnout for Canada's general elections since 1865 has been 70.3%.
- The average voter turnout for Canada's general elections since 1867 has been 70.7%
- The highest voter turnouts were in 1958, 1962, and 1963, when voter turnout was over 79%.
- The lowest voter turnout on record was in 2008, when voter turnout fell to only 58.8%.
- Voter turnout in the 2011 federal election, at 61.4%, was the third lowest in Canadian history.
- Voter turnout rose sharply in the 2015 federal election to 68.5%, the highest turnout since 1993.
When low turnout reflects cultural values of disenchantment or indifference, the election may not be an accurate reflection of the will of the people. Low turnouts can lead to unequal representation among various parts of the population. In developed countries, non-voters tend to be concentrated in particular demographic and socioeconomic groups, especially the young and the poor.
Voter turnout in Canada's general elections
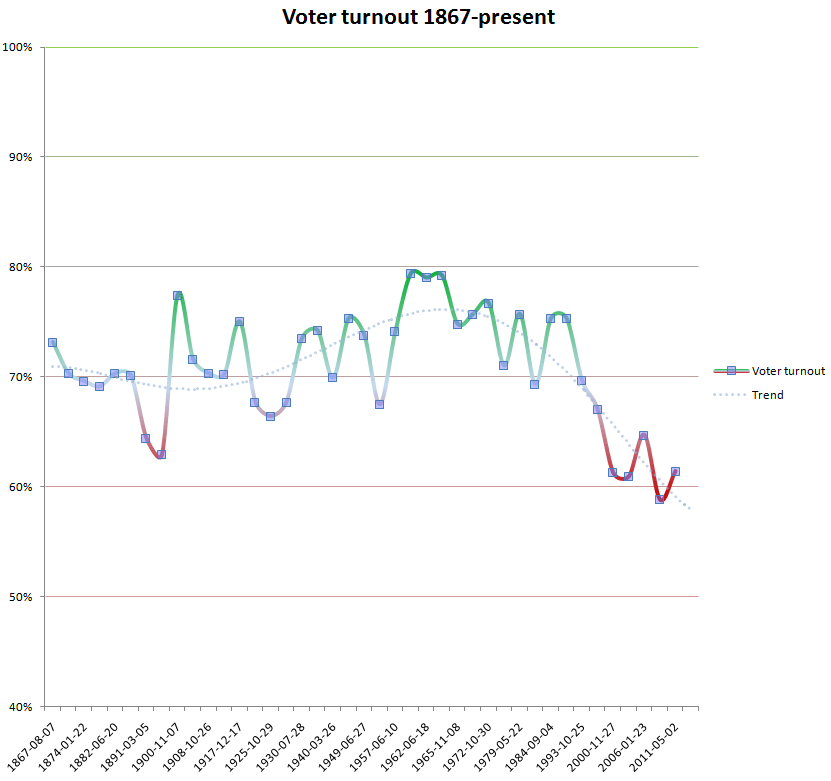
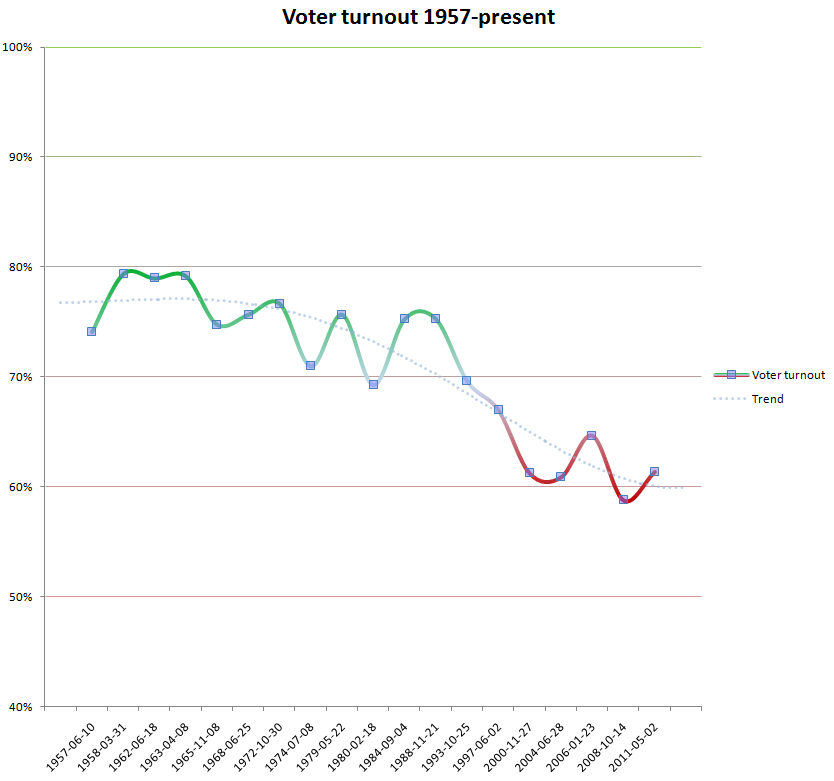
(Inaccurate graphs - graphs do not reflect data below)
Table - Voter turnout in Canada 1867–present
| Date of election | Population | Number of electors on list | Total ballots cast | Voter turnout |
|---|---|---|---|---|
| 1867-08-07 | 3,230,000 | 361,028 | 268,387 | 73.1% |
| 1872-07-20 | 3,689,000 | 426,974 | 318,329 | 70.3% |
| 1874-01-22 | 3,689,000 | 432,410 | 324,006 | 69.6% |
| 1878-09-17 | 3,689,000 | 715,279 | 534,029 | 69.1% |
| 1882-06-20 | 4,325,000 | 663,873 | 508,496 | 70.3% |
| 1887-02-22 | 4,325,000 | 948,222 | 724,517 | 70.1% |
| 1891-03-05 | 4,833,000 | 1,113,140 | 778,495 | 64.4% |
| 1896-06-23 | 4,833,000 | 1,358,328 | 912,992 | 62.9% |
| 1900-11-07 | 4,833,000 | 1,167,402 | 958,497 | 77.4% |
| 1904-11-03 | 5,371,000 | 1,385,440 | 1,036,878 | 71.6% |
| 1908-10-26 | 5,371,000 | 1,463,591 | 1,180,820 | 70.3% |
| 1911-09-21 | 7,204,527 | 1,820,742 | 1,314,953 | 70.2% |
| 1917-12-17 | 7,591,971 | 2,093,799 | 1,892,741 | 75.0% |
| 1921-12-06 | 8,760,211 | 4,435,310 | 3,139,306 | 67.7% |
| 1925-10-29 | 8,776,352 | 4,608,636 | 3,168,412 | 66.4% |
| 1926-09-14 | 8,887,952 | 4,665,381 | 3,273,062 | 67.7% |
| 1930-07-28 | 8,887,952 | 5,153,971 | 3,922,481 | 73.5% |
| 1935-10-14 | 10,367,063 | 5,918,207 | 4,452,675 | 74.2% |
| 1940-03-26 | 10,429,169 | 6,588,888 | 4,672,531 | 69.9% |
| 1945-06-11 | 11,494,627 | 6,952,445 | 5,305,193 | 75.3% |
| 1949-06-27 | 11,823,649 | 7,893,629 | 5,903,572 | 73.8% |
| 1953-08-10 | 14,003,704 | 8,401,691 | 5,701,963 | 67.5% |
| 1957-06-10 | 16,073,970 | 8,902,125 | 6,680,690 | 74.1% |
| 1958-03-31 | 16,073,970 | 9,131,200 | 7,357,139 | 79.4% |
| 1962-06-18 | 18,238,247 | 9,700,325 | 7,772,656 | 79.0% |
| 1963-04-08 | 18,238,247 | 9,910,757 | 7,958,636 | 79.2% |
| 1965-11-08 | 18,238,247 | 10,274,904 | 7,796,728 | 74.8% |
| 1968-06-25 | 20,014,880 | 10,860,888 | 8,217,916 | 75.7% |
| 1972-10-30 | 21,568,311 | 13,000,778 | 9,974,661 | 76.7% |
| 1974-07-08 | 21,568,311 | 13,620,353 | 9,671,002 | 71.0% |
| 1979-05-22 | 22,992,604 | 15,233,653 | 11,541,000 | 75.7% |
| 1980-02-18 | 22,992,604 | 15,890,416 | 11,015,514 | 69.3% |
| 1984-09-04 | 24,343,181 | 16,774,941 | 12,638,424 | 75.3% |
| 1988-11-21 | 25,309,331 | 17,639,001 | 13,281,191 | 75.3% |
| 1993-10-25 | 27,296,859 | 19,906,796 | 13,863,135 | 69.6% |
| 1997-06-02 | 27,296,859 | 19,663,478 | 13,174,698 | 67.0% |
| 2000-11-27 | 28,846,761 | 21,243,473 | 12,997,185 | 61.3% |
| 2004-06-28 | 30,007,094 | 22,466,621 | 13,683,570 | 60.9% |
| 2006-01-23 | 30,007,094 | 23,054,615 | 14,908,703 | 64.7% |
| 2008-10-14 | 31,612,897 | 23,677,639 | 13,929,093 | 58.8% |
| 2011-05-02 | 33,476,688 | 24,257,592 | 14,823,408 | 61.1% |
| 2015-10-19[lower-alpha 1] | 35,749,600 | 25,638,379 | 17,559,353 | 68.5% |
See also
- Young voter turnout in Canada
- List of Canadian federal general elections
- Canadian federal election, 2008
- Elections in Canada
- Elections Canada
- Canadian electoral system
- Federal political financing in Canada
- Voter turnout
- Voter suppression
- Occupy Canada
References
External links
- Voter Turnout in the 2008 Canadian Election - Voter Turnout in Historical Perspective Simon Fraser University
- Voter Turnout in Canada MapleLeafWeb.com
- Voter turnout CBC.ca
- Voter Turnout at Federal Elections and Referendums, 1867-2008 Elections Canada
- Elections Canada website for young voters
- Apathy Is Boring apathyisboring.com
- Student Vote studentvote.ca
- We're #11. How embarrassing. May 1, 2011
- Canada election: High turnout in early voting, BBC News, April 27, 2011
- Middle East protests inspiring Canadians to vote May 1, 2011
- Low voter turnout Monday helps deliver Conservatives' coveted majority May 3, 2011
This article is issued from Wikipedia - version of the 11/14/2016. The text is available under the Creative Commons Attribution/Share Alike but additional terms may apply for the media files.