Wahlen
| Wahlen | ||
|---|---|---|
 | ||
| ||
 Wahlen | ||
|
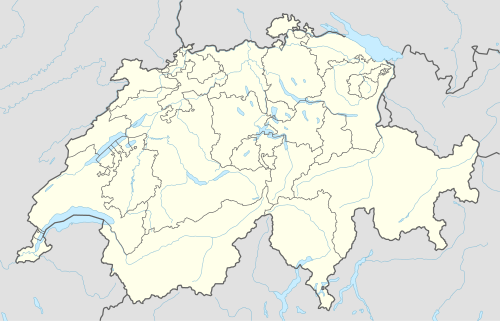
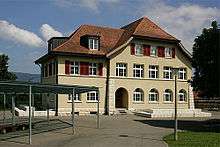
Location of Wahlen  | ||
| Coordinates: 47°24′N 7°31′E / 47.400°N 7.517°ECoordinates: 47°24′N 7°31′E / 47.400°N 7.517°E | ||
| Country | Switzerland | |
| Canton | Basel-Landschaft | |
| District | Laufen | |
| Area[1] | ||
| • Total | 5.42 km2 (2.09 sq mi) | |
| Elevation | 403 m (1,322 ft) | |
| Population (Mar 2016[2]) | ||
| • Total | 1,411 | |
| • Density | 260/km2 (670/sq mi) | |
| Postal code | 4246 | |
| SFOS number | 2792 | |
| Surrounded by | Breitenbach (SO), Brislach, Büsserach (SO), Grindel (SO), Laufen | |
| Website |
www SFSO statistics | |

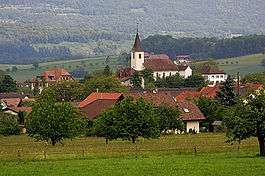
Wahlen is a municipality in the district of Laufen in the canton of Basel-Country in Switzerland.
Geography

Wahlen has an area, as of 2009, of 5.42 square kilometers (2.09 sq mi). Of this area, 3 km2 (1.2 sq mi) or 55.4% is used for agricultural purposes, while 1.82 km2 (0.70 sq mi) or 33.6% is forested. Of the rest of the land, 0.61 km2 (0.24 sq mi) or 11.3% is settled (buildings or roads).[3]
Of the built up area, housing and buildings made up 7.2% and transportation infrastructure made up 2.0%. Power and water infrastructure as well as other special developed areas made up 1.5% of the area Out of the forested land, 31.2% of the total land area is heavily forested and 2.4% is covered with orchards or small clusters of trees. Of the agricultural land, 27.9% is used for growing crops and 23.6% is pastures, while 3.9% is used for orchards or vine crops.[3]
Coat of arms
The blazon of the municipal coat of arms is Gules, a Lion rampant Or queued fourchy holding in the front paws a Crozier Argent.[4]
Demographics


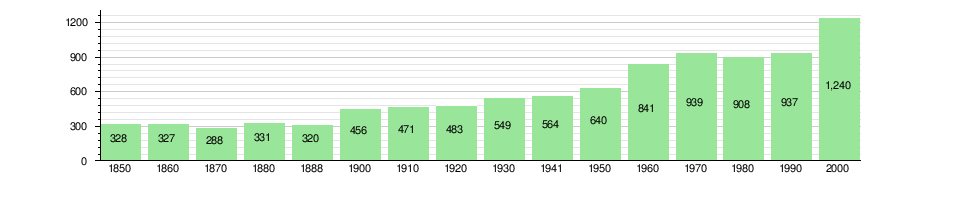
Wahlen has a population (as of March 2016) of 1,411.[2] As of 2008, 6.7% of the population are resident foreign nationals.[5] Over the last 10 years (1997–2007) the population has changed at a rate of 19.2%.[6]
Most of the population (as of 2000) speaks German (1,197 or 96.5%), with French being second most common (9 or 0.7%) and Italian language being third (8 or 0.6%).[7]
As of 2008, the gender distribution of the population was 50.5% male and 49.5% female. The population was made up of 1,249 Swiss citizens (92.3% of the population), and 104 non-Swiss residents (7.7%)[8] Of the population in the municipality 500 or about 40.3% were born in Wahlen and lived there in 2000. There were 245 or 19.8% who were born in the same canton, while 349 or 28.1% were born somewhere else in Switzerland, and 83 or 6.7% were born outside of Switzerland.[7]
In 2008 there were 15 live births to Swiss citizens and 2 births to non-Swiss citizens, and in same time span there were 4 deaths of Swiss citizens. Ignoring immigration and emigration, the population of Swiss citizens increased by 11 while the foreign population increased by 2. There were 2 non-Swiss women who immigrated from another country to Switzerland. The total Swiss population change in 2008 (from all sources, including moves across municipal borders) was an increase of 3 and the non-Swiss population change was an increase of 4 people. This represents a population growth rate of 0.5%.[5]
The age distribution, as of 2010, in Wahlen is; 80 children or 5.9% of the population are between 0 and 6 years old and 223 teenagers or 16.5% are between 7 and 19. Of the adult population, 155 people or 11.5% of the population are between 20 and 29 years old. 163 people or 12.0% are between 30 and 39, 255 people or 18.8% are between 40 and 49, and 283 people or 20.9% are between 50 and 64. The senior population distribution is 131 people or 9.7% of the population are between 65 and 79 years old and there are 63 people or 4.7% who are over 80.[8]
As of 2000, there were 512 people who were single and never married in the municipality. There were 629 married individuals, 68 widows or widowers and 31 individuals who are divorced.[7]
As of 2000, there were 465 private households in the municipality, and an average of 2.6 persons per household.[6] There were 86 households that consist of only one person and 36 households with five or more people. Out of a total of 471 households that answered this question, 18.3% were households made up of just one person and 12 were adults who lived with their parents. Of the rest of the households, there are 147 married couples without children, 188 married couples with children There were 24 single parents with a child or children. There were 8 households that were made up unrelated people and 6 households that were made some sort of institution or another collective housing.[7]
In 2000 there were 278 single family homes (or 76.0% of the total) out of a total of 366 inhabited buildings. There were 42 multi-family buildings (11.5%), along with 38 multi-purpose buildings that were mostly used for housing (10.4%) and 8 other use buildings (commercial or industrial) that also had some housing (2.2%). Of the single family homes 16 were built before 1919, while 70 were built between 1990 and 2000. The greatest number of single family homes (52) were built between 1946 and 1960.[9]
In 2000 there were 488 apartments in the municipality. The most common apartment size was 4 rooms of which there were 167. There were 10 single room apartments and 201 apartments with five or more rooms. Of these apartments, a total of 455 apartments (93.2% of the total) were permanently occupied, while 23 apartments (4.7%) were seasonally occupied and 10 apartments (2.0%) were empty.[9] As of 2007, the construction rate of new housing units was 4.4 new units per 1000 residents.[6] As of 2000 the average price to rent a two-room apartment was about 914.00 CHF (US$730, £410, €580), a three-room apartment was about 1017.00 CHF (US$810, £460, €650) and a four-room apartment cost an average of 1302.00 CHF (US$1040, £590, €830).[10] The vacancy rate for the municipality, in 2008, was 0%.[6]
The historical population is given in the following chart:[11]
Politics
In the 2007 federal election the most popular party was the SVP which received 32.27% of the vote. The next three most popular parties were the CVP (28.93%), the FDP (20.58%) and the SP (9.7%). In the federal election, a total of 429 votes were cast, and the voter turnout was 42.6%.[12]
Economy
As of 2007, Wahlen had an unemployment rate of 1.44%. As of 2005, there were 45 people employed in the primary economic sector and about 15 businesses involved in this sector. 43 people were employed in the secondary sector and there were 10 businesses in this sector. 54 people were employed in the tertiary sector, with 15 businesses in this sector.[6] There were 633 residents of the municipality who were employed in some capacity, of which females made up 38.1% of the workforce.
In 2008 the total number of full-time equivalent jobs was 89. The number of jobs in the primary sector was 27, all of which were in agriculture. The number of jobs in the secondary sector was 31, of which 8 or (25.8%) were in manufacturing and 23 (74.2%) were in construction. The number of jobs in the tertiary sector was 31. In the tertiary sector; 8 or 25.8% were in wholesale or retail sales or the repair of motor vehicles, 3 or 9.7% were in the movement and storage of goods, 3 or 9.7% were in a hotel or restaurant, 1 or 3.2% were in the information industry, 3 or 9.7% were technical professionals or scientists, 7 or 22.6% were in education.[13]
In 2000, there were 49 workers who commuted into the municipality and 535 workers who commuted away. The municipality is a net exporter of workers, with about 10.9 workers leaving the municipality for every one entering.[14] Of the working population, 19% used public transportation to get to work, and 51.5% used a private car.[6]
Religion
From the 2000 census, 863 or 69.6% were Roman Catholic, while 187 or 15.1% belonged to the Swiss Reformed Church. Of the rest of the population, there were 4 members of an Orthodox church (or about 0.32% of the population), there were 9 individuals (or about 0.73% of the population) who belonged to the Christian Catholic Church, and there were 28 individuals (or about 2.26% of the population) who belonged to another Christian church. There were 14 (or about 1.13% of the population) who were Islamic. There were 2 individuals who were Buddhist and 4 individuals who were Hindu. 85 (or about 6.85% of the population) belonged to no church, are agnostic or atheist, and 44 individuals (or about 3.55% of the population) did not answer the question.[7]
Education
In Wahlen about 441 or (35.6%) of the population have completed non-mandatory upper secondary education, and 111 or (9.0%) have completed additional higher education (either university or a Fachhochschule). Of the 111 who completed tertiary schooling, 76.6% were Swiss men, 17.1% were Swiss women.[7] As of 2000, there were 4 students in Wahlen who came from another municipality, while 80 residents attended schools outside the municipality.[14]
References
- ↑ Arealstatistik Standard - Gemeindedaten nach 4 Hauptbereichen
- 1 2 Canton of Basel-Land Statistics, Wohnbevölkerung nach Nationalität und Konfession per 31. März 2016 (German) accessed 30 August 201
- 1 2 Swiss Federal Statistical Office-Land Use Statistics 2009 data (German) accessed 25 March 2010
- ↑ Flags of the World.com accessed 2 March 2011
- 1 2 Swiss Federal Statistical Office - Superweb database - Gemeinde Statistics 1981-2008 (German) accessed 19 June 2010
- 1 2 3 4 5 6 Swiss Federal Statistical Office accessed 2 March 2011
- 1 2 3 4 5 6 STAT-TAB Datenwürfel für Thema 40.3 - 2000 (German) accessed 2 February 2011
- 1 2 Canton of Basel-Land Statistics, Wohnbevölkerung nach Nationalität und Konfession per 30. September 2010 (German) accessed 16 February 2011
- 1 2 Federal Statistical Office STAT-TAB - Datenwürfel für Thema 09.2 - Gebäude und Wohnungen (German) accessed 28 January 2011
- ↑ Canton of Basel-Land Statistics, Mieter- und Genossenschafterwohnungen1 nach Zimmerzahl und Mietpreis 2000 (German) accessed 20 February 2011
- ↑ Swiss Federal Statistical Office STAT-TAB Bevölkerungsentwicklung nach Region, 1850-2000 (German) accessed 29 January 2011
- ↑ Swiss Federal Statistical Office, Nationalratswahlen 2007: Stärke der Parteien und Wahlbeteiligung, nach Gemeinden/Bezirk/Canton (German) accessed 28 May 2010
- ↑ Swiss Federal Statistical Office STAT-TAB Betriebszählung: Arbeitsstätten nach Gemeinde und NOGA 2008 (Abschnitte), Sektoren 1-3 (German) accessed 28 January 2011
- 1 2 Swiss Federal Statistical Office - Statweb (German) accessed 24 June 2010
External links
- Official website (German)
-
 Media related to Wahlen at Wikimedia Commons