Wallsend (UK Parliament constituency)
Coordinates: 54°59′28″N 1°31′59″W / 54.991°N 1.533°W
| Wallsend | |
|---|---|
|
Former Borough constituency for the House of Commons | |
| County |
1918–1974: Northumberland 1974–1997: Tyne and Wear |
| 1918–1997 | |
| Number of members | One |
| Replaced by | Newcastle upon Tyne East & Wallsend and North Tyneside |
| Created from | Tyneside |
Wallsend was a parliamentary constituency centred on Wallsend, a town on the north bank of the River Tyne in North Tyneside.
It returned one Member of Parliament (MP) to the House of Commons of the Parliament of the United Kingdom from 1918 until it was abolished for the 1997 general election.
It was partly replaced by the new Newcastle upon Tyne East and Wallsend constituency and North Tyneside constituency.
Members of Parliament
| Election | Member[1] | Party | |
|---|---|---|---|
| 1918 | Matthew Turnbull Simm | National Democratic | |
| 1922 | Sir Patrick Hastings | Labour | |
| 1926 by-election | Margaret Bondfield | Labour | |
| 1931 | Irene Ward | Conservative | |
| 1945 | John McKay | Labour | |
| 1964 | Ted Garrett | Labour | |
| 1992 | Stephen Byers | Labour | |
| 1997 | constituency abolished | ||
Elections
Elections in the 1910s
J.M. Robertson
| Party | Candidate | Votes | % | ± | |
|---|---|---|---|---|---|
| National Democratic | 10,246 | ||||
| Labour | John Chapman | 6,835 | |||
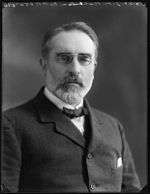
| Liberal | Rt Hon. John Mackinnon Robertson | 3,047 | |||
| Majority | 3,411 | ||||
| Turnout | |||||
| National Democratic win | |||||
- endorsed by Coalition Government
Elections in the 1920s
| Party | Candidate | Votes | % | ± | |
|---|---|---|---|---|---|
| Labour | Patrick Gardiner Hastings | 14,248 | |||
| Unionist | Hon. Christopher William Lowther | 11,425 | |||
| Liberal | Thomas George Graham | 2,908 | |||
| National Liberal | Matthew Turnbull Simm | 1,840 | |||
| Majority | 2,823 | ||||
| Turnout | |||||
| Labour gain from National Liberal | Swing | ||||
| Party | Candidate | Votes | % | ± | |
|---|---|---|---|---|---|
| Labour | Patrick Gardiner Hastings | 16,126 | 55.5 | ||
| Unionist | Hon. Christopher William Lowther | 12,950 | 44.5 | ||
| Majority | 3,176 | 11.0 | |||
| Turnout | 29,076 | ||||
| Labour hold | Swing | ||||
| Party | Candidate | Votes | % | ± | |
|---|---|---|---|---|---|
| Labour | Sir Patrick Gardiner Hastings | 17,274 | |||
| Unionist | Sam Howard | 15,672 | |||
| Majority | 1,602 | ||||
| Turnout | |||||
| Labour hold | Swing | ||||
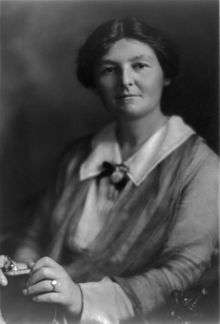
Margaret Bondfield
| Party | Candidate | Votes | % | ± | |
|---|---|---|---|---|---|
| Labour | Margaret Grace Bondfield | 18,866 | |||
| Unionist | Sam Howard | 9,839 | |||
| Liberal | Aaron Charlton Curry | 4,000 | |||
| Majority | 9,027 | ||||
| Turnout | |||||
| Labour hold | Swing | ||||
| Party | Candidate | Votes | % | ± | |
|---|---|---|---|---|---|
| Labour | Margaret Grace Bondfield | 20,057 | 49.5 | ||
| Unionist | Walter Waring | 12,952 | 31.9 | ||
| Liberal | Samuel Phillips | 6,790 | 16.7 | ||
| Communist | Walter Hannington | 744 | 1.8 | n/a | |
| Majority | 7,105 | 17.7 | |||
| Turnout | 80.2 | ||||
| Labour hold | Swing | ||||
Elections in the 1930s
| Party | Candidate | Votes | % | ± | |
|---|---|---|---|---|---|
| Conservative | Irene Mary Bewick Ward | 25,999 | 58.57 | ||
| Labour | Margaret Grace Bondfield | 18,393 | 41.43 | ||
| Majority | 7,606 | 17.13 | |||
| Turnout | 84.92 | ||||
| Conservative gain from Labour | Swing | ||||
| Party | Candidate | Votes | % | ± | |
|---|---|---|---|---|---|
| Conservative | Irene Mary Bewick Ward | 23,842 | 52.62 | ||
| Labour | Margaret Grace Bondfield | 21,462 | 47.37 | ||
| Majority | 2,379 | 5.25 | |||
| Turnout | 81.26 | ||||
| Conservative hold | Swing | ||||
Election in the 1940s
| Party | Candidate | Votes | % | ± | |
|---|---|---|---|---|---|
| Labour | John McKay | 32,065 | 60.06 | ||
| Conservative | Irene Mary Bewick Ward | 21,319 | 39.94 | ||
| Majority | 10,746 | 20.13 | |||
| Turnout | 78.86 | ||||
| Labour gain from Conservative | Swing | ||||
Elections in the 1950s
| Party | Candidate | Votes | % | ± | |
|---|---|---|---|---|---|
| Labour | John McKay | 33,790 | 56.35 | ||
| Conservative | Dudley Fitz Mowbray Appleby | 21,643 | 36.09 | ||
| Liberal | John William Craggs | 4,532 | 7.56 | ||
| Majority | 12,147 | 20.26 | |||
| Turnout | 87.55 | ||||
| Labour hold | Swing | ||||
| Party | Candidate | Votes | % | ± | |
|---|---|---|---|---|---|
| Labour | John McKay | 35,678 | 58.70 | ||
| Conservative | Gerald C. Crangle | 25,099 | 41.30 | ||
| Majority | 10,579 | 17.41 | |||
| Turnout | 87.18 | ||||
| Labour hold | Swing | ||||
| Party | Candidate | Votes | % | ± | |
|---|---|---|---|---|---|
| Labour | John McKay | 34,625 | 57.80 | ||
| Conservative | Brian Baird | 25,275 | 42.20 | ||
| Majority | 9,350 | 15.61 | |||
| Turnout | 81.02 | ||||
| Labour hold | Swing | ||||
| Party | Candidate | Votes | % | ± | |
|---|---|---|---|---|---|
| Labour | John McKay | 37,862 | 56.55 | ||
| Conservative | Brian Baird | 29,096 | 43.45 | ||
| Majority | 8,766 | 13.09 | |||
| Turnout | 83.45 | ||||
| Labour hold | Swing | ||||
Elections in the 1960s
| Party | Candidate | Votes | % | ± | |
|---|---|---|---|---|---|
| Labour | William Edward Garrett | 39,841 | 60.42 | ||
| Conservative | Brian Baird | 26,096 | 39.58 | ||
| Majority | 13,745 | 20.85 | |||
| Turnout | 81.54 | ||||
| Labour hold | Swing | ||||
| Party | Candidate | Votes | % | ± | |
|---|---|---|---|---|---|
| Labour | William Edward Garrett | 39,744 | 65.21 | ||
| Conservative | Peter Coles Price | 21,205 | 34.79 | ||
| Majority | 18,539 | 30.42 | |||
| Turnout | 77.48 | ||||
| Labour hold | Swing | ||||
Elections in the 1970s
| Party | Candidate | Votes | % | ± | |
|---|---|---|---|---|---|
| Labour | William Edward Garrett | 39,065 | 61.31 | ||
| Conservative | Earl M. White | 24,650 | 38.69 | ||
| Majority | 14,415 | 22.62 | |||
| Turnout | 74.18 | ||||
| Labour hold | Swing | ||||
| Party | Candidate | Votes | % | ± | |
|---|---|---|---|---|---|
| Labour | William Edward Garrett | 41,811 | 61.96 | ||
| Conservative | J. Chambers | 24,564 | 36.40 | ||
| Workers Revolutionary | D. Temple | 1,108 | 1.64 | ||
| Majority | 17,247 | 25.56 | |||
| Turnout | 75.49 | ||||
| Labour hold | Swing | ||||
| Party | Candidate | Votes | % | ± | |
|---|---|---|---|---|---|
| Labour | William Edward Garrett | 37,180 | 58.11 | ||
| Conservative | J. Chambers | 15,911 | 24.87 | ||
| Liberal | P. Hampton | 10,453 | 16.34 | ||
| Workers Revolutionary | K. Flynn | 435 | 0.68 | ||
| Majority | 21,269 | 33.24 | |||
| Turnout | 70.85 | ||||
| Labour hold | Swing | ||||
| Party | Candidate | Votes | % | ± | |
|---|---|---|---|---|---|
| Labour | William Edward Garrett | 38,214 | 55.14 | ||
| Conservative | Liddell Johnston | 21,695 | 31.30 | ||
| Liberal | P. Ryan | 8,514 | 12.28 | ||
| National Front | Ian Hunter | 472 | 0.68 | ||
| Workers Revolutionary | K. Flynn | 412 | 0.59 | ||
| Majority | 16,519 | 23.83 | |||
| Turnout | 75.90 | ||||
| Labour hold | Swing | ||||
Elections in the 1980s
| Party | Candidate | Votes | % | ± | |
|---|---|---|---|---|---|
| Labour | William Edward Garrett | 26,615 | 50.07 | ||
| Conservative | M. Leigh | 14,101 | 26.00 | ||
| Social Democratic | J. Phylactou | 13,522 | 24.93 | ||
| Majority | 12,514 | 23.07 | |||
| Turnout | 71.12 | ||||
| Labour hold | Swing | ||||
| Party | Candidate | Votes | % | ± | |
|---|---|---|---|---|---|
| Labour | William Edward Garrett | 32,709 | 56.84 | ||
| Conservative | D. Milburn | 13,325 | 23.16 | ||
| Social Democratic | J. Phylactou | 11,508 | 20.00 | ||
| Majority | 19,384 | 33.7 | |||
| Turnout | 57,542 | 75.0 | |||
| Labour hold | Swing | ||||
Elections in the 1990s
| Party | Candidate | Votes | % | ± | |
|---|---|---|---|---|---|
| Labour | Stephen John Byers | 33,439 | 57.9 | +1.0 | |
| Conservative | Miss M Gibbon | 13,969 | 24.2 | +1.0 | |
| Liberal Democrat | Michael J. Huscroft | 10,369 | 17.9 | −2.1 | |
| Majority | 19,470 | 33.7 | +0.0 | ||
| Turnout | 57,777 | 74.1 | −0.9 | ||
| Labour hold | Swing | +0.0 | |||
Notes and references
- ↑ Leigh Rayment's Historical List of MPs – Constituencies beginning with "W" (part 1)
- ↑ "Politics Resources". Election 1992. Politics Resources. 9 April 1992. Retrieved 6 Dec 2010.
This article is issued from Wikipedia - version of the 7/8/2016. The text is available under the Creative Commons Attribution/Share Alike but additional terms may apply for the media files.