Water remote sensing
Water Remote Sensing studies the color of water through the observation of the spectrum of water leaving radiation. From the study of this spectrum, the concentration of optically active components of the upper layer of the water body can be concluded via specific algorithms.[1] Water quality monitoring by remote sensing and close-range instruments has obtained considerable attention since the founding of EU Water Framework Directive.[1]
History
If water remote sensing is defined as the observation of the water from a distance in order to describe its color, without taking water samples, the gradual development of understanding of the transparency of natural waters and of the reason of their clarity variability and coloration has been sketched from the times of Henry Hudson (1600) to those of Chandrasekhara Raman (1930).[2] However, the development of water remote sensing techniques (by the use of satellite imaging, aircraft or close range optical devices) didn't start until the early 1970s. These first techniques measured the spectral and thermal differences in the emitted energy from water surfaces. In general, empirical relationships were settled between the spectral properties and the water quality parameters of the water body.[3] In 1974, Ritchie et al. (1974) [4] developed an empirical approach to determine suspended sediments. This kind of empirical models are only able to use to determine water quality parameters of water bodies with similar conditions. In 1992 an analytical approach was used by Schiebe et al. (1992).[5] This approach was based on the optical characteristics of water and water quality parameters to elaborate a physically based model of the relationship between the spectral and physical properties of the surface water studied. This physically based model was successfully applied in order to estimate suspended sediment concentrations.[3][5][6]
Function
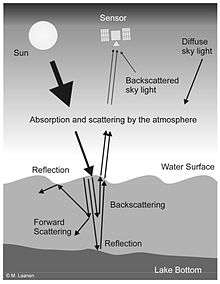
Water Remote sensing instruments allow to record the color of a water body, which provides information on the presence and abundance of optically active natural water components. The water color spectrum is defined as an apparent optical property (AOP) of the water. This means that the color of the water is influenced by the angular distribution of the light field and by the nature and quantity of the substances in the medium, in this case, water.[7] Thus, the value of this parameter will change with changes in the optical properties and concentrations of the optically active substances in the water, the inherent optical properties or IOPS.[1] The IOPS are independent from the angular distribution of light but they are dependent from the type and substances present in the medium as well.[7] For instance, the diffuse attenuation coefficient of downwelling irradiance, Kd (it is often used as an index of water clarity or ocean turbidity) is defined as an AOP, while the absorption coefficient and the scattering coefficient of the medium are defined as IOPS.[7] There are two different approaches to determine the concentration of optically active water components by the study of the spectra. The first approach consist of empirical algorithms based on statistical relationships and the second approach consists of analytical algorithms based on the inversion of calibrated bio-optical models.[1][7] Accurate calibration of the relationships/models used is an important condition for successful inversion on water remote sensing techniques and the determination of concentration of water quality parameters from observed spectral remote sensing data.[1] Thus, these techniques depend on their ability to record these changes in the spectral signature of light backscattered from water surface and relate these recorded changes to water quality parameters via empirical or analytical approaches. Depending of the water constituents of interest and the sensor used, different parts of the spectrum will be analysed.[3]
Contribution

By the use of Optical close range devices (e.g. spectrometers, radiometers), airplanes or helicopters (airborne remote sensing) and satellites (space born remote sensing), the light reflected from the water bodies is measured. For instance, algorithms are used to retrieve parameters such as chlorophyll-a(Chl-a) and Suspended Particulate Matter (SPM) concentration, the absorption by colored dissolved organic matter at 440 nm (aCDOM) and secchi depth.[1] The measurement of these values will give an idea about the water quality of the water body being studied. A very high concentration of green pigments like chlorophyll might indicate the presence of an algal bloom, for example, due to eutrophication processes. Thus, the chlorophyll concentration could be used as a proxy or indicator for the trophic condition of a water body. In the same manner, other optical quality parameters such as suspended particles or Suspended Particulate matter (SPM), Colored Dissolved Organic Matter (CDOM), Transparency (Kd), and chlorophyll-a (Chl-a) can be used to monitor water quality.[1]
References
- 1 2 3 4 5 6 7 8 9 Laanen, M.L. (2007)."Yellow Matters- Improving the remote sensing of Coloured Dissolved Organic Matter in inland freshwaters" Ph.D. Thesis. Vrije Universiteit Amsterdam: The NL.
- ↑ Marcel, R., Wernand & Winfried W.C.Gieskes (2012), "Ocean Optics from 1600 (Hudson) to 1930 (Raman) Shifting interpretation of natural water colouring", Paris, France: Union des oceanographes de France (published 1 January 2012)
- 1 2 3 Ritchie, J.C; Zimba, P.V.; Everitt, J.H. (2003), “Remote Sensing Techniques to Assess Water Quality”, American Society for Photogrammetry Engineering and Remote Sensing, 69:695-704.
- ↑ Ritchie, J.C.; McHenry, J.R.; Schiebe, F.R.; Wilson, R.B.(1974),“The relationship of reflected solar radiation and the concentration of sediment in the surface water of reservoirs”,Remote Sensing of Earth Resources Vol. III (F. Shahrokhi, editor),The University of Tennessee Space Institute, Tullahoma, Tennessee,3:57–72
- 1 2 Schiebe, F.R., Harrington, Jr., J.A.; Ritchie, J.C. (1992), “Remote sensing of suspended sediments: The Lake Chicot, Arkansas project”, International Journal of Remote Sensing, 13(8):1487–1509
- ↑ Harrington, J.A., Jr., Schiebe, F.R.; Nix, J.F. (1992). “Remote sensing of Lake Chicot, Arkansas: Monitoring suspended sediments, turbidity and secchi depth with Landsat MSS”, Remote Sensing of Environment, 39(1):15–27
- 1 2 3 4 IOCCG (2000). Remote Sensing of Ocean Colour in Coastal, and Other Optically-Complex Waters. Sathyendranath, S. (ed.), Reports of the International Ocean-Colour Coordinating Group, No. 3, IOCCG, Dartmouth, Canada.
External links
- EULAKES project, water quality by remote sensing technique
- CoastColour project: remote sensing of the coastal zone
- Revamp project: Regional Validation of MERIS Chlorophyll products in North Sea Coastal Waters
- The Great Lakes Web Site: Michigan Tech's Large Lakes Remote Sensing program
- CoastWatch project
- International Ocean Colour Coordinating Group
- ESA European Space Agency activities: Observing the earth
- Ocean Color Web
- Assessing remotely sensed chlorophyll-a for the implementation of the Water Framework Directive in European perialpine lakes