Westmeath County Council election, 2009
Westmeath County Council election, 2009

|
|
|
|
|
|
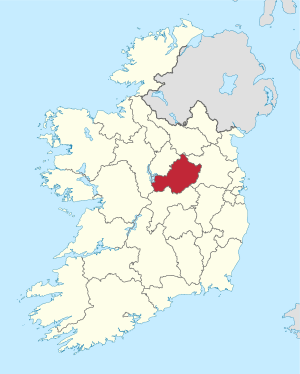
| Map showing the area of Westmeath County Council |
|
Council control after election
TBD
|
|
|
An election to Westmeath County Council took place on 5 June 2009 as part of that year's Irish local elections. 23 councillors were elected from five electoral divisions by PR-STV voting for a five-year term of office.
Results by party
Results by Electoral Area
Athlone
| Athlone - 6 seats |
| Party | Candidate | % 1st Pref | Count 1 | Count 2 | Count 3 | Count 4 | Count 5 | Count 6 | Count 7 |
|
Fianna Fáil |
Kevin (Boxer) Moran* |
16.82 |
1,771 |
|
|
|
|
|
|
|
Fianna Fáil |
Frankie Keena* |
11.23 |
1,182 |
1,239 |
1,299 |
1,335 |
1,603 |
|
|
|
Fine Gael |
Joe Whelan* |
10.69 |
1,125 |
1,132 |
1,167 |
1,225 |
1,243 |
1,245 |
1,505 |
|
Fine Gael |
Mark Cooney* |
10.01 |
1,054 |
1,079 |
1,144 |
1,259 |
1,322 |
1,327 |
1,542 |
|
Fine Gael |
Gabrielle McFadden* |
8.47 |
892 |
927 |
978 |
1,113 |
1,230 |
1,241 |
1,405 |
|
Fianna Fáil |
Tom Allen* |
8.38 |
882 |
901 |
943 |
984 |
1,111 |
1,181 |
1,313 |
|
Fine Gael |
John Dolan* |
8.20 |
863 |
877 |
933 |
992 |
1,015 |
1,017 |
|
|
Sinn Féin |
Paul Hogan |
7.94 |
836 |
864 |
915 |
1,064 |
1,167 |
1,175 |
1,245 |
|
Fianna Fáil |
Kieran Molloy* |
7.28 |
766 |
816 |
832 |
864 |
|
|
|
|
Labour Party |
Lisa Burke |
6.34 |
667 |
683 |
742 |
|
|
|
|
|
Independent |
Jack Moran |
4.65 |
490 |
505 |
|
|
|
|
|
| Electorate: 19,332 Valid: 10,528 (54.46%) Spoilt: 139 Quota: 1,505 Turnout: 10,667 (55.18%) |
Coole
| Coole - 4 seats |
| Party | Candidate | % 1st Pref | Count 1 | Count 2 | Count 3 |
|
Fine Gael |
Frank McDermott* |
20.31 |
1,335 |
|
|
|
Fianna Fáil |
Paddy Hill* |
18.68 |
1,228 |
1,259 |
1,345 |
|
Labour Party |
Dan McCarthy* |
17.37 |
1,142 |
1,230 |
1,353 |
|
Fianna Fáil |
John Shaw |
16.60 |
1,091 |
1,133 |
1,244 |
|
Fine Gael |
Bernie Comaskey |
13.52 |
889 |
945 |
1,089 |
|
Independent |
Dermot Mullen |
7.45 |
490 |
594 |
|
|
Sinn Féin |
Mick Kenny |
6.07 |
399 |
|
|
| Electorate: 10,816 Valid: 6,574 (60.78%) Spoilt: 105 Quota: 1,315 Turnout: 6,679 (61.75%) |
Kilbeggan
| Kilbeggan - 4 seats |
| Party | Candidate | % 1st Pref | Count 1 | Count 2 | Count 3 | Count 4 | Count 5 | Count 6 |
|
Fine Gael |
Joe Flanagan* |
24.49 |
1,768 |
|
|
|
|
|
|
Fianna Fáil |
Paul Daly* |
15.78 |
1,139 |
884 |
915 |
938 |
947 |
1,127 |
|
Fine Gael |
Colm Arthur |
11.95 |
863 |
1,016 |
1,052 |
1,099 |
1,127 |
1,219 |
|
Labour Party |
Gerry Corcoran* |
11.61 |
838 |
1,050 |
1,131 |
1,310 |
|
|
|
Fine Gael |
Michael Newman* |
9.57 |
691 |
791 |
821 |
860 |
884 |
|
|
Fianna Fáil |
Vinny McCormack |
8.23 |
594 |
671 |
714 |
772 |
797 |
854 |
|
Fianna Fáil |
P.J. Coghill |
7.04 |
508 |
414 |
444 |
465 |
475 |
|
|
Fianna Fáil |
Vincent Bagnall |
6.69 |
483 |
414 |
444 |
465 |
475 |
|
|
Labour Party |
Pat Boyce |
4.64 |
335 |
357 |
405 |
|
|
|
| Electorate: 11,207 Valid: 7,219 (64.42%) Spoilt: 92 Quota: 1,444 Turnout: 6,059 (65.24%) |
Mullingar East
| Mullingar East - 4 seats |
| Party | Candidate | % 1st Pref | Count 1 | Count 2 | Count 3 | Count 4 | Count 5 | Count 6 | Count 7 | Count 8 | Count 9 |
|
Labour Party |
Mick Dollard* |
31.24 |
2,032 |
|
|
|
|
|
|
|
|
|
Labour Party |
Denis Leonard |
13.73 |
893 |
1,263 |
1,275 |
1,318 |
|
|
|
|
|
|
Fine Gael |
Peter Burke |
13.31 |
866 |
946 |
959 |
1,004 |
1,006 |
1,050 |
1,156 |
1,474 |
|
|
Fianna Fáil |
Aidan Davitt |
12.28 |
799 |
863 |
868 |
891 |
892 |
975 |
1,009 |
1,056 |
1,111 |
|
Fianna Fáil |
Jim Bourke* |
9.39 |
611 |
668 |
669 |
695 |
697 |
814 |
872 |
935 |
978 |
|
Fine Gael |
Patrick McLoughlin* |
7.30 |
475 |
514 |
519 |
523 |
529 |
573 |
610 |
|
|
|
Fianna Fáil |
Georgina Bagnall |
4.86 |
316 |
335 |
341 |
351 |
353 |
|
|
|
|
|
Independent |
Brian Fagan |
3.86 |
251 |
299 |
315 |
352 |
356 |
364 |
|
|
|
|
Green Party |
Seán Corrigan |
2.98 |
194 |
236 |
240 |
|
|
|
|
|
|
|
Independent |
Frank Harkin |
0.74 |
48 |
58 |
|
|
|
|
|
|
|
|
Independent |
Errol Farrell |
0.29 |
19 |
21 |
|
|
|
|
|
|
|
| Electorate: 11,197 Valid: 6,504 (58.09%) Spoilt: 98 Quota: 1,301 Turnout: 6,602 (58.96%) |
Mullingar West
| Mullingar West - 5 seats |
| Party | Candidate | % 1st Pref | Count 1 | Count 2 | Count 3 | Count 4 | Count 5 | Count 6 | Count 7 | Count 8 |
|
Labour Party |
Johnnie Penrose* |
22.11 |
1,643 |
|
|
|
|
|
|
|
|
Fianna Fáil |
Robert Troy* |
21.36 |
1,587 |
|
|
|
|
|
|
|
|
Fine Gael |
Fintan Cooney* |
11.84 |
880 |
925 |
961 |
982 |
1,121 |
1,156 |
1,181 |
1,264 |
|
Fianna Fáil |
Ken Glynn* |
11.04 |
820 |
851 |
984 |
1,006 |
1,023 |
1,048 |
1,069 |
1,112 |
|
Labour Party |
Detty Cornally* |
10.75 |
799 |
978 |
1,017 |
1,058 |
1,084 |
1,151 |
1,230 |
1,383 |
|
Fine Gael |
Chris Murtagh |
6.27 |
466 |
533 |
612 |
624 |
659 |
674 |
706 |
754 |
|
Independent |
Betty Doran* |
4.41 |
328 |
350 |
366 |
396 |
405 |
462 |
519 |
|
|
Sinn Féin |
Sorcha Clarke |
3.49 |
259 |
279 |
290 |
311 |
321 |
353 |
|
|
|
Fine Gael |
John Casey |
3.20 |
238 |
250 |
260 |
268 |
|
|
|
|
|
Independent |
Frank McIntyre |
3.03 |
225 |
245 |
259 |
272 |
279 |
|
|
|
|
Independent |
Rashid Butt |
2.49 |
185 |
193 |
203 |
|
|
|
|
|
| Electorate: 13,526 Valid: 7,430 (54.93%) Spoilt: 106 Quota: 1,239 Turnout: 7,536 (55.71%) |
External links