Irish local elections, 2009
| | |||||||||||||||||||||||||||||||||||||||||||||||||||||||||||||||||||||||||||||||||||||||||||
| |||||||||||||||||||||||||||||||||||||||||||||||||||||||||||||||||||||||||||||||||||||||||||
| |||||||||||||||||||||||||||||||||||||||||||||||||||||||||||||||||||||||||||||||||||||||||||
 |
| This article is part of a series on the politics and government of the Republic of Ireland |
|
Judiciary |
|
Administrative geography |
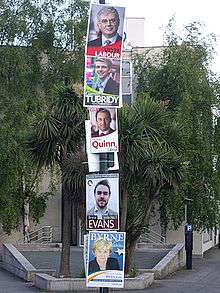
The 2009 Irish local elections were held in all the counties, cities and towns of the Republic of Ireland on Friday, 5 June 2009, on the same day as the European Parliament election and two by-elections (Dublin South and Dublin Central).[1]
Overview
The election results were significant for a number of reasons:
- Fine Gael gained 88 seats and became the largest party at local level for the first time ever.
- Fianna Fáil lost 135 seats and became the second largest party nationally, and third largest in Dublin.
- The Labour Party increased its seat total by 43 seats, and is the largest party in Dublin City Council. It also has the most seats in the four Dublin local authorities.
- Sinn Féin support remained at the almost same level, gaining 2 seats.
- The Green Party lost 14 seats and had 3 county councillors.
- People Before Profit Alliance won 5 seats in their first local elections.
- The Socialist Party won 6 seats, a gain of 2 seats.
Results
The total number of the Irish electorate eligible to vote in election was 3,259,253. A total of 1,880,589 first preference votes were cast, representing a turnout of 57.7%.
The Progressive Democrats and Independent Fianna Fáil did not compete in the elections. As they competed in the previous elections, totals for vote and seat changes may not total zero. People Before Profit Alliance figures are compared to Socialist Workers Party figures from the previous local elections.
All councils
| Party | County | City | Borough | Town | Total | ± | |
|---|---|---|---|---|---|---|---|
| Fine Gael | 305 | 35 | 16 | 200 | 556 | +88 | |
| Fianna Fáil | 201 | 17 | 11 | 178 | 407 | –135 | |
| Labour Party | 94 | 38 | 13 | 86 | 231 | +43 | |
| Sinn Féin | 41 | 13 | 8 | 65 | 127 | +2 | |
| Green Party | 3 | 0 | 2 | 13 | 18 | –14 | |
| Workers and Unemployed Action | 2 | 0 | 4 | 1 | 7 | +5 | |
| Socialist Party | 3 | 1 | 1 | 1 | 6 | +2 | |
| People Before Profit | 3 | 2 | 0 | 0 | 5 | +5 | |
| Workers' Party | 0 | 2 | 0 | 0 | 2 | +0 | |
| South Kerry Independent | 1 | 0 | 0 | 1 | 2 | – | |
| Letterkenny Residents Party | 0 | 0 | 0 | 1 | 1 | New | |
| Independent | 102 | 22 | 10 | 141 | 275 | +10 | |
| Totals | 753 | 130 | 60 | 684 | 1,627 | — | |
County and city councils
| Party | Seats | ± | First Pref. votes | FPv% | ±% | |
|---|---|---|---|---|---|---|
| Fine Gael | 340 | +47 | 605,333 | 32.2 | +4.6 | |
| Fianna Fáil | 218 | –84 | 477,342 | 25.4 | –6.4 | |
| Labour Party | 132 | +31 | 276,627 | 14.7 | +3.3 | |
| Sinn Féin | 54 | — | 138,405 | 7.4 | –0.6 | |
| People Before Profit | 5 | +5 | 15,879 | 0.8 | +0.5 | |
| Socialist Party | 4 | — | 16,052 | 0.9 | +0.2 | |
| Green Party | 3 | –15 | 44,152 | 2.3 | –1.6 | |
| Workers' Party | 2 | — | 4,771 | 0.3 | +0.1 | |
| Workers and Unemployed Action | 2 | 3,590 | 0.2 | |||
| South Kerry Independent | 1 | — | 2,536 | 0.1 | — | |
| Seniors Solidarity | 0 | — | 1,319 | 0.1 | New | |
| Christian Solidarity | 0 | — | 467 | 0.0 | — | |
| Independent | 122 | +37 | 294,094 | 15.6 | +4.5 | |
| Totals | 883 | — | 1,880,589 | — | — | |
Breakdown in each council
| Authority | FG | FF | Lab | SF | PBP | SP | GP | WUA | WP | SKIA | Ind | Total | ||||||||||||
|---|---|---|---|---|---|---|---|---|---|---|---|---|---|---|---|---|---|---|---|---|---|---|---|---|
| Carlow | 10 | 4 | 5 | 2 | 21 | Details | ||||||||||||||||||
| Cavan | 13 | 8 | 4 | 25 | Details | |||||||||||||||||||
| Clare | 12 | 11 | 1 | 1 | 7 | 32 | Details | |||||||||||||||||
| Cork | 22 | 12 | 7 | 1 | 6 | 48 | Details | |||||||||||||||||
| Cork City | 8 | 6 | 7 | 4 | 1 | 1 | 4 | 31 | Details | |||||||||||||||
| Donegal | 8 | 10 | 2 | 4 | 5 | 29 | Details | |||||||||||||||||
| Dublin City | 12 | 6 | 19 | 7 | 2 | 6 | 52 | Details | ||||||||||||||||
| Dún Laoghaire–Rathdown | 11 | 4 | 8 | 2 | 3 | 28 | Details | |||||||||||||||||
| Fingal | 6 | 4 | 9 | 3 | 2 | 24 | Details | |||||||||||||||||
| Galway | 13 | 7 | 1 | 1 | 8[fn 1] | 30 | Details | |||||||||||||||||
| Galway City | 3 | 3 | 5 | 4 | 15 | Details | ||||||||||||||||||
| Kerry | 10 | 7 | 4 | 2 | 1 | 3 | 27 | Details | ||||||||||||||||
| Kildare | 9 | 6 | 6 | 4 | 25 | Details | ||||||||||||||||||
| Kilkenny | 12 | 7 | 5 | 1 | 1 | 26 | Details | |||||||||||||||||
| Laois | 12 | 8 | 1 | 1 | 3 | 25 | Details | |||||||||||||||||
| Leitrim | 10 | 8 | 2 | 2 | 22 | Details | ||||||||||||||||||
| Limerick | 15 | 9 | 2 | 2 | 28 | Details | ||||||||||||||||||
| Limerick City | 8 | 1 | 4 | 1 | 3 | 17 | Details | |||||||||||||||||
| Longford | 10 | 8 | 3 | 21 | Details | |||||||||||||||||||
| Louth | 8 | 5 | 2 | 6 | 1 | 4 | 26 | Details | ||||||||||||||||
| Mayo | 17 | 7 | 2 | 5 | 31 | Details | ||||||||||||||||||
| Meath | 11 | 8 | 4 | 1 | 5 | 29 | Details | |||||||||||||||||
| Monaghan | 6 | 5 | 7 | 2 | 20 | Details | ||||||||||||||||||
| North Tipperary | 4 | 6 | 3 | 1 | 7[fn 2] | 21 | Details | |||||||||||||||||
| Offaly | 6 | 9 | 6 | 21 | Details | |||||||||||||||||||
| Roscommon | 10 | 8 | 1 | 7 | 26 | Details | ||||||||||||||||||
| Sligo | 12 | 7 | 2 | 1 | 3 | 25 | Details | |||||||||||||||||
| South Dublin | 8 | 4 | 9 | 3 | 1 | 1 | 26 | Details | ||||||||||||||||
| South Tipperary | 12 | 6 | 3 | 2 | 3 | 26 | Details | |||||||||||||||||
| Waterford | 11 | 5 | 4 | 2 | 1 | 23 | Details | |||||||||||||||||
| Waterford City | 4 | 1 | 3 | 1 | 1 | 5 | 15 | Details | ||||||||||||||||
| Westmeath | 8 | 9 | 6 | 23 | Details | |||||||||||||||||||
| Wexford | 10 | 5 | 4 | 2 | 21 | Details | ||||||||||||||||||
| Wicklow | 9 | 4 | 6 | 2 | 3 | 24 | Details | |||||||||||||||||
| Totals | 340 | 218 | 132 | 54 | 5 | 4 | 3 | 2 | 2 | 1 | 122 | 883 | ||||||||||||
Following the June 2009 local elections Fine Gael were the largest political party on 24 councils, the Labour Party on 4 councils, Fianna Fáil on 3 councils, Independents on 2 councils and Sinn Féin on 1 council.
Borough and town councils
| Party | Seats | ± | ||
|---|---|---|---|---|
| Fine Gael | 216 | +44 | ||
| Fianna Fáil | 189 | –53 | ||
| Labour Party | 99 | +12 | ||
| Sinn Féin | 73 | +2 | ||
| Green Party | 15 | +1 | ||
| Others | 151 | –6 | ||
Borough councils
| Authority | FG | Lab | FF | SF | GP | Others | ||||||
|---|---|---|---|---|---|---|---|---|---|---|---|---|
| Clonmel | 2 | 2 | 2 | 6[fn 3] | ||||||||
| Drogheda | 4 | 2 | 1 | 3 | 2 | |||||||
| Kilkenny | 4 | 2 | 4 | 1 | 1 | |||||||
| Sligo | 3 | 3 | 2 | 3 | 1 | |||||||
| Wexford | 3 | 4 | 2 | 1 | 1 | 1 | ||||||
| Totals | 16 | 13 | 11 | 8 | 2 | 10 | ||||||
Town councils
| Town | Fianna Fáil | Fine Gael | Labour Party | Sinn Féin | Green Party | Others | Total |
|---|---|---|---|---|---|---|---|
| Ardee | 2 | 2 | 1 | 1 | 1 | 2 | 9 |
| Arklow | 3 | 1 | 2 | 3 | 9 | ||
| Athlone | 3 | 3 | 1 | 1 | 1 | 9 | |
| Athy | 1 | 2 | 4 | 1 | 1 | 9 | |
| Balbriggan | 1 | 1 | 3 | 1 | 3 | 9 | |
| Ballina | 3 | 3 | 3 | 9 | |||
| Ballinasloe | 2 | 3 | 1 | 3 | 9 | ||
| Ballybay | 4 | 4 | 1 | 9 | |||
| Ballyshannon | 2 | 5 | 1 | 1 | 9 | ||
| Bandon | 4 | 3 | 1 | 1 | 9 | ||
| Bantry | 5 | 3 | 1 | 9 | |||
| Belturbet | 1 | 3 | 5 | 9 | |||
| Birr | 4 | 2 | 3 | 9 | |||
| Boyle | 2 | 4 | 1 | 2 | 9 | ||
| Bray | 2 | 3 | 3 | 2 | 1 | 1 | 12 |
| Buncrana | 2 | 3 | 2 | 2 | 9 | ||
| Bundoran | 3 | 2 | 2 | 2 | 9 | ||
| Carlow | 3 | 3 | 1 | 1 | 1 | 9 | |
| Carrickmacross | 2 | 3 | 2 | 2 | 9 | ||
| Carrick-on-Suir | 2 | 1 | 1 | 1 | 4[fn 3] | 9 | |
| Cashel | 2 | 2 | 1 | 4 | 9 | ||
| Castlebar | 1 | 4 | 1 | 1 | 2 | 9 | |
| Castleblayney | 3 | 2 | 3 | 1 | 9 | ||
| Cavan | 3 | 4 | 1 | 1 | 9 | ||
| Clonakilty | 2 | 2 | 1 | 1 | 3 | 9 | |
| Clones | 2 | 2 | 3 | 2 | 9 | ||
| Cobh | 1 | 2 | 3 | 1 | 2 | 9 | |
| Cootehill | 3 | 3 | 2 | 1 | 9 | ||
| Dundalk | 3 | 2 | 3 | 2 | 2 | 12 | |
| Dungarvan | 2 | 3 | 3 | 1 | 9 | ||
| Edenderry | 3 | 2 | 1 | 3 | 9 | ||
| Ennis | 1 | 3 | 1 | 1 | 3 | 9 | |
| Enniscorthy | 2 | 2 | 1 | 1 | 3 | 9 | |
| Fermoy | 2 | 2 | 2 | 1 | 2 | 9 | |
| Gorey | 4 | 4 | 1 | 9 | |||
| Granard | 3 | 2 | 1 | 3 | 9 | ||
| Greystones | 2 | 4 | 2 | 1 | 9 | ||
| Kells | 3 | 2 | 2 | 1 | 1 | 9 | |
| Kilkee | 4 | 4 | 1 | 9 | |||
| Killarney | 2 | 1 | 2 | 4[fn 4] | 9 | ||
| Kilrush | 3 | 3 | 3 | 9 | |||
| Kinsale | 2 | 2 | 2 | 1 | 1 | 1 | 9 |
| Leixlip | 1 | 3 | 2 | 1 | 2 | 9 | |
| Letterkenny | 4 | 1 | 1 | 3 | 9 | ||
| Lismore | 3 | 3 | 1 | 2 | 9 | ||
| Listowel | 3 | 4 | 2 | 9 | |||
| Longford | 2 | 3 | 4 | 9 | |||
| Loughrea | 3 | 2 | 4 | 9 | |||
| Macroom | 3 | 4 | 2 | 9 | |||
| Mallow | 1 | 2 | 4 | 1 | 1 | 9 | |
| Midleton | 1 | 2 | 1 | 1 | 4 | 9 | |
| Monaghan | 1 | 3 | 4 | 1 | 9 | ||
| Mountmellick | 3 | 3 | 1 | 1 | 1 | 9 | |
| Muine Bheag | 3 | 3 | 2 | 1 | 9 | ||
| Mullingar | 3 | 2 | 4 | 9 | |||
| Naas | 1 | 3 | 2 | 3 | 9 | ||
| Navan | 4 | 2 | 2 | 1 | 9 | ||
| Nenagh | 2 | 2 | 2 | 1 | 2 | 9 | |
| Newbridge | 2 | 2 | 2 | 3 | 9 | ||
| New Ross | 3 | 2 | 2 | 1[fn 5] | 1 | 9 | |
| Passage West | 2 | 3 | 1 | 3 | 9 | ||
| Portlaoise | 2 | 3 | 2 | 2 | 9 | ||
| Shannon | 4 | 2 | 1 | 2 | 9 | ||
| Skibbereen | 2 | 4 | 2 | 1 | 9 | ||
| Templemore | 3 | 3 | 3[fn 2] | 9 | |||
| Thurles | 1 | 1 | 2 | 1 | 4[fn 2] | 9 | |
| Tipperary | 3 | 1 | 1 | 4 | 9 | ||
| Tralee | 2 | 3 | 3 | 2 | 1 | 12 | |
| Tramore | 1 | 4 | 1 | 3 | 9 | ||
| Trim | 2 | 3 | 2 | 2 | 9 | ||
| Tuam | 3 | 2 | 2 | 2 | 9 | ||
| Tullamore | 4 | 2 | 2 | 1 | 9 | ||
| Westport | 2 | 5 | 1 | 1 | 9 | ||
| Wicklow | 1 | 3 | 1 | 1 | 1 | 2 | 9 |
| Youghal | 3 | 2 | 1 | 2 | 1 | 9 |
See also
- Local government in the Republic of Ireland
- Category:Irish local government councils
Footnotes
- ↑ Includes Tomás Ó Curraoin of Republican Sinn Féin, which is an unregistered party.
- 1 2 3 Michael Lowry's organisation has 4 County Councillors in North Tipperary, 2 Town Councillors in Thurles and 1 Town Councillor in Templemore.
- 1 2 The Workers and Unemployed Action Group has 2 County Councillors in South Tipperary, 4 Borough Councillors in Clonmel and 1 Town Councillor in Carrick-on-Suir.
- ↑ Michael Gleeson of the South Kerry Independent Alliance is included in this total.
- ↑ John Dwyer resigned from Sinn Féin and changed designation to Non-Party before the first meeting of New Ross Town Council.
References
- Department of the Environment, Heritage and Local Government (2010). Local Elections 2009: Results, Transfer of Votes and Statistics (PDF). Dublin: Stationery Office. ISBN 9781406425109.
- ↑ "By-elections set for June 5th". The Irish Times. 28 April 2009. Retrieved 29 April 2009.
