Task Manager (Windows)
| A component of Microsoft Windows | |
|---|---|
|
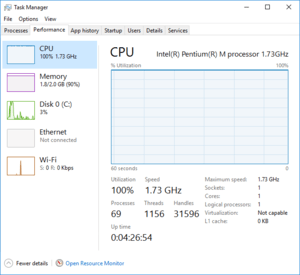
Screenshot of Task Manager in Windows 10 showing the Performance tab | |
| Details | |
| Type | Task manager, system monitor and startup manager |
| Included with | Microsoft Windows NT 4.0 and onwards |
| Replaces | System Monitor |
| Related components | |
| Resource Monitor, MSConfig | |
Task Manager, previously known as Windows Task Manager, is a task manager, system monitor, and startup manager included with Microsoft Windows systems. It provides limited information about computer performance and running applications, processes and CPU usage, commit charge and memory information, network activity and statistics, logged-in users, and system services. The Task Manager can also be used to set process priorities, processor affinity, forcibly terminate processes, and shut down, restart, hibernate, or log off from Windows. Windows Task Manager was introduced with Windows NT 4.0. Previous versions of Windows NT included the Task List application, which had far fewer features. The task list was capable of listing currently running processes and killing them, or creating a new process. In Windows XP only, a Shutdown menu is also present that allows access to Standby, Hibernate, Turn off, Restart, Log Off, and Switch User.
Windows 3.x and Windows 9x had a program known as tasks to display the programs currently running. This file was executed by running the taskman.exe file from the C:\Windows directory.[1]
The program can be started in recent versions of Windows by pressing WIN+R and then typing in taskmgr.exe, by pressing CTRL+ALT+DEL and clicking Start Task Manager, or by pressing CTRL+SHIFT+ESC.
Functionality

Applications
The Applications tab in Task Manager shows a list of programs currently running. A set of rules determines whether a process appears on this tab or not. Most applications that have a taskbar entry will appear on this tab, but this is not always the case.
Right-clicking any of the applications in the list allows (among other things) switching to that application, ending the application, and showing the process on the Processes tab that is associated with the application.
Choosing to End Task from the Applications tab causes a request to be sent to the application for it to terminate. This is different from what happens when End Process is chosen from the Processes tab.
Processes
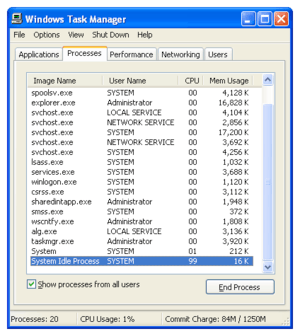
The Processes tab shows a list of all running processes on the system. This list includes services and processes from other accounts. Prior to Windows XP, process names longer than 15 characters in length are truncated.[2] Beginning with Windows XP, the Delete key can also be used to terminate processes on the Processes tab.
Right-clicking a process in the list allows changing the priority the process has, setting processor affinity (setting which CPU(s) the process can execute on), and allows the process to be ended. Choosing to End Process causes Windows to immediately kill the process. Choosing to "End Process Tree" causes Windows to immediately kill the process, as well as all processes directly or indirectly started by that process. Unlike choosing End Task from the Applications tab, when choosing to End Process the program is not given warning nor a chance to clean up before ending. However, when a process that is running under a security context different from the one of the process which issued the call to TerminateProcess, the use of the KILL command line utility is required.[3]
By default the processes tab shows the user account the process is running under, the amount of CPU, and the amount of memory the process is currently consuming. There are many more columns that can be shown by choosing Select columns... from the View menu.
Performance
The performance tab shows overall statistics about the system's performance, most notably the overall amount of CPU usage and how much memory is being used. A chart of recent usage for both of these values is shown. Details about specific areas of memory are also shown.
There is an option to break the CPU usage graph into two sections: kernel mode time and user mode time. Many device drivers, and core parts of the operating system run in kernel mode, whereas user applications run in user mode. This option can be turned on by choosing Show kernel times from the View menu. When this option is turned on the CPU usage graph will show a green and a red area. The red area is the amount of time spent in kernel mode, and the green area shows the amount of time spent in user mode.
Networking
The Networking tab, introduced in Windows XP, shows statistics relating to each of the network adapters present in the computer. By default the adapter name, percentage of network utilization, link speed and state of the network adapter are shown, along with a chart of recent activity. More options can be shown by choosing Select columns... from the View menu.
Users
The Users tab, also introduced in Windows XP, shows all users that currently have a session on the computer. On server computers, there may be several users connected to the computer using Terminal Services. As of Windows XP, there may also be multiple users logged onto the computer at one time using the Fast User Switching feature. Users can be disconnected or logged off from this tab.
Update interval
The update interval can be set to High (0.5 s), Normal (2 s), Low (4 s), or Paused. Once changed in Windows XP, the default update rate of 1 s can only be reset by editing the Registry binary data in HKEY_CURRENT_USER\Software\Microsoft\Windows NT\CurrentVersion\TaskManager\Preferences. The interval is stored in milliseconds at offset 04, "e8 03" sets it to 1000 ms.
User interface
Applications tab
- Task manager defines Application or Task as a window owned by a specific thread. Not all windows are shown in this view. For example, modal dialogs (windows for which there is not a separate thread) do not appear. This is why many dialogs and error messages are not shown. The term Task used in the first column can be confusing, as there is no inherent concept of Tasks on Windows Operating System, except those configured in the Task Scheduler to run periodically.
- The Status column shows the status of the thread that owns a window, in terms of windows message processing. When the status of an application appears as Running this indicates that the thread is responsive to windows messages. When the status appears as Not Responding it means that the thread is not, at the moment, responsive to windowing messages. It could be waiting (sometimes referred to as "blocked") for other events such as I/O requests, or executing compute-bound code.
Processes tab
- The Mem Usage column on the Processes shows the processes' working set.[4]
- The VM Size column (not shown by default) is not the amount of virtual memory used by the process; it is actually the process's private bytes.
- The CPU column displays percent of CPU loading, it is calculated by trimming the CPU consumption to fit in a two-digit rounded format. A process consuming 0.9% of CPU will be reported as 00 in the Task Manager.
- The System Idle Process is the first process that is created when Windows is loaded, and it always has a process ID of 0. There is one thread in the System Idle Process for each CPU in the system. When the CPU has no other work to do, the Windows scheduler selects the CPU's corresponding idle thread for execution. The accumulated CPU time of this process therefore shows the total CPU time that has not been used. In early versions of Windows NT the idle threads were short idle loops consisting primarily of a "halt" instruction; in later Windows versions, the idle threads invoke more sophisticated methods of CPU power management.
The layout can be configured by the user by selecting "View" then "Select Columns..." from the menu. Up to thirty different columns (depending on the version of Windows) can be selected for display including various memory and I/O options and the number of handles and threads in use.
Performance tab
- Interrupts and DPC time are shown on the CPU graph, which may lead to the confusing situation where the Performance tab shows significant CPU usage, while the Processes tab shows the system is completely idle.
- Prior to Windows Vista, the second graph was named PF Usage and Page File Usage History, when in fact it represented Commit Charge and Commit Charge History.
- Windows Memory Manager optimizes physical memory to achieve best performance by implementing a shared memory mechanism. Mapped files such as DLLs used by multiple processes are instantiated one single time in physical memory, and then shared across all referring processes. As memory consumption is accounted individually for each process, the total of all process working sets will commonly be larger than the actual total memory being used.
Tiny footprint mode
Task Manager has an alternate interface without any menu options or tabs. This is called the Tiny Footprint mode. Double-clicking on any empty space besides the data and/or menus changes Task Manager into this mode; double-clicking in the border switches it back.[5]
Tiny Footprint mode shows the data of the tab selected when Tiny Footprint mode is entered. In some versions of Windows, the keyboard shortcuts Ctrl+Tab, Ctrl+Shift+Tab or Ctrl+PageUp/PageDown may be used to cycle through the Tiny Footprint view for each tab normally visible outside of this mode. Tiny Footprint mode does not show the memory usage graph if the tab selected is Performance.
History
Windows 9x
A Close Program dialog box comes up when Ctrl+Alt+Del is pressed in Windows 9x. Also, in Windows 9x, there is a program called Tasks (TASKMAN.EXE) located in the Windows directory. TASKMAN.EXE is rudimentary and has fewer features. The System Monitor utility in Windows 9x contains process and network monitoring functionality similar to that of the Windows Task Manager. (Also, Tasks program is called by clicking twice on desktop if Explorer process is down.)
Windows Vista
Windows Task Manager has been updated in Windows Vista with new features, including:
- A "Services" tab to view and/or modify currently running services and start and stop any service as well as enable/disable the UAC file and registry virtualization of a process.
- New "Image Path Name" and "Command Line", and "Description" columns in the Processes tab. These show the full name and path of the executable image running in a process, any command line parameters that were provided, and the image file's "Description" property.
- New columns showing DEP status and virtualization status. Virtualization status refers to UAC virtualization, under which file and registry references to certain system locations will be silently redirected to user-specific areas.
- By right-clicking on any process, it is possible to directly open the Properties of the process's executable image file or of the directory (folder) containing the process.
- The Task Manager has also been made less vulnerable to attack from remote sources or viruses as it must be operating under administrative rights to carry out certain tasks, such as logging off other connected users or sending messages. The user must go into the "Processes" tab and click "Show processes from other users" in order to verify administrative rights and unlock these privileges. Showing processes from all users requires all users including administrators to accept a UAC prompt, unless UAC is disabled. If the user is not an administrator, they must enter a password for an administrator account when prompted to proceed, unless UAC is disabled, in which case the elevation does not occur.
- By right-clicking on any running process, it is possible to create a dump. This feature can be useful if an application or a process is not responding, so that the dump file can be opened in a debugger to get more information.
- The Shutdown menu containing Standby, Hibernate, Turn off, Restart, Log Off and Switch User has been removed.
- The Performance tab shows the system uptime.
Windows 8

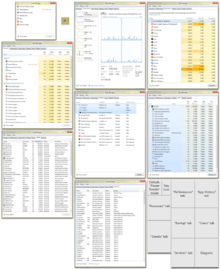
In Windows 8, Windows Task Manager has been overhauled and the following changes were made:
- The tabs are hidden by default. This view only shows applications and their associated processes.
- Resource utilization in the Processes tab is shown with various shades of yellow, with darker color representing heavier use.
- The Performance tab is split into CPU, memory, disk, ethernet, and wireless network (if applicable) sections. There are overall graphs for each, and clicking on one reaches details for that particular resource.
- The CPU tab no longer displays individual graphs for every logical processor on the system by default. It now can show data for each NUMA node.
- The CPU tab now displays simple percentages on heat-mapping tiles to display utilization for systems with many (64 or more, up to 640) logical processors.[6] The color used for these heat maps is blue, with darker color again indicating heavier utilization.
- Hovering the cursor over any logical processor's data now shows the NUMA node of that processor and its ID.
- A new Startup tab has been added that lists running startup applications.[7]
- The Processes tab now lists application names, application status, and overall usage data for CPU, memory, hard disk, and network resources for each process.
- The application status can be changed to suspended.
- The normal process information found in the older Task Manager can be found in the new Details tab.
Weakness
Task Manager is a common target of computer viruses and other forms of malware; typically malware will close the Task Manager as soon as it is started, so as to hide itself from users. Variants of the Zotob and Spybot worms have used this technique, for example.[8] Using Group Policy, it is possible to disable the Task Manager. Many types of malware also enable this policy setting in the registry. Rootkits can prevent themselves from getting listed in the Task Manager, thereby preventing their detection and termination using it.
See also
- Resource Monitor
- Process Explorer
- Activity Monitor (in OS X systems)
- Ksysguard
- Taskkill
- Tasklist
- Windows Task Scheduler
References
- ↑ Computer Hope web site.
- ↑ Magic 15 with GetProcessesByName on Windows 2000
- ↑ "Cannot End Service Processes with Task Manager". Support.microsoft.com. 2007-02-27. Retrieved 2012-12-06.
- ↑ "Process counter column headings", Windows XP Task Manager Help, Microsoft Corporation,
Memory Usage: In Task Manager, the current working set of a process, in kilobytes. The current working set is the number of pages currently resident in memory. On the Task Manager Processes tab, the column heading is Mem Usage.
- ↑ "Task Manager Menu Bar and Tabs Are Not Visible", Help and Support, Microsoft, 2007-05-07, retrieved 2007-08-07
- ↑ "Using Task Manager with 64+ logical processors". Retrieved October 29, 2011.
- ↑ "How to Get the Most out of New Windows 8 Task Manager?". Retrieved October 29, 2011.
- ↑ Task Manager, MSCONFIG, or REGEDIT disappears while opening
External links
- How to use and troubleshoot issues with Windows Task Manager, Microsoft Help and Support
- Windows 8 Task Manager In-Depth, Gavin Gear, Blogging Windows

.svg.png)