1970 Pacific typhoon season
| |
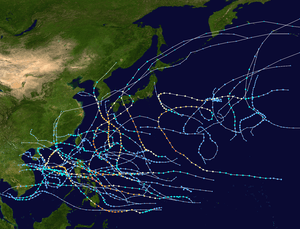
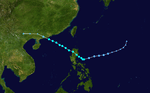
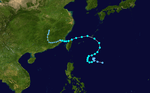
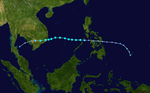
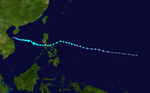
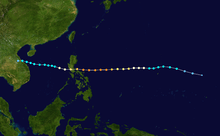
| Season summary map |
| First system formed |
February 19, 1970 |
| Last system dissipated |
December 17, 1970 |
| Strongest storm1 |
Hope – 900 hPa (mbar), 280 km/h (175 mph) |
| Total depressions |
30 |
| Total storms |
24 |
| Typhoons |
12 |
| Super typhoons |
7 |
| Total fatalities |
3909 |
| Total damage |
Unknown |
| 1Strongest storm is determined by lowest pressure |
Pacific typhoon seasons
1968, 1969, 1970, 1971, 1972 |
The 1970 Pacific typhoon season has no official bounds; it ran year-round in 1970, but most tropical cyclones tend to form in the northwestern Pacific Ocean between June and December. These dates conventionally delimit the period of each year when most tropical cyclones form in the northwestern Pacific Ocean.
The scope of this article is limited to the Pacific Ocean, north of the equator and west of the international date line. Storms that form east of the date line and north of the equator are called hurricanes; see 1970 Pacific hurricane season. Tropical Storms formed in the entire west Pacific basin were assigned a name by the Joint Typhoon Warning Center. Tropical depressions in this basin have the "W" suffix added to their number. Tropical depressions that enter or form in the Philippine area of responsibility are assigned a name by the Philippine Atmospheric, Geophysical and Astronomical Services Administration or PAGASA. This can often result in the same storm having two names.
Storms
27 tropical depressions formed this year in the Western Pacific, of which 24 became tropical storms. 12 storms reached typhoon intensity, of which 7 reached super typhoon strength.
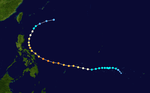
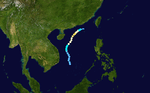
Typhoon Nancy (Atang)
| Typhoon (JMA) |
| Category 4 typhoon (SSHWS) |
|
|
| Duration |
February 19 – February 28 |
| Peak intensity |
220 km/h (140 mph) (1-min) 950 hPa (mbar) |
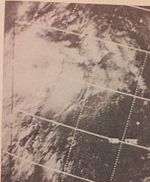
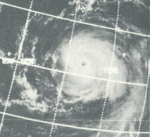
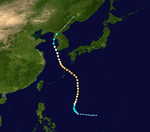
Nancy originated from the interaction between an active ITCZ and a cold front near the Caroline Islands and the equator in mid February. An increase in convection was shown by weather satellites on February 18 and by the following day a recon aircraft found a weak depression to the south of the Caroline Islands. The depression moved west, suppressed south by a high pressure ridge to the north, and gradually strengthened into a tropical storm and was given the name Nancy early on February 20. Nancy became a typhoon on the 22 about 100 miles northwest from Woleai. On February 23 Nancy passed to the north of Yap where strong gale winds occurred. Continuing to encounter more favorable conditions Nancy was able to achieve a peak intensity of 140 mph (220 km/h) and a pressure of 952 hPa (28.1 inHg) on February 24.[1] This was the equivalent of a category four hurricane. It is rare to have a typhoon of this magnitude during the month of February, as noted by the JTWC, only Irma of the 1953 season reached the same intensity at the time. As Nancy approached the Philippine Islands the typhoon traversed to the western ambit of the ridge that had kept it to the south, allowing it to move farther in a north direction. During the 25 Nancy passed east off the coast of the easternmost islands of the Philippines. On the island of Catanduanes, the edge of the eye brushed the eastern coast. A U. S. Coast Guard loran station on Catanduanes recorded intense winds, at which point the equipment malfunctioned. The storm encountered a hostile environment to the northeast of Luzon and began to weaken. By February 26 Nancy had become a tropical storm and shortly afterward had transitioned into an extra tropical cyclone and moved off into open ocean. By the 28 what remained of Nancy was a frontal trough.[2]
Nancy caused significant damage to the Philippines and surrounding islands. Particularly hard hit were the islands of Catanduanes and Samar. Damage was estimated near a million dollars with 5,000 families homeless. On the Island of Yap heavy storm surge caused $160,000 in damages, luckily no one was killed. A 6,065 ton American ship, Antinous, encountered the full brunt of the typhoon shortly before midnight, February 24. Ship logs record sea swells of over 40 feet, winds over 100 knots, a central pressure of 953 millibars, and three of the ships large butane tanks on the main dock broke free during the storm along with a portion of its bulwark.[2]
CMA Tropical Depression Two
| Tropical depression (CMA) |
|
|
| Duration |
March 15 – March 17 |
| Peak intensity |
35 km/h (25 mph) (10-min) 1004 hPa (mbar) |
On March 14 the CMA started to track an area of disturbed weather east of Yap. It moved in a northwest direction before tracking over Yap on March 15 at which point it had become a tropical depression. Continuing to track in a northwest direction it eventually reached a peak intensity of 25 mph (40 km/h) and a pressure of 1,004 hPa (29.6 inHg) on March 16. Late on March 17 the depression moved into the Philippines.[3]
CMA Tropical Storm 03
| Tropical storm (CMA) |
|
|
| Duration |
June 11 – June 16 |
| Peak intensity |
75 km/h (45 mph) (10-min) 992 hPa (mbar) |
On June 11 the CMA began tracking a tropical depression in the South China Sea, west of Luzon. The depression moved northeast toward Taiwan. Early on June 13 the HKO started to track the depression while the CMA had upgraded it into a tropical storm. Not long after, the storm passed over Taiwan and weakened back to a depression. It regained strength on June 14, while the HKO stopped tracking it, the CMA continued to monitor its intensification. By midday it reached a peak strength of 45 mph (75 km/h) and a pressure of 992 hPa (29.3 inHg) while located to the south of the Korean Peninsula. The tropical storm passed over the island of Jeju and brushed the southern tip of South Korea. While in the Yellow Sea the storm weakened back to a depression and sharply curved toward Shandong before dissipating on June 16.[4]
Tropical Depression Bising
| Tropical depression (PAGASA) |
|
|
| Duration |
June 13 – June 17 |
| Peak intensity |
55 km/h (35 mph) (10-min) 1000 hPa (mbar) |
The CMA tracked a weak depression in the South China Sea a few days following Tropical Storm Three. It took a similar track to the east-northeast toward Luzon. It reached a peak intensity of 35 mph (55 km/h) and a pressure of 1,000 hPa (30 inHg) on June 15. It took a turn to the northwest off the coast of Taiwan which then brought it inland. It dissipated on June 17 north of Taiwan.[5]
CMA Tropical Depression Five
| Tropical depression (CMA) |
|
|
| Duration |
June 20 – June 22 |
| Peak intensity |
35 km/h (25 mph) (10-min) 1002 hPa (mbar) |
Following a string of storms in the South China Sea another depression formed on June 20. It moved north-northwest, reaching a peak of 25 mph (40 km/h) and a pressure of 1,002 hPa (29.6 inHg), before making landfall on Hainan. It took a curved path in the Gulf of Tonkin which lead it to make its second landfall in Vietnam.[6]
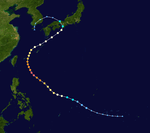
Typhoon Olga (Deling)
| Typhoon (JMA) |
| Category 5 super typhoon (SSHWS) |
|
|
| Duration |
June 27 – July 5 |
| Peak intensity |
260 km/h (160 mph) (1-min) 905 hPa (mbar) |
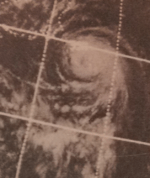
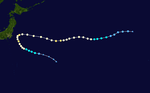
In mid-June a change in the jet stream over a large part of the Pacific Ocean caused an increase in tropical wave frequency. One of these waves would become the precursor to Olga. The wave was first noticed near the Marshall Islands, particularly the Island of Majuro on June 24. As it moved west weather satellites depicted the wave had begun to organize with considerable convection and spiraling storm bands as it neared the Central Caroline Islands. Due to the waves close proximity to a high pressure area to the north, strong easterlies accelerated it to the west. The increased forward speed inhibited the establishment of a circulation until it was south of Guam early on June 29, though the JMA had classified it a tropical depression two days earlier. Later that day reconnaissance had detected a closed center and gale force winds and the low was upgraded to a tropical storm and was given the name Olga. As it entered the Philippine Sea the ridge that had kept it to the south began to weaken allowing Olga to move in a northwestward direction. Moving into an increasingly favorable environment, the storm slowed in its forward speed, and strengthened into a typhoon late on June 29. Rapid intensification followed as the system bottomed out at a pressure of 906 hPa (26.8 inHg) and winds of 160 mph (260 km/h) on July 1.[7] The strengthening happened within a little over a day brought it to a super typhoon, the first of the season. The 62 millibar drop with the day of June 30 and July 1 caused a very high wind profile around the six mile radius eye. The storm followed a break in the ridge and moved northward while weakening gradually. While passing to the east of Taiwan a short wave from the Chinese mainland caused a sharp direction change in Olga's path. A low developed in the wake of the short wave, dominated Olga causing the typhoon to greatly weaken. Dry air soon entered the circulation caused a shallowing in the systems overall convection. By July 5 Olga made landfall on the Kansai region, south of Osaka, as a tropical storm. The system continued into the Sea of Japan, and became merged within a cold front. The remaining low tracked over South Korea before completely dissipating on July 7.[2]
Olga was a very intense typhoon, causing an estimated ten million dollars to Japan alone. While passing through the Ryukyu Islands wind measurement were as high as 130 mph (205 km/h) as it passed 50 miles to the west on July 4. Heavy rains occurred over Japan, up to 14 inches, caused landslides and extensive flooding in some areas, as well as in South Korea. In Japan 20 fatalities were recorded and in South Korea 29 were recorded due to the extreme rainfall.[2]
Severe Tropical Storm Pamela (Klaring)
| Severe tropical storm (JMA) |
| Tropical Storm (SSHWS) |
|
|
| Duration |
June 28 – July 1 |
| Peak intensity |
95 km/h (60 mph) (1-min) 980 hPa (mbar) |
Severe Tropical Storm Ruby (Emang)
| Severe tropical storm (JMA) |
| Tropical Storm (SSHWS) |
|
|
| Duration |
July 11 – July 17 |
| Peak intensity |
100 km/h (65 mph) (1-min) 985 hPa (mbar) |
Tropical Storm Sally
| Tropical Storm (JMA) |
| Tropical Storm (SSHWS) |
|
|
| Duration |
July 19 – July 23 |
| Peak intensity |
75 km/h (45 mph) (1-min) 992 hPa (mbar) |
Tropical Storm Therese
| Tropical Storm (JMA) |
| Tropical Storm (SSHWS) |
|
|
| Duration |
August 1 – August 4 |
| Peak intensity |
75 km/h (45 mph) (1-min) 990 hPa (mbar) |
Tropical Storm Violet (Heling)
| Tropical Storm (JMA) |
| Tropical Storm (SSHWS) |
|
|
| Duration |
August 3 – August 9 |
| Peak intensity |
75 km/h (45 mph) (1-min) 992 hPa (mbar) |
Typhoon Wilda (Iliang)
| Typhoon (JMA) |
| Category 3 typhoon (SSHWS) |
|
|
| Duration |
August 9 – August 15 |
| Peak intensity |
195 km/h (120 mph) (1-min) 940 hPa (mbar) |
A broad surface trough developed into Tropical Storm Wilda on August 9. After drifting to the west-southwest, it turned to the north, where it reached a peak of 120 mph winds on the 12th near Okinawa. Wilda continued northward, and weakened slightly to a 105 mph typhoon before making landfall on western Kyūshū on the 14th. Wilda accelerated to the northeast, and became extratropical on the 15th. The typhoon caused heavy rain, killing 11 people.
Typhoon Anita
| Typhoon (JMA) |
| Category 4 typhoon (SSHWS) |
|
|
| Duration |
August 15 – August 22 |
| Peak intensity |
250 km/h (155 mph) (1-min) 910 hPa (mbar) |
An upper level low contributed to the formation of Tropical Depression 11W on August 16 over the northern Marianas Islands. It quickly intensified, reaching typhoon status that night. Anita's intensification rate slowed initially, but as it continued northwestward late on the 18th and 19th, Anita rapidly strengthened to a 155 mph super typhoon. It weakened as it accelerated to the north-northwest, and hit western Shikoku in Japan on the 21st as a 115 mph typhoon. Anita, which became extratropical on the 22nd, caused 23 deaths and sank 31 vessels.
Typhoon Billie (Loleng)
| Typhoon (JMA) |
| Category 3 typhoon (SSHWS) |
|
|
| Duration |
August 21 – August 31 |
| Peak intensity |
205 km/h (125 mph) (1-min) 945 hPa (mbar) |
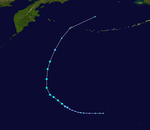
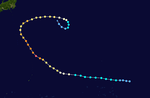
Typhoon Clara
| Typhoon (JMA) |
| Category 2 typhoon (SSHWS) |
|
|
| Duration |
August 25 – September 4 |
| Peak intensity |
155 km/h (100 mph) (1-min) 960 hPa (mbar) |
Tropical Storm Clara developed on August 26 southeast of Japan from an upper tropospheric circulation that separated from the Mid-Pacific trough. It quickly strengthened, and became a typhoon on the 27th at 31.9º North, one of only 16 Western Pacific typhoons to reach that strength north of 30ºN. Clara peaked at 95 mph before coming close to Japan, when a shortwave trough forced it sharply eastward. The storm maintained its intensity until becoming extratropical on September 3. An interesting fact about Clara was a reconnaissance mission flown into Hurricane Dot in the central Pacific also flew into Clara on the same flight, an unusual accomplishment not normally seen.
Tropical Storm Ellen (Norming)
| Tropical Storm (JMA) |
| Tropical Storm (SSHWS) |
|
|
| Duration |
September 3 – September 6 |
| Peak intensity |
85 km/h (50 mph) (1-min) 985 hPa (mbar) |
Severe Tropical Storm Fran (Oyang)
| Severe tropical storm (JMA) |
| Tropical Storm (SSHWS) |
|
|
| Duration |
September 3 – September 10 |
| Peak intensity |
100 km/h (65 mph) (1-min) 975 hPa (mbar) |
Typhoon Georgia (Pitang)
| Typhoon (JMA) |
| Category 5 super typhoon (SSHWS) |
|
|
| Duration |
September 7 – September 16 |
| Peak intensity |
260 km/h (160 mph) (1-min) 905 hPa (mbar) |
On September 11, Super Typhoon Georgia, which formed on the 8th, struck northern Luzon with winds of 160 mph. It weakened over the island, turned to the northwest, and hit southern China as a strong tropical storm on the 13th. Georgia produced little rain over the Philippines, but its strong winds caused 95 casualties (with 80 missing) and damage at $1.4 million (1970 USD).
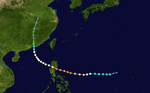
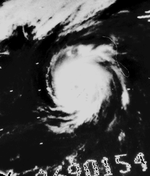
Typhoon Hope
| Typhoon (JMA) |
| Category 5 super typhoon (SSHWS) |
|
|
| Duration |
September 19 – September 30 |
| Peak intensity |
280 km/h (175 mph) (1-min) 895 hPa (mbar) |
Tropical Depression Ruping
| Tropical depression (PAGASA) |
|
|
| Duration |
September 21 – September 25 |
| Peak intensity |
55 km/h (35 mph) (10-min) |
Typhoon Iris
| Typhoon (JMA) |
| Category 3 typhoon (SSHWS) |
|
|
| Duration |
October 2 – October 8 |
| Peak intensity |
185 km/h (115 mph) (1-min) 960 hPa (mbar) |
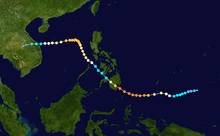
Typhoon Joan (Sening)
| Typhoon (JMA) |
| Category 5 super typhoon (SSHWS) |
|
|
| Duration |
October 9 – October 18 |
| Peak intensity |
280 km/h (175 mph) (1-min) 905 hPa (mbar) |
A tropical disturbance organized into Tropical Storm Joan on October 10, east of the Philippines. Conditions favored strengthening, and Joan reached typhoon status on the 11th. From late on the 11th to early on the 13th, Typhoon Joan rapidly intensified to a 175 mph Super Typhoon. It struck the southeastern Luzon at that intensity on the 13th, and crossed the archipelago. After weakening to a minimal typhoon, Joan turned to the northwest, where it reintensified to a 115 mph typhoon. It made landfall on eastern Hainan Island on the 16th, and dissipated on the 18th over China. Joan left 768 people dead (with 193 missing), and caused $74 million in damage (1970 USD), mostly from agricultural losses.
Typhoon Kate (Titang)
| Typhoon (JMA) |
| Category 4 typhoon (SSHWS) |
|
|
| Duration |
October 14 – October 26 |
| Peak intensity |
240 km/h (150 mph) (1-min) 940 hPa (mbar) |
Tropical Storm Kate developed just behind Typhoon Joan, east of the southern Philippines on October 14. It tracked westward as a small cyclone, and strengthened into a typhoon on the 15th. It made landfall twice, once in the Philippines and once in Vietnam, resulting in at least 631 fatalities (with 284 missing) and $50 million in damage.
Typhoon Louise
| Typhoon (JMA) |
| Tropical Storm (SSHWS) |
|
|
| Duration |
October 23 – October 29 |
| Peak intensity |
110 km/h (70 mph) (1-min) 990 hPa (mbar) |
Severe Tropical Storm Marge (Uding)
| Severe tropical storm (JMA) |
| Tropical Storm (SSHWS) |
|
|
| Duration |
October 27 – November 8 |
| Peak intensity |
100 km/h (65 mph) (1-min) 990 hPa (mbar) |
Tropical Storm Nora
| Tropical Storm (JMA) |
| Tropical Storm (SSHWS) |
|
|
| Duration |
November 1 – November 4 |
| Peak intensity |
95 km/h (60 mph) (1-min) 1000 hPa (mbar) |
The remnants of Tropical Storm Nora helped in the formation of the 1970 Bhola cyclone which devastated Bangladesh.
Severe Tropical Storm Opal
| Severe tropical storm (JMA) |
| Tropical Storm (SSHWS) |
|
|
| Duration |
November 11 – November 17 |
| Peak intensity |
95 km/h (60 mph) (1-min) 990 hPa (mbar) |
Typhoon Patsy (Yoling)
| Typhoon (JMA) |
| Category 4 typhoon (SSHWS) |
|
|
| Duration |
November 14 – November 22 |
| Peak intensity |
250 km/h (155 mph) (1-min) 910 hPa (mbar) |
A tropical disturbance organized into Tropical Depression 27W on November 14 near the Marianas Islands. A strong ridge to its north forced it westward, where it strengthened to tropical storm status later on the 14th. Patsy steadily intensified, reaching typhoon strength on the 16th and peaking at 155 mph on the 18th. Its inflow became disrupted by the Philippines to its west, and Patsy hit Luzon on the 19th with winds of 130 mph, making it the 3rd strong typhoon since September to strike the island. After crossing the island, Patsy traversed the South China Sea, where cooler waters kept the system a tropical storm. On November 22, Patsy struck Vietnam, and dissipated soon after. Typhoon Patsy was one of the deadliest typhoons to strike the Philippines in its history. 611 people were killed (with 351 missing) on the island, and 135 people were killed at sea due to shipping failures. Because the Vietnam War was raging at that time, its difficult to say about the damage or death toll, but estimates say that 30 people died in Vietnam.
Tropical Depression Aning
| Tropical depression (PAGASA) |
|
|
| Duration |
November 24 – November 25 |
| Peak intensity |
55 km/h (35 mph) (10-min) |
Tropical Storm Ruth
| Tropical Storm (JMA) |
| Tropical Storm (SSHWS) |
|
|
| Duration |
November 26 – November 29 |
| Peak intensity |
75 km/h (45 mph) (1-min) 996 hPa (mbar) |
Tropical Depression Bidang
| Tropical depression (PAGASA) |
|
|
| Duration |
December 17 – December 17 |
| Peak intensity |
55 km/h (35 mph) (10-min) |
Other storms
According to the Japan Meteorological Agency, on September 2 Tropical Cyclone Dot briefly crossed the International Date Line from the central Pacific into its area of responsibility, crossing back later that day.[8]
1970 storm names
Western North Pacific tropical cyclones were named by the Joint Typhoon Warning Center. The first storm of 1970 was named Nancy and the final one was named Ruth.
-
Agnes
-
Bonnie
-
Carmen
-
Della
-
Elaine
-
Faye
-
Gloria
-
Hester
-
Irma
-
Judy
-
Kit
-
Lola
-
Mamie
-
Nina
-
Ora
-
Phyllis
-
Rita
-
Susan
-
Tess
-
Viola
-
Winnie
|
-
Alice
-
Betty
-
Cora
-
Doris
-
Elsie
-
Flossie
-
Grace
-
Helen
-
Ida
-
June
-
Kathy
-
Lorna
-
Marie
- Nancy 1W
- Olga 2W
- Pamela 3W
- Ruby 4W
- Sally 5W
- Therese 8W
- Violet 9W
- Wilda 10W
|
- Anita 11W
- Billie 12W
- Clara 13W
- Dot 14C
- Ellen 15W
- Fran 16W
- Georgia 17W
- Hope 18W
- Iris 19W
- Joan 21W
- Kate 22W
- Louise 23W
- Marge 24W
- Nora 25W
- Opal 26W
- Patsy 27W
- Ruth 28W
-
Sarah
-
Thelma
-
Vera
-
Wanda
|
-
Amy
-
Babe
-
Carla
-
Dinah
-
Emma
-
Freda
-
Gilda
-
Harriet
-
Ivy
-
Jean
-
Kim
-
Lucy
-
Mary
-
Nadine
-
Olive
-
Polly
-
Rose
-
Shirley
-
Trix
-
Virginia
-
Wendy
|
One Central Pacific System developed, Hurricane Dot. The policy at that time was to use Western Pacific Names for the Central Pacific.
Season effects
This is a table of all of the storms that have formed in the 1970 Pacific typhoon season. It includes their duration, names, landfall(s), denoted in parenthesis, damages, and death totals. Deaths in parentheses are additional and indirect, but were still related to that storm. Damage and deaths include totals while the storm was extratropical, a wave, or a low, and all of the damage figures are in 1970 USD.
References
External links