1992 Atlantic hurricane season
 | |
| Season summary map | |
| First system formed | April 21, 1992 |
|---|---|
| Last system dissipated | October 27, 1992 |
| Strongest storm1 | Andrew – 922 mbar (hPa) (27.23 inHg), 175 mph (280 km/h) |
| Total depressions | 10 |
| Total storms | 7 |
| Hurricanes | 4 |
| Major hurricanes (Cat. 3+) | 1 |
| Total fatalities | 73 |
| Total damage | $26.502 billion (1992 USD) |
| 1Strongest storm is determined by lowest pressure | |
1990, 1991, 1992, 1993, 1994 | |
| Related article | |
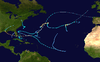
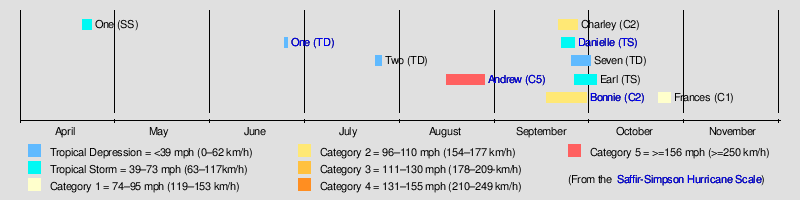
The 1992 Atlantic hurricane season had one of the latest dates on record for the first named storm. The season officially began on June 1, 1992, and lasted until November 30, 1992. The first storm, an unnamed subtropical storm, developed in the central Atlantic on April 21, over a month before the official start of hurricane season. The most significant storm of the season was Hurricane Andrew, which at the time was the costliest United States hurricane. After crossing the Bahamas, the hurricane made landfall in Florida and Louisiana. It caused $26 billion (1992 USD) in damage, mostly in Florida, and 65 fatalities. Andrew was also the strongest hurricane of the season, reaching winds of 175 mph (280 km/h) while approaching Florida.
Unusually, Hurricanes Bonnie and Charley produced tropical storm force winds in the Azores, and the former caused one fatality. Tropical Storm Danielle was one of few tropical cyclones known to make landfall on the Delmarva Peninsula. The storm caused minor damage and two fatalities in the Mid-Atlantic and New England regions of the United States. One other hurricane in the season –Frances – did not significantly affect land. The system developed in the central Atlantic, and tracked well away from land, and brought only light rainfall to Newfoundland. In addition to the 7 storms, there were three non-developing tropical depressions. The first depression of the season caused flooding in Cuba and Florida while the other two depressions did not affect any land. Collectively, the storms in the 1992 Atlantic hurricane season caused $26.502 billion in losses and 73 fatalities.
Season summary
Pre-season forecasts
| Source | Date | Named storms | Hurricanes | Major hurricanes | |
|---|---|---|---|---|---|
| 12.1 | 6.4 | 2.7 | [1] | ||
| 28 | 15 | 8 | |||
| 4 | 2 | 0 | |||
| ––––––––––––––––––––––––––––––––––––––––––––––––––––––– | |||||
| CSU | December 1991 | 8 | 4 | 1 | [2] |
| WRC | Early 1992 | 6 | 3 | N/A | [3] |
| CSU | April 1992 | 8 | 4 | 1 | [4] |
| CSU | June 1992 | 8 | 4 | 1 | [4] |
| CSU | August 1992 | 8 | 4 | 1 | [5] |
| ––––––––––––––––––––––––––––––––––––––––––––––––––––––– | |||||
| Actual activity | 7 | 4 | 1 | ||
Forecasts of hurricane activity are issued before each hurricane season by Dr. William M. Gray and his associates at Colorado State University (CSU) and the Weather Research Center (WRC). A normal season as defined by the National Oceanic and Atmospheric Administration (NOAA) has 12.1 named storms, of which 6.4 reach hurricane strength, and 2.7 become major hurricanes.[1] In December 1991, CSU issued its first forecast for the year and predicted that 1992 would see eight named storms, four hurricanes, and one major hurricane.[2] CSU also issued a forecast in April, June and August, however no revisions were made to the numbers of named storms, hurricanes, and major hurricane predicted in 1992.[4][5] Prior to the season starting, the WRC predicted that the season would see six named storms, with three of those becoming a hurricane while no forecast was made on the numbers of major hurricanes.[3]
Season activity
The Atlantic hurricane season officially began on June 1,[6] but activity in 1992 began more than a month earlier with the formation of Subtropical Storm One on April 21. It was a below average season in which 10 tropical depressions formed. Seven of the depressions attained tropical storm status, and four of these attained hurricane status. In addition, one tropical cyclone eventually attained major hurricane status,[7] which is below the 1981–2010 average of 2.7 per season.[1] The low amount of activity is partially attributed to weaker than normal tropical waves, the source for most North Atlantic tropical cyclones.[8] Only two hurricanes and one tropical storm made landfall during the season. However, damage from Hurricane Andrew was astronomical, causing most of the season's 106 deaths and $26.5 billion (1992 USD) damage toll.[7][9][10][11][12][13] The last storm of the season, Hurricane Frances, became extratropical on October 27, over a month before the official end of the season on November 30.[7]
Tropical cyclogenesis in the 1992 Atlantic hurricane season began with the development of Subtropical Storm One on April 21. However, over the next three months, minimal activity occurred, with only two depressions developing, one in June and the other in July.[7] Although wind shear was relatively weak in August,[8] only one tropical cyclone occurred in that month. However, that one tropical cyclone, Hurricane Andrew, was the strongest and costliest of the season.[7] Though September is the climatological peak of hurricane season,[14] an increase in wind shear prevented tropical cyclogenesis in the first half of the month. After September 16, however, five tropical cyclones developed in a span of nine days, from September 17 to 26. Thereafter, activity abruptly halted, and only one tropical cyclone developed in October, Hurricane Frances. By October 27, Frances became extratropical,[7] which was more than a month before the official end of the season on November 30.[15]
The season's activity was reflected with an accumulated cyclone energy (ACE) rating of 76.[16] ACE is, broadly speaking, a measure of the power of the hurricane multiplied by the length of time it existed, so storms that last a long time, as well as particularly strong hurricanes, have high ACEs. ACE is only calculated for full advisories on tropical systems at or exceeding 34 knots (39 mph, 63 km/h) or tropical storm strength. Although officially, subtropical cyclones, such as the first storm, are excluded from the total,[17] the figure above includes periods when storms were in a subtropical phase.
Storms
Subtropical Storm One
| Subtropical storm (SSHWS) | |||
|---|---|---|---|
| |||
| Duration | April 21 – April 24 | ||
| Peak intensity | 50 mph (85 km/h) (1-min) 1002 mbar (hPa) | ||


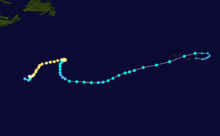
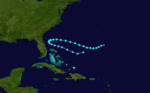
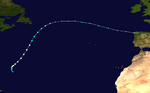
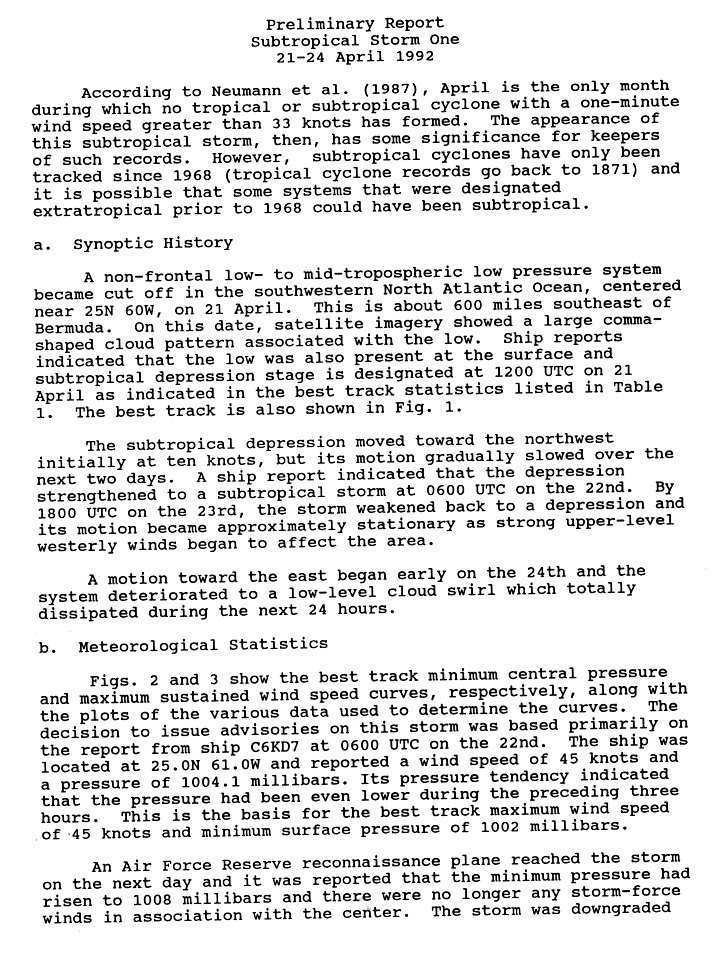
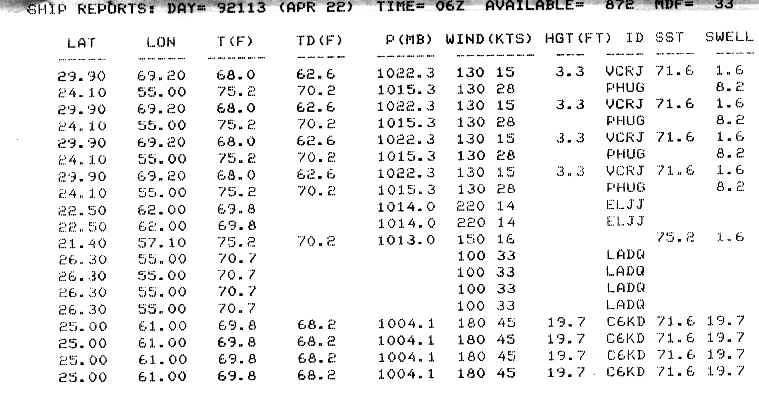
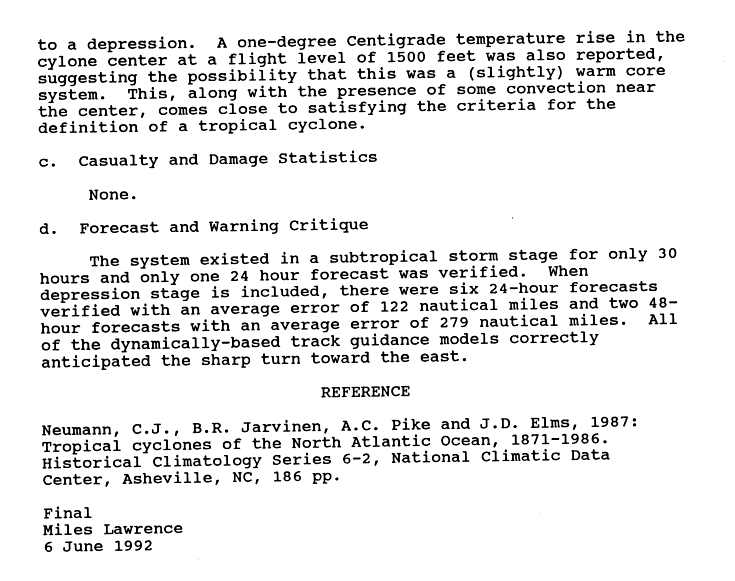
On April 21, a low pressure area separated from the prevailing westerlies about 600 miles (1,100 km) southeast of Bermuda, and developed into a subtropical depression at 1200 UTC. The system maintained a large comma-shaped cloud pattern around the low-level circulation.[18] Operationally it was not classified until 27 hours later.[19] Isolated from strong steering currents, the depression tracked northwestward at 12 mph (19 km/h), and intensified into a subtropical storm early on April 22; this was the first such storm on record in the month.[18] It gradually became better organized, with a large convective band in the eastern semicircle. Reports from a nearby ship indicated peak winds of 50 mph (85 km/h),[19] with swells of 64.4 feet (19.7 m).[20]
The National Hurricane Center remarked the potential for the system transitioning into a tropical cyclone.[19] An approaching trough caused the storm to stall and weaken the deep convection.[21] On April 23, the cyclone weakened to depression status due to strong wind shear.[18] A Hurricane Hunters flight into the system confirmed the weakening, and also reported a 1.8 °F (1 °C) temperature rise in the center, suggesting a warm core and some tropical characteristics.[22] Early on April 24, the subtropical depression turned eastward, maintaining limited convection. At the time, forecasters anticipated the depression would continue east-northeastward and become an extratropical cyclone.[23] By late on April 24, the system was too weak to classify using the Dvorak technique, and the NHC ceased issuing advisories.[24] Within 24 hours, the circulation dissipated as the system continued eastward through the westerlies.[18]
Tropical Depression One
| Tropical depression (SSHWS) | |||
|---|---|---|---|
| |||
| Duration | June 25 – June 26 | ||
| Peak intensity | 35 mph (55 km/h) (1-min) 1007 mbar (hPa) | ||


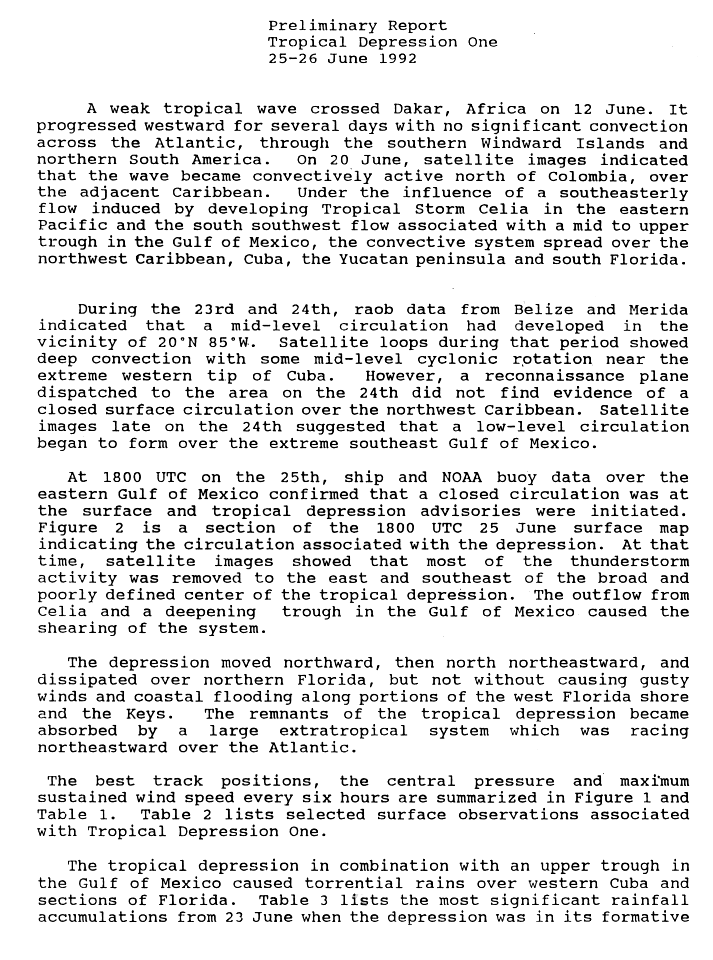
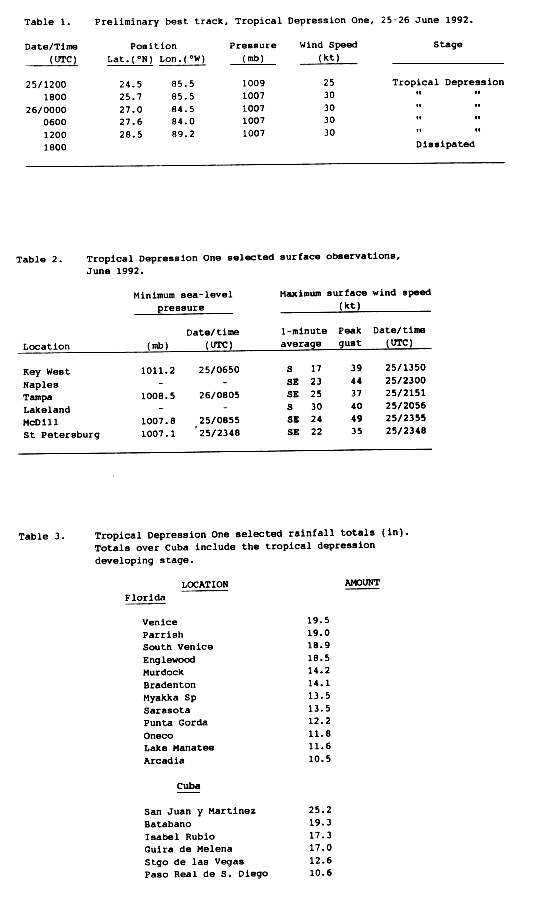
A tropical wave emerged off the western coast of Africa on June 12, and eventually developed into Tropical Depression One in the southeastern Gulf of Mexico.[25] Operationally, the National Hurricane Center designated this system as Tropical Depression Two, which led to confusion because of Subtropical Storm One in April, and then another Tropical Depression Two in July.[26] Outflow from Hurricane Celia in the Pacific Ocean and a trough in the Gulf of Mexico generated wind shear on the depression, which prevented it from intensifying into a tropical storm.[25] The depression curved north-northeastward and eventually made landfall in near Tampa, Florida on June 26 around 1500 UTC. As it was moving ashore, the National Hurricane Center noted that the depression was too poorly organized to locate the center of circulation, and discontinued advisories on the system.[27]
The depression dropped heavy rainfall in Cuba, peaking at 33.43 inches (849 mm).[28] Large amounts of precipitation resulted in flooding, which damaged or destroyed hundreds of homes and caused two fatalities in provinces of Pinar del Río and La Habana.[11] As the system was only a tropical depression, light winds were reported, however, a peak gust of 56 mph (90 km/h) was reported at MacDill Air Force Base.[29] Heavy rainfall fell on the west coast of Florida, with local amounts exceeded 20 inches (510 mm). Precipitation throughout the state peaked at 25 inches (640 mm) in Arcadia Tower.[30] Heavy rainfall caused flooding in portions of Florida, which in turn, damaged 4,000 houses[10] and destroyed 70 houses.[9] In addition, five homes destroyed and twelve were damage by a tornado spawned in Nokomis.[10] Severe crop damage to orange trees was also reported.[31] The depression caused two fatalities in Florida and damage totaled to $2.6 million (1992 USD).[9][10]
Tropical Depression Two
| Tropical depression (SSHWS) | |||
|---|---|---|---|
| |||
| Duration | July 24 – July 26 | ||
| Peak intensity | 35 mph (55 km/h) (1-min) 1015 mbar (hPa) | ||


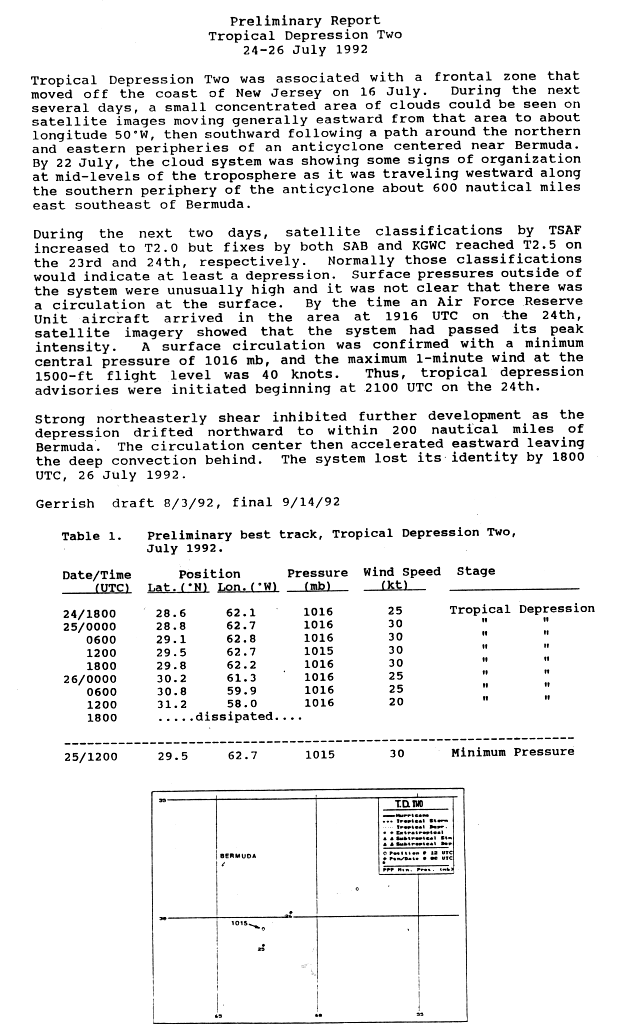
A squall line which moved offshore New York and southern New England formed a mesoscale convective vortex, which fired new thunderstorm activity each day as it moved within the westerlies across the northern Atlantic. Once it reached mid-ocean, an increasingly northerly steering flow dropped the system down into the subtropics to the east of Bermuda, and it maintained decent organization.[32] By 2100 UTC on July 24, the National Hurricane Center began classifying the system as Tropical Depression Two. In the first advisory on the depression, it was noted that the previous tropical depression was erroneously classified as Tropical Depression Two.[33]
Due to northeasterly wind shear, the depression failed to intensified or organize further, as predicted.[34] Instead, the depression weakened by late on July 25, with satellite imagery indicating that much of the deep convection was removed from the surface circulation.[35] By July 26, the National Hurricane Center issued its final advisory, noting that it was "too weak to classify and is rapidly losing its identity".[36] The depression dissipated about three hours later.[32]
Hurricane Andrew
| Category 5 hurricane (SSHWS) | |||
|---|---|---|---|
| |||
| Duration | August 16 – August 28 | ||
| Peak intensity | 175 mph (280 km/h) (1-min) 922 mbar (hPa) | ||

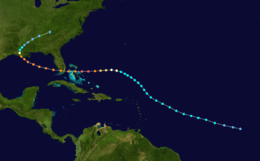
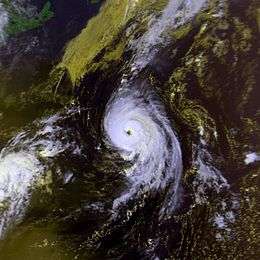
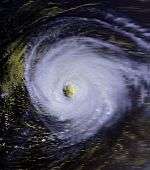
A tropical wave moved off the coast of Africa on August 14, and organized into Tropical Depression Three on August 16 while located about halfway between the Windward Islands and the coast of Africa. It moved to the west-northwest, and strengthened into Tropical Storm Andrew on August 17. After reaching winds of 50 mph (85 km/h), strong southwesterly shear weakened the storm, and by August 20 it weakened to a minimal storm with a pressure of 1,015 mbar (30.0 inHg). It bypassed the Lesser Antilles completely, and turned to the west in response to a building high pressure system to the north. Upon turning to the west, a trough of low pressure positioned to the southwest of Andrew created an environment with little vertical shear and well-defined outflow. The storm quickly intensified due to its small size, and became a hurricane on August 22. Andrew rapidly intensified under ideal conditions for development,[12] and on August 23 the hurricane peaked with winds of 175 mph (280 km/h). It crossed the Bahamas at that intensity, weakened slightly, and re-intensified to a 165 mph (270 km/h) Category 5 hurricane before making landfall near Homestead, Florida. It weakened slightly over the state to a 135 mph (215 km/h) hurricane, but restrengthened to a 145 mph (235 km/h) hurricane over the Gulf of Mexico. A strong mid-latitude trough turned Andrew northward, where it greatly weakened before hitting west of Morgan City, Louisiana on August 26 as a 115 mph (185 km/h) Category 3 hurricane. It turned northeastward, and dissipated over Tennessee on August 28.[37]
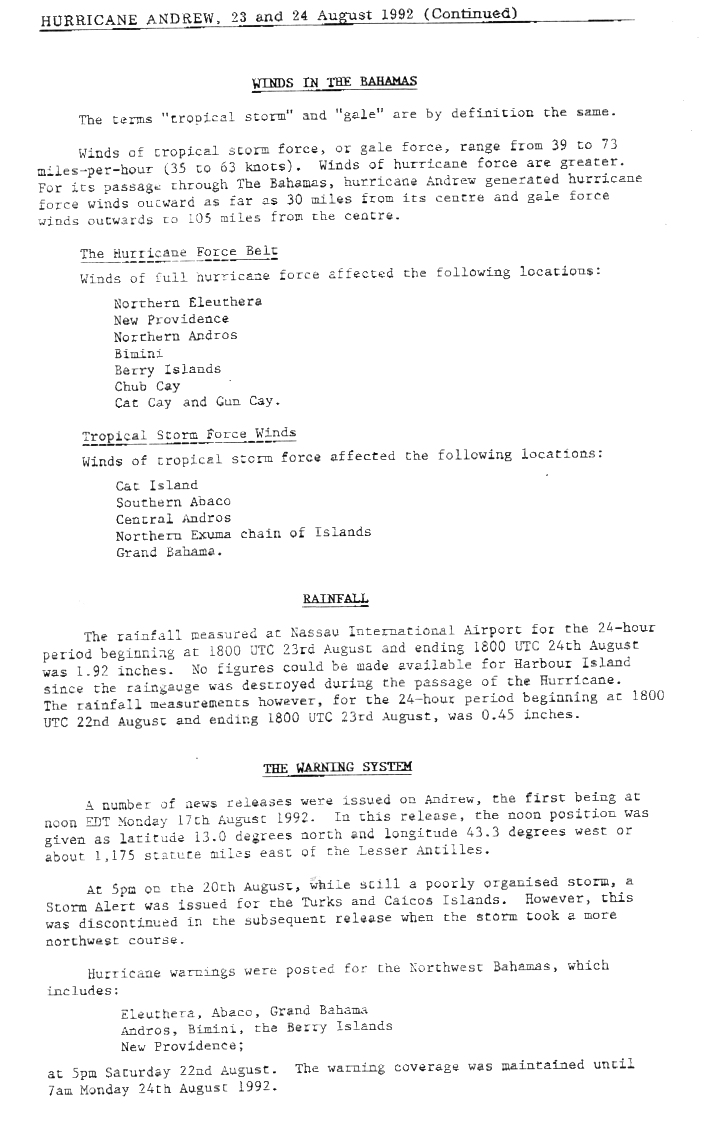
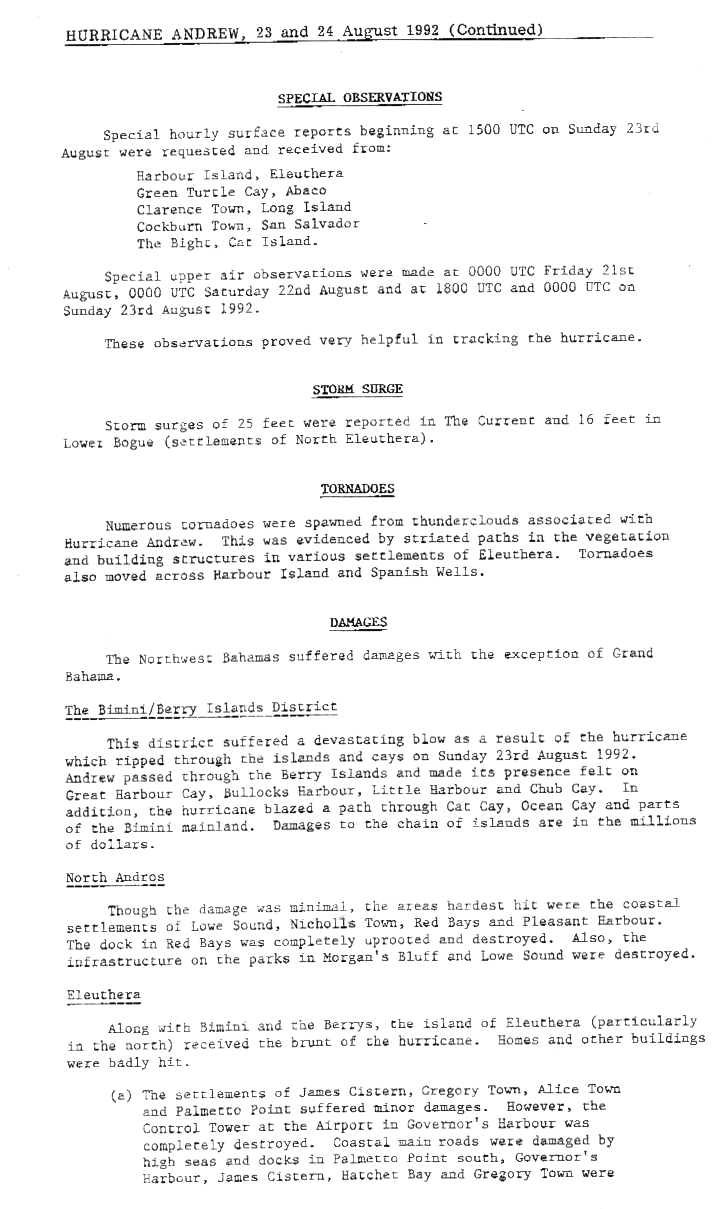
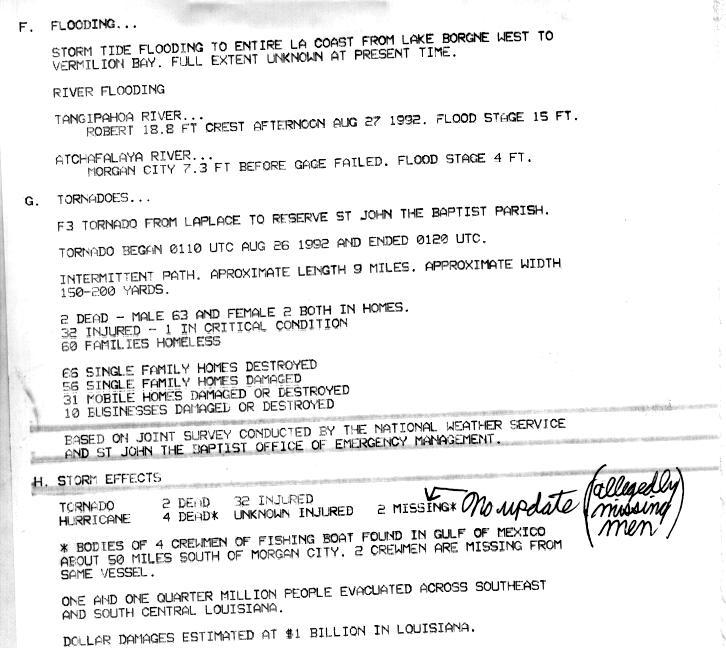
In the Bahamas, Andrew brought high tides, hurricane-force winds,[38] and tornadoes,[39] which caused significant damage in the archipelago, especially on Cat Cays.[40] At least 800 houses were destroyed and left damage to the transport, communications, water, sanitation, agriculture, and fishing sectors.[41] Overall, Andrew caused four fatalities and $250 million in damage in the Bahamas. Throughout the southern portions of Florida, Andrew brought very high winds; a wind gust of 177 mph (282 km/h) was reported at a house in Perrine, Florida.[12] High winds caused catastrophic damage in Florida, especially in Miami-Dade County, where approximately 117,000 houses were either severely damaged or destroyed.[42] In the Everglades, 70,000 acres (280 km2) of trees were knocked down and about 182 million fish were killed.[43] Rainfall in Florida was moderate, peaking at 13.98 inches (355 mm) in western Miami-Dade County.[44] Significant damage to oil platforms was reported, with one company losing 13 platforms, had 104 structures damaged, and five drilling wells blown off course. In Louisiana, Andrew produced hurricane-force winds along its path,[12] damaging 23,000 homes and destroying 985 homes and 1,951 mobile homes.[45] An F3 tornado in St. John the Baptist Parish damaged or destroyed 163 structures.[46] 17 fatalities were reported in Louisiana, six of which were drowning victims offshore.[12] Elsewhere, the storm spawned at least 28 tornadoes, especially in Alabama, Georgia, and Mississippi.[12][47] Overall, Andrew caused 65 fatalities and $26 billion (1992 USD) in damage,[12] making it the fourth costliest hurricane in U.S. history, behind Hurricane Katrina in 2005, Hurricane Sandy in 2012, and Hurricane Ike in 2008.[48]
Hurricane Bonnie
| Category 2 hurricane (SSHWS) | |||
|---|---|---|---|
| |||
| Duration | September 17 – September 30 | ||
| Peak intensity | 110 mph (175 km/h) (1-min) 965 mbar (hPa) | ||
In mid-September, a tropical low detached from a cold front and developed into Tropical Depression Four late on September 17, while located about 340 miles (550 km) east-northeast of Bermuda. Early on the following day, the depression intensified into Tropical Storm Bonnie. Due to light vertical wind shear, Bonnie quickly strengthened, and became a hurricane late on September 18. Further deepening occurred, and at 1800 UTC on September 21, Bonnie peaked as a 110 mph (175 km/h) Category 2 hurricane. Thereafter, Bonnie became nearly stationary for almost 24 hours. Satellite images indicated that the low-level center became exposed, indicating that Bonnie was significantly weakening while tracking southward. It is estimated that Bonnie weakened to a tropical storm by late on September 24. Bonnie further deteriorated to tropical depression status on September 26, but re-strengthened to a tropical storm later that day.[49]
By 1500 UTC on September 27, the National Hurricane Center declared Bonnie extratropical, since it was losing tropical characteristics.[50] Bonnie re-acquired tropical characteristics, and the National Hurricane Center resumed advisories on the storm by 2100 UTC on September 28.[51] However, post-analysis indicated that Bonnie remained tropical during that time period. Bonnie re-strengthened to a strong tropical storm before vertical wind shear weakened it while approaching the Azores. Shortly before becoming extratropical on September 30, Bonnie passed through the Azores as a moderately weak tropical storm.[49] One location in the Azores reported tropical storm force winds.[52] In addition, one man was killed by a rock fall on the island of São Miguel.[7] No damage was reported in association with Bonnie.[52]
Hurricane Charley
| Category 2 hurricane (SSHWS) | |||
|---|---|---|---|
| |||
| Duration | September 21 – September 27 | ||
| Peak intensity | 110 mph (175 km/h) (1-min) 965 mbar (hPa) | ||
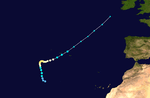
On September 20, METEOSAT imagery indicated an area of convection becoming concentrated while well south of the Azores. It is possible that a mid to upper-level cyclonic circulation interacted with the northern portion of a tropical wave. By the following day, satellite imagery noted a well-defined low-level circulation and thus, Tropical Depression Five while centered about 633 miles (1,019 km) south of the Azores. The depression tracked northwestward and satellite imagery began to indicate banding features. As a result, the depression was upgraded to Tropical Storm Charley on September 22. An eye developed as Charley tracked north-northwestward, and it became a hurricane on September 23. Further strengthening occurred, and by late on September 24, Charley peaked as a 110 mph (175 km/h) Category 2 hurricane.[53]
Thereafter, Charley turned eastward and then east-northeastward while tracking over decreasing sea surface temperatures (SST's). Early on September 27, Charley was downgraded to a tropical storm. Later that day, Charley crossed over Terceira Island in the Azores with winds of 65 mph (100 km/h). Charley gradually lost tropical characteristic, and by 1800 UTC on September 27, it had transitioned into an extratropical storm.[53] The remnant system accelerated northeastward toward the British Isles, where it merged with another extratropical low on September 29. While passing through the Azores, Charley produced tropical storm force winds, with the Lajes AFB reporting sustained winds of 53 mph (85 km/h) and gusts reaching 82 mph (132 km/h). No other effects from Charley were reported in the Azores.[54]
Tropical Storm Danielle
| Tropical storm (SSHWS) | |||
|---|---|---|---|
| |||
| Duration | September 22 – September 26 | ||
| Peak intensity | 65 mph (100 km/h) (1-min) 1001 mbar (hPa) | ||

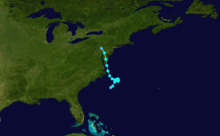
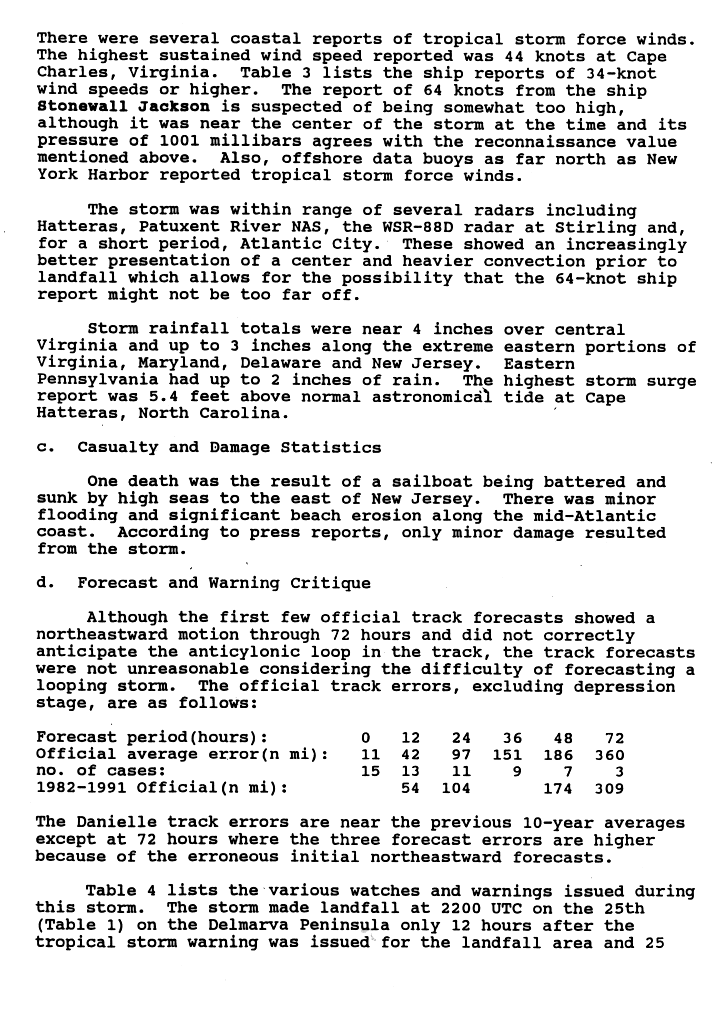
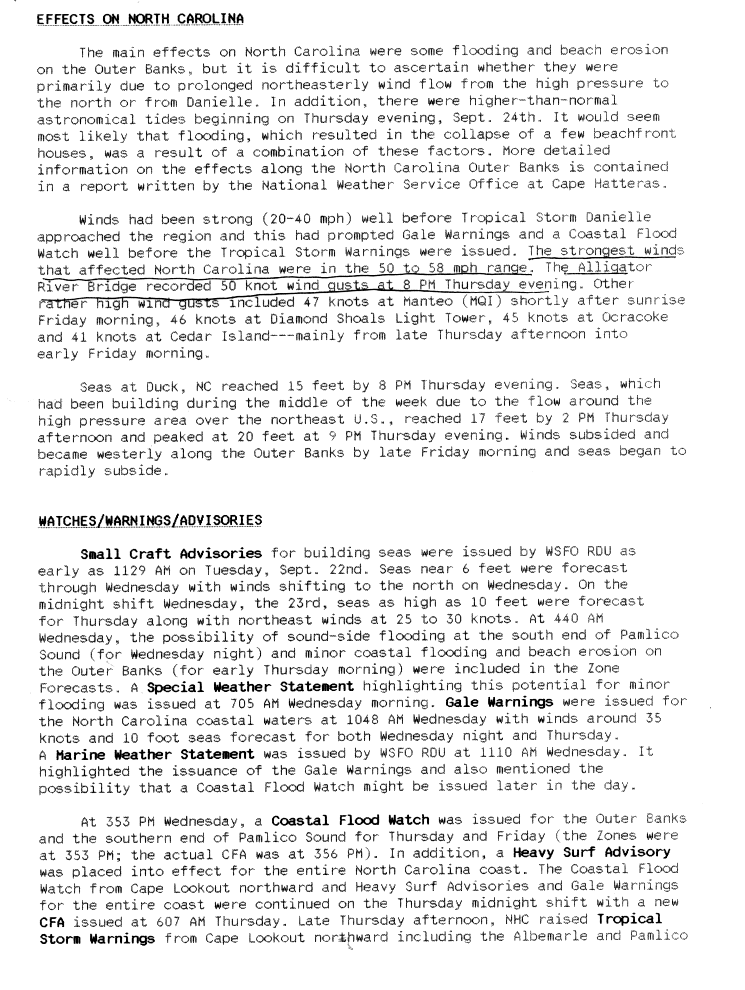
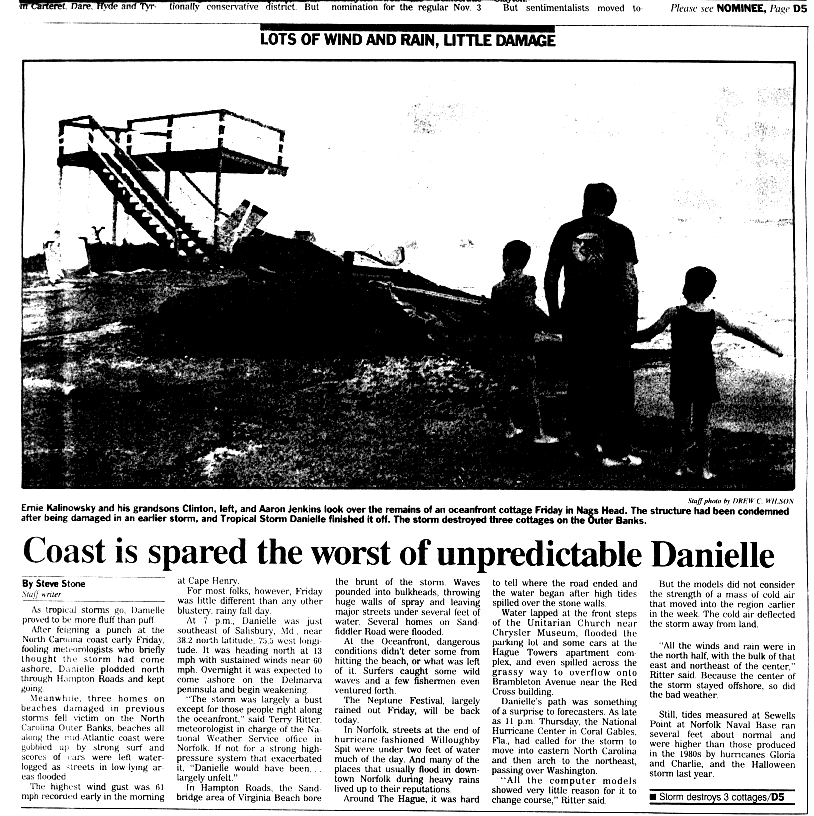
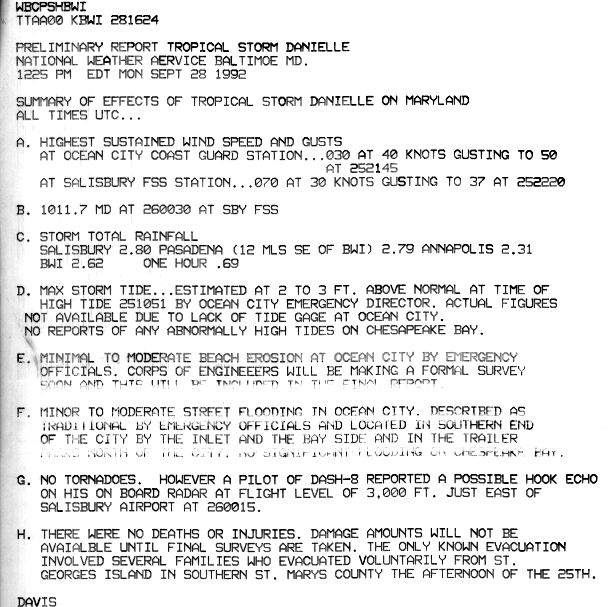
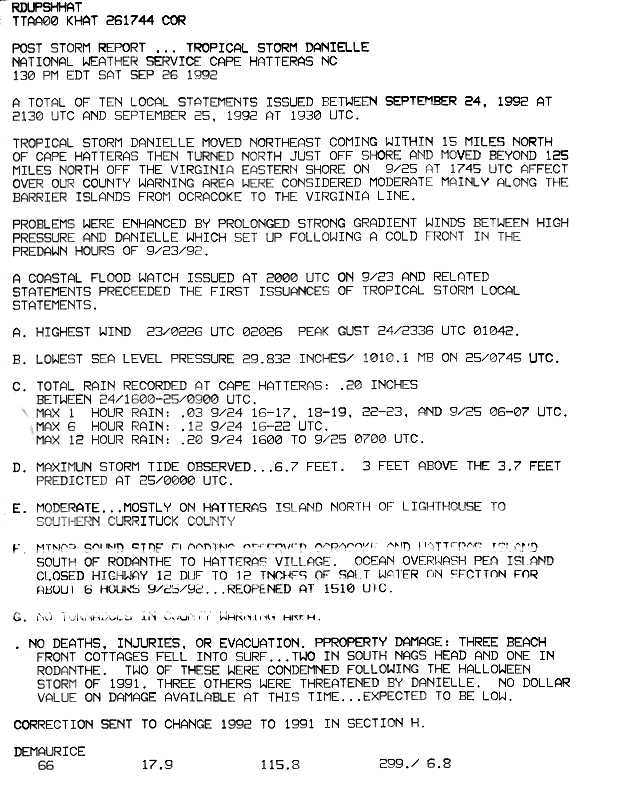
Tropical Depression Six developed offshore of the Southeastern United States on September 22 from the merger of a surface trough, a tropical wave, and a cold front. The depression quickly intensified and was upgraded to Tropical Storm Danielle six hours later. An approaching trough caused a northeastward movement, but later a high pressure system forced the storm to northwestward, which caused Danielle to execute a small anti-cyclonic loop on September 23–24. While offshore of North Carolina on September 25, Danielle reached its peak intensity as a moderately strong tropical storm with maximum sustained winds of 65 mph (100 km/h).[55] It was initially predicted that Danielle would make landfall in North Carolina,[56] however, the storm curved north-northwestward and made landfall in Maryland on the eastern shore of the Delmarva Peninsula at the same intensity. Danielle continued inland and weakened and dissipated over eastern Pennsylvania on September 26.[55]
Danielle caused severe beach erosion in North Carolina,[57] Virginia,[58] and Maryland,[59] which resulted in overwash, which in turn, damage or destroyed several businesses and houses in the coastal portions of the three states. In addition, street flooding also closed several roads in the region,[58][59][60] most notably, North Carolina Highway 12.[60] Many states in the Mid-Atlantic and New England also reported rainfall, although rarely exceeding 3 inches (76 mm).[61] In addition high seas offshore of New Jersey capsized a sailboat, causing two people to drown.[13] Overall, damage from the storm was minimal, with the exception of the damage or destroyed businesses and houses in North Carolina, Virginia, and Maryland.[58][59][60]
Tropical Depression Seven
| Tropical depression (SSHWS) | |||
|---|---|---|---|
| |||
| Duration | September 25 – October 1 | ||
| Peak intensity | 35 mph (55 km/h) (1-min) 1007 mbar (hPa) | ||


A poorly organized tropical wave emerged off the west coast of Africa on September 23 and quickly developed into Tropical Depression Seven on September 25, while centered 775 miles (1,247 km) southwest of Cape Verde.[62] Because the depression was tracking over warm SST's, it was predicted to intensify into a tropical storm.[63] However, wind shear exposed the center[62] as indicated by visible satellite images on September 26, and the National Hurricane Center noted on September 26 that "the depression could be downgraded to a tropical wave later today".[64] Early on September 27, the center of the depression became difficult to locate on satellite imagery.[65]
By September 28, the organization of the depression deteriorated further due to strong vertical wind shear.[66] The center of the depression again became difficult to location by infrared images early on September 29.[67] Later that day, a few computer models indicated a decrease in wind shear over the depression within two days, thus, it was predicted to strengthen into a tropical storm.[68] However, wind shear exposed the center of the depression again by early on September 30, though it was still forecast to intensify to tropical storm status.[69] By late on October 1, satellite imagery noted that the depression dissipated, and the National Hurricane Center issued its final advisory on the system.[62][70]
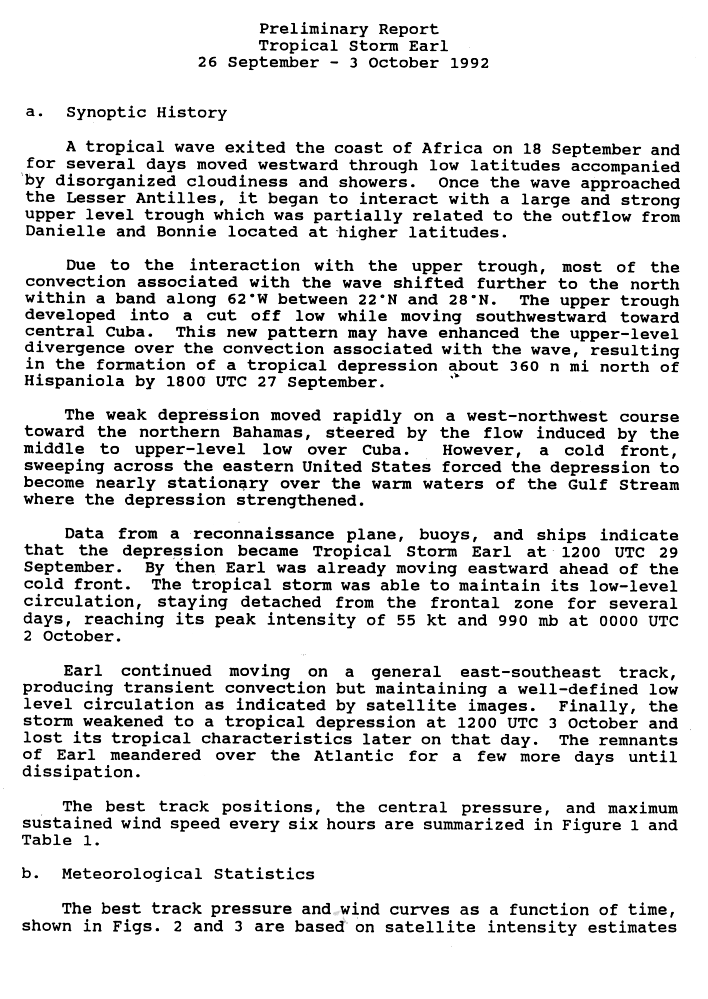
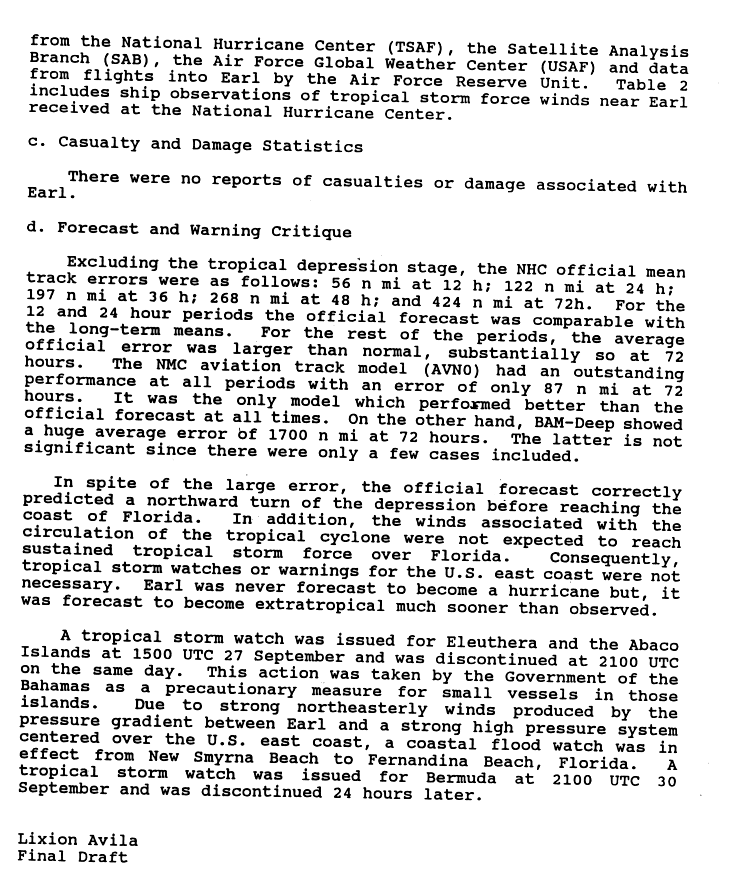
Tropical Storm Earl
| Tropical storm (SSHWS) | |||
|---|---|---|---|
| |||
| Duration | September 26 – October 3 | ||
| Peak intensity | 65 mph (100 km/h) (1-min) 990 mbar (hPa) | ||

On September 26, a tropical wave developed into Tropical Depression Eight while centered about 345 miles (555 km) north of Hispaniola. The depression tracked west-northwestward toward the Bahamas. Initially, the depression remained weak, but after reaching the Gulf Stream it strengthened into Tropical Storm Earl at 1200 UTC on September 29.[71] Around that time, Earl began to veer east, lessening the threat to Florida. Early on October 1, Earl reached maximum sustained winds of 65 mph (105 km/h) and a minimum barometric pressure of 990 mbar (29 inHg). It gradually weakened thereafter, and Earl was downgraded to a tropical depression on October 3.[72] Later that day, Earl became extratropical about 295 mi (475 km) south of Bermuda.[71]
The threat from Earl prompted a tropical storm watch in the Bahamas and later Bermuda, while a coastal flood watch was issued in Florida.[73] Because Earl remained offshore, impact was generally minor.[71] Throughout Florida, Earl spawned 11 tornadoes[74] and brought moderately heavy rainfall, peaking at 9.38 inches (238 mm) near Canal Point, Florida. In addition, light amounts of precipitation were also reported in Georgia and North Carolina.[75] Above normal tides washed away 30 to 35 ft (9.1 to 10.7 m) of beaches,[76] and lifeguards on St. Augustine Beach made eight rescues.[77]
Hurricane Frances
| Category 1 hurricane (SSHWS) | |||
|---|---|---|---|
| |||
| Duration | October 23 – October 27 | ||
| Peak intensity | 85 mph (140 km/h) (1-min) 976 mbar (hPa) | ||

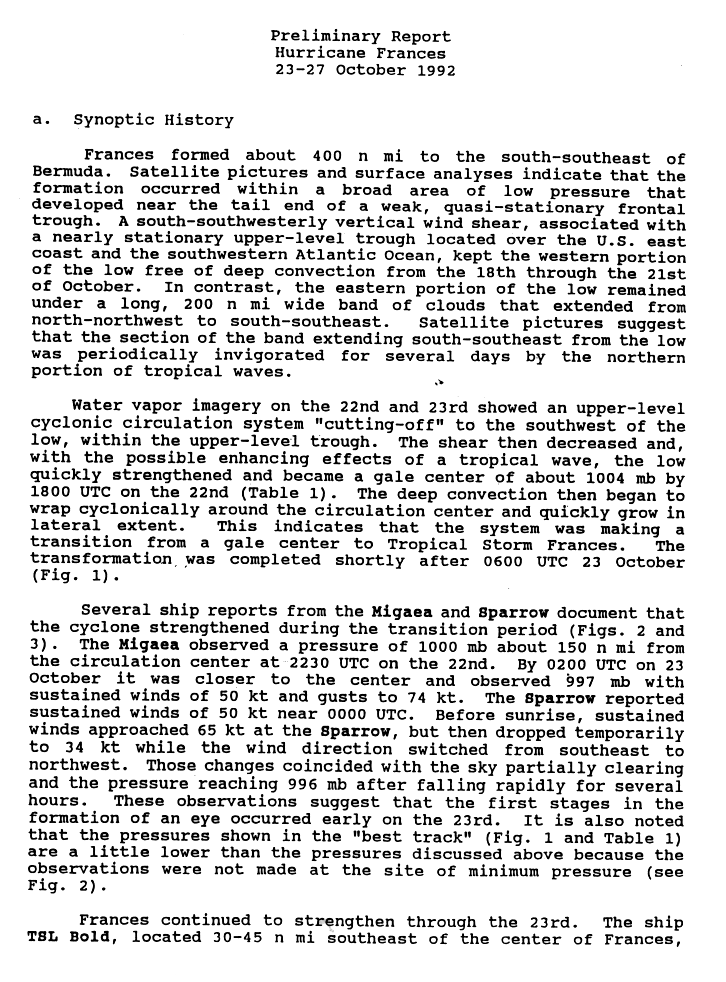
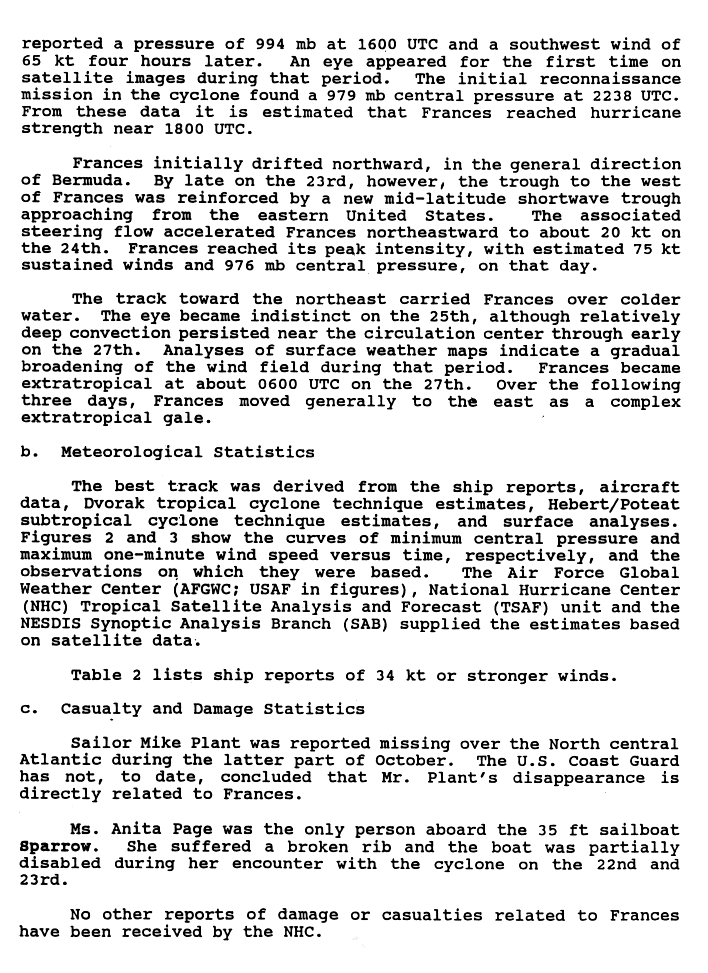
A low pressure area developed along the end of a quasi-stationary frontal trough. Initially, vertical wind shear prevented deep convection from forming on the western portion of the system. After wind shear decreased, the system became a gale center late on October 22. By early on the following day, the gale center had transitioned into a tropical storm, and it is estimated that Tropical Storm Frances developed at 0600 UTC on October 23. Frances quickly strengthened after becoming a tropical storm,[78] and was upgraded to a hurricane by 1800 UTC on that same day. After becoming a hurricane, Frances curved northeastward, and remained well east of Bermuda. By midday on October 24, Frances peaked as an 85 mph (140 km/h) Category 1 hurricane.[79]
After reaching peak intensity, Frances began tracking over cooler SST's, which gradually weakened the storm. The eye featured became indistinct and by late on October 25, Frances was downgraded to a tropical storm. Over the next two days, Frances began losing tropical characteristics, and was declared extratropical by early on October 27. One sailor was reported missing, however, it is unknown if it was as a result of Frances. In addition, one person on a sailboat suffered injuries during an encounter with Frances.[79] On land, Frances caused minimal impact, limited to light rainfall across Newfoundland.[80]
Storm names
The following names were used for named storms that formed in the north Atlantic in 1992.[81] Subtropical storms were unnamed until 2002,[82] as a result, the subtropical cyclone in April 1992 did not receive a name.[83] The names not retired from this list appeared again on the naming list for the 1998 season.[84] This is the same naming list used for the 1986 season.[85] Names that were not assigned are marked in gray.[84]
|
|
Retirement
At their meeting in the spring of 1993, the World Meteorological Organization retired the name Andrew from the list above. The name that replaced it on the naming list for the 1998 season was Alex.
Season effects
This is a table of all of the storms that formed in the 1992 Atlantic hurricane season. It includes their duration, names, landfall(s) – denoted by bold location names – damages, and death totals. Deaths in parentheses are additional and indirect (an example of an indirect death would be a traffic accident), but are still related to that storm. Damage and deaths include totals while the storm was extratropical or a wave or low, and all of the damage figures are in 1992 USD.
| Storm name |
Dates active | Storm category
at peak intensity |
Max 1-min wind mph (km/h) |
Min. press. (mbar) |
Areas affected | Damage (millions USD) |
Deaths | |||
|---|---|---|---|---|---|---|---|---|---|---|
| Unnamed | April 21 – April 24 | Subtropical storm | 50 (85) | 1002 | none | none[83] | 0[83] | |||
| One | June 25 – June 26 | Tropical depression | 35 (55) | 1007 | Florida | 2.6[9][10] | 4 (1)[9][10][11] | |||
| Two | July 24 – July 26 | Tropical depression | 35 (55) | 1015 | none | none[32] | 0[32] | |||
| Andrew | August 16 – August 28 | Category 5 hurricane | 175 (280) | 922 | Bahamas (Bahama Banks and Berry Islands), Southeastern United States (Florida), Gulf Coast of the United States (Louisiana), Midwestern United States, Mid-Atlantic states |
26500[12] | 26 (39)[12] | |||
| Bonnie | September 17 – September 30 | Category 2 hurricane | 110 (175) | 965 | Azores | Unknown[52] | 1[7] | |||
| Charley | September 21 – September 27 | Category 2 hurricane | 110 (175) | 965 | Azores | Unknown[54] | 0[54] | |||
| Danielle | September 22 – September 26 | Tropical storm | 60 (95) | 1001 | North Carolina, Mid-Atlantic states (Maryland), New England | Unknown[56] | 2[13] | |||
| Seven | September 25 – October 1 | Tropical depression | 35 (55) | 1008 | none | Unknown[62] | 0[62] | |||
| Earl | September 26 – October 3 | Tropical storm | 65 (100) | 990 | Florida, Georgia, North Carolina | none[86] | 0[86] | |||
| Frances | October 23 – October 27 | Category 1 hurricane | 85 (140) | 976 | Newfoundland | none[79] | 0[79] | |||
| Season Aggregates | ||||||||||
| 10 cyclones | April 21 – October 27 | 175 (280) | 922 | 26,500 | 66 (40) | |||||
See also
- List of Atlantic hurricanes
- List of Atlantic hurricane seasons
- 1992 Pacific hurricane season
- 1992 Pacific typhoon season
- 1992 North Indian Ocean cyclone season
- South-West Indian Ocean cyclone season: 1991–92, 1992–93
- Australian region cyclone season: 1991–92, 1992–93
- South Pacific cyclone season: 1991–92, 1992–93
References
- 1 2 3 Background information: the North Atlantic hurricane season (Report). Climate Prediction Center. August 4, 2011. Retrieved November 17, 2011.
- 1 2 "Forecast Verifications". Colorado State University. 2010. Retrieved December 1, 2011.
- 1 2 Jill F. Hasling (May 1, 2008). "Comparison of Weather Research Center's OCSI Atlantic Annual Seasonal Hurricane Forecasts with Colorado State Professor Bill Gray's Seasonal Forecast" (PDF). Weather Research Center. Retrieved November 19, 2011.
- 1 2 3 James Martinez (June 6, 1992). "Another Mild Hurricane Season For Florida?". The Lakeland Ledger. Associated Press. Retrieved November 17, 2011.
- 1 2 Mason Peters (August 11, 1992). "Hurricane Forecast Stays At Four For This Year". The Virginian-Pilot. Retrieved November 26, 2011.
- ↑ "In The Nation". The Baltimore Sun. June 1, 1992. Retrieved November 17, 2011.
- 1 2 3 4 5 6 7 8 Max Mayfield; Lixion Avila; Edward Rappaport (March 1994). Atlantic Hurricane Season of 1992 (PDF) (Report). National Hurricane Center. Retrieved September 5, 2011.
- 1 2 Richard Pasch; Lixion Avila (March 1994). Atlantic Tropical Systems of 1992 (PDF) (Report). National Hurricane Center. Retrieved December 2, 2011.
- 1 2 3 4 5 City of Anna Maria, Florida (2006). City of Anna Maria (PDF) (Report). Retrieved February 23, 2007.
- 1 2 3 4 5 6 David K. Rogers; Monica Davey; Bill Duryea; Carol A. Marbin; Marty Rosen (June 26, 1992). "Depression forms in Gulf". St. Petersburg Times.
- 1 2 3 "Heavy Rains Kill 2; Damages Houses". Miami Herald. June 27, 1992.
- 1 2 3 4 5 6 7 8 9 Edward Rappaport (December 10, 1993). Hurricane Andrew Preliminary Report (Report). National Hurricane Center. Retrieved November 17, 2011.
- 1 2 3 James Hudgins (2000). Tropical cyclones affecting North Carolina since 1586 (Report). National Weather Service. Archived from the original on March 11, 2007. Retrieved November 17, 2011.
- ↑ Neal Dorst (January 21, 2010). Subject: G1) When is hurricane season? (Report). Hurricane Research Division. Retrieved November 17, 2011.
- ↑ "Researcher says East Coast in line for hurricanes". The Victoria Advocate. Associated Press. November 30, 1992. Retrieved November 17, 2011.
- ↑ Hurricane Research Division (March 2011). Atlantic basin Comparison of Original and Revised HURDAT (Report). National Oceanic and Atmospheric Administration. Retrieved July 23, 2011.
- ↑ David Levinson (August 20, 2008). 2005 Atlantic Ocean Tropical Cyclones (Report). National Climatic Data Center. Retrieved November 17, 2011.
- 1 2 3 4 National Hurricane Center (1992). "Subtropical Storm One Preliminary Report". Retrieved August 21, 2007.
- 1 2 3 Lawrence (1992). "Subtropical Storm One Discussion One". National Hurricane Center. Retrieved August 21, 2007.
- ↑ National Hurricane Center (1992). "April 22 Ship Data". Retrieved August 21, 2007.
- ↑ Jarrell (1992). "Subtropical Storm One Discussion Three". National Hurricane Center. Retrieved August 21, 2007.
- ↑ National Hurricane Center (1992). "Subtropical Storm One Preliminary Report (Page 2)". Retrieved August 21, 2007.
- ↑ Rappaport (1992). "Subtropical Depression One Discussion Seven". National Hurricane Center. Retrieved August 21, 2007.
- ↑ Lawrence (1992). "Subtropical Depression One Discussion Nine". National Hurricane Center. Retrieved August 21, 2007.
- 1 2 Tropical Depression One Preliminary Report (Report). National Hurricane Center. 1992. p. 1. Retrieved September 28, 2011.
- ↑ Lixion Avila; Jerry Jarrell (July 24, 1992). Tropical Depression Two Discussion Number 1 (TXT) (Report). National Hurricane Center. Retrieved September 28, 2011.
- ↑ Miles Lawrence (June 26, 1992). Tropical Depression Two Discussion Number 4 (TXT) (Report). National Hurricane Center. Retrieved September 28, 2011.
- ↑ Principales eventos pluviales sobre Cuba en el Periodo 1963 – 2006 (Report). CubAgua. Archived from the original on June 3, 2012. Retrieved September 28, 2011.
- ↑ Tropical Depression One Preliminary Report (Report). National Hurricane Center. 1992. p. 2. Retrieved September 28, 2011.
- ↑ David Roth (July 24, 2008). "Tropical Depression One – June 22–28, 1992". Hydrometeorological Prediction Center. Retrieved September 28, 2011.
- ↑ Mark Bourgeois (June 30, 1992). "Citrus industry may be biggest loser". Saint Petersburg Times.
- 1 2 3 4 Harold Gerrish (September 14, 1992). Tropical Depression Two Preliminary Report (Report). National Hurricane Center. Retrieved November 15, 2011.
- ↑ Lixion Avila; Jerry Jarrell (July 24, 1992). Tropical Depression Two Discussion Number 1 (TXT) (Report). National Hurricane Center. Retrieved November 15, 2011.
- ↑ Lixion Avila (July 25, 1992). Tropical Depression Two Discussion Number 4 (TXT) (Report). National Hurricane Center. Retrieved November 15, 2011.
- ↑ Lixion Avila (July 25, 1992). Tropical Depression Two Discussion Number 5 (TXT) (Report). National Hurricane Center. Retrieved November 15, 2011.
- ↑ Harold Gerrish (July 26, 1992). Tropical Depression Two Discussion Number 8 (TXT) (Report). National Hurricane Center. Retrieved November 15, 2011.
- ↑ Edward Rappaport (February 7, 2005). Hurricane Andrew Addendum (Report). National Hurricane Center. Retrieved November 17, 2011.
- ↑ Arthur Rolle (1992). Hurricane Andrew in the Bahamas (Report). National Hurricane Center. p. 2. Retrieved November 17, 2011.
- ↑ Arthur Rolle (1992). Hurricane Andrew in the Bahamas (Report). National Hurricane Center. p. 3. Retrieved November 17, 2011.
- ↑ Edwin McDowell (September 27, 1992). "After the storms: Three reports; Bahamas". New York Times. Retrieved November 17, 2011.
- ↑ United Nations Department of Humanitarian Affairs (August 26, 1992). Bahamas and U.S.A. – Hurricane Andrew Aug 1992 UN DHA Information Reports 1–3 (Report). ReliefWeb. Retrieved November 17, 2011.
- ↑ John Williams; Ivar Duedall; Fred Doehring (1997). Florida Hurricanes and Tropical Storms. University Press of Florida. ISBN 0-8130-2417-X.
- ↑ Lovelace and McPherson (1998). Effects of Hurricane Andrew (1992) on Wetlands in Southern Florida and Louisiana (Report). U.S. Geological Survey. Retrieved November 17, 2011.
- ↑ David Roth (May 2, 2007). Hurricane Andrew – August 23–28, 1992 (Report). Hydrometeorological Prediction Center. Retrieved November 17, 2011.
- ↑ Grant Goodge. Storm Data Excerpt for Hurricane Andrew – August 1992 (PDF) (Report). National Climatic Data Center. Retrieved March 26, 2012.
- ↑ New Orleans, Louisiana National Weather Service (September 15, 1992). Final Storm Report... Hurricane Andrew... Corrected (GIF) (Report). National Oceanic and Atmospheric Administration. p. 2. Retrieved November 17, 2011.
- ↑ Jackson, Mississippi National Weather Service (September 22, 2010). A Look Back at Hurricane Rita (Report). National Oceanic and Atmospheric Administration. Retrieved November 17, 2011.
- ↑ Richard Knabb; Jamie Rhome; Daniel Brown (September 14, 2011). Hurricane Katrina Tropical Cyclone Report (PDF) (Report). National Hurricane Center. Retrieved November 17, 2011.
- 1 2 Richard Pasch (December 1, 1992). Hurricane Bonnie Preliminary Report (Report). National Hurricane Center. p. 1. Retrieved November 17, 2011.
- ↑ Harold Gerrish (September 27, 2011). Tropical Storm Bonnie Discussion Number 40 (TXT) (Report). National Hurricane Center. Retrieved November 17, 2011.
- ↑ Harold Gerrish (September 28, 1992). Tropical Storm Bonnie Discussion Number 41 (TXT) (Report). National Hurricane Center. Retrieved November 17, 2011.
- 1 2 3 Richard Pasch (December 1, 1992). Hurricane Bonnie Preliminary Report (Report). National Hurricane Center. p. 2. Retrieved November 17, 2011.
- 1 2 Max Mayfield (November 14, 1992). Hurricane Charley Preliminary Report (Report). National Hurricane Center. p. 1. Retrieved November 17, 2011.
- 1 2 3 Max Mayfield (November 14, 1992). Hurricane Charley Preliminary Report (Report). National Hurricane Center. p. 2. Retrieved November 17, 2011.
- 1 2 Miles Lawrence (November 30, 1992). Tropical Storm Danielle Preliminary Report (Report). National Hurricane Center. p. 1. Retrieved November 17, 2011.
- 1 2 Miles Lawrence (November 30, 1992). Tropical Storm Danielle Preliminary Report (Report). National Hurricane Center. p. 2. Retrieved November 17, 2011.
- ↑ Glenn Field (1992). Tropical Storm Danielle Report (Report). Raleigh National Weather Service. Retrieved November 17, 2011.
- 1 2 3 Steve Stone (September 26, 1992). "Coast is spared the worst of unpredictable Danielle". Virginia Pilot. p. 1. Retrieved November 17, 2011.
- 1 2 3 Davis (1992). Danielle Preliminary Report (Report). Baltimore National Weather Service. Retrieved November 17, 2011.
- 1 2 3 Demaurice (1992). Tropical Storm Danielle Preliminary Report (Report). Cape Hatteras National Weather Service. Retrieved November 17, 2011.
- ↑ David Roth (May 16, 2007). Tropical Storm Danielle – September 24–27, 1992 (Report). Hydrometeorological Prediction Center. Retrieved November 17, 2011.
- 1 2 3 4 5 Harold Gerrish (October 13, 1992). Tropical Depression Seven Preliminary Report (Report). National Hurricane Center. p. 1. Retrieved November 15, 2011.
- ↑ Max Mayfield (September 26, 1992). Tropical Depression Seven Discussion Number 2 (TXT) (Report). National Hurricane Center. Retrieved November 15, 2011.
- ↑ Lixion Avila (September 26, 1992). Tropical Depression Seven Discussion Number 4 (TXT) (Report). National Hurricane Center. Retrieved November 15, 2011.
- ↑ Max Mayfield (September 27, 1992). Tropical Depression Seven Discussion Number 6 (TXT) (Report). National Hurricane Center. Retrieved November 15, 2011.
- ↑ Richard Pasch (September 28, 1992). Tropical Depression Seven Discussion Number 11 (TXT) (Report). National Hurricane Center. Retrieved November 15, 2011.
- ↑ Richard Pasch (September 29, 1992). Tropical Depression Seven Discussion Number 14 (TXT) (Report). National Hurricane Center. Retrieved November 15, 2011.
- ↑ Richard Pasch (September 29, 1992). Tropical Depression Seven Discussion Number 15 (TXT) (Report). National Hurricane Center. Retrieved November 15, 2011.
- ↑ Richard Pasch (September 30, 1992). Tropical Depression Seven Discussion Number 18 (TXT) (Report). National Hurricane Center. Retrieved November 15, 2011.
- ↑ Harold Gerrish (October 1, 1992). Tropical Depression Seven Discussion Number 23 (TXT) (Report). National Hurricane Center. Retrieved November 15, 2011.
- 1 2 3 Lixion Avila (1992). Tropical Storm Earl Preliminary Report (Report). National Hurricane Center. Retrieved November 16, 2011.
- ↑ Mayfield, Max (October 3, 1992). Tropical Depression Earl Advisory 29 (TXT) (Report). National Hurricane Center. Retrieved January 10, 2010.
- ↑ Lixion Avila (1992). Tropical Storm Earl Preliminary Report (Report). National Hurricane Center. Retrieved January 10, 2010.
- ↑ Tom Grazulis; Bill McCaul (2008). List of Known Tropical Cyclones Which Have Spawned Tornadoes (Report). The Tornado Project. Retrieved November 16, 2011.
- ↑ David Roth (June 18, 2007). Tropical Storm Earl – September 28–30, 1992 (Report). Hydrometeorological Prediction Center. Retrieved November 16, 2011.
- ↑ "Tropical storm attacks shoreline". The Robesonian. Associated Press. September 30, 1992. Retrieved May 25, 2011.
- ↑ Jay Hamburg (October 1, 1992). "Tropical Storm Earl Took Big Chunks Out Of The Coastline, Swept Swimmers Out To Sea And Was Hard To Get Rid Of". Orlando Sentinel. Retrieved May 25, 2011.
- ↑ Edward Rappaport (November 23, 1992). Hurricane Frances Preliminary Report (Report). National Hurricane Center. p. 1. Retrieved November 17, 2011.
- 1 2 3 4 Edward Rappaport (November 23, 1992). Hurricane Frances Preliminary Report (Report). National Hurricane Center. p. 2. Retrieved November 17, 2011.
- ↑ 1992–Frances (Report). Environment Canada. September 14, 2010. Retrieved November 17, 2011.
- ↑ "Bad year feared for 1992 season". Eugene Register-Guard. Associated Press. May 31, 1992. Retrieved November 16, 2011.
- ↑ Chris Landsea; Sandy Delgado (May 18, 2011). Subject: A6) What is a sub-tropical cyclone? (Report). National Oceanic and Atmospheric Administration. Archived from the original on October 11, 2011. Retrieved November 16, 2011.
- 1 2 3 Miles Lawrence (June 6, 1992). Subtropical Storm One Preliminary Report (Report). National Hurricane Center. p. 1. Retrieved September 28, 2011.
- 1 2 World-wide Tropical Cyclone Names (Report). National Hurricane Center. August 10, 1997. Archived from the original on December 10, 1997. Retrieved November 17, 2011.
- ↑ "Andrew, Agatha top 1986 hurricane list". The Gadsden Times. Associated Press. May 23, 1986. Retrieved November 17, 2011.
- 1 2 Lixion Avila (1992). "Tropical Storm Earl Preliminary Report". National Hurricane Center. p. 2. Retrieved November 21, 2011.
External links
- Monthly Weather Review
- U.S. Rainfall information concerning 1992 tropical cyclones
- Clips of Weather Channel coverage of 1992 Atlantic hurricane season
Tropical cyclones of the 1992 Atlantic hurricane season | ||
|---|---|---|
| ||
| ||