2005 Atlantic hurricane season
 | |
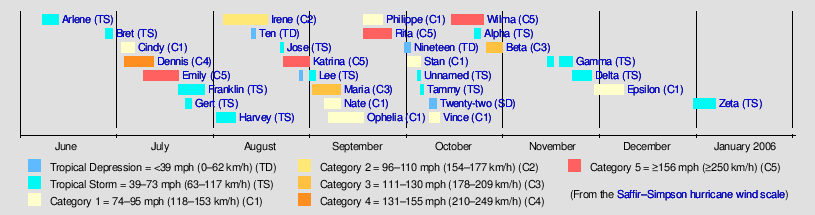
| Season summary map | |
| First system formed | June 8, 2005 |
|---|---|
| Last system dissipated | January 6, 2006 (record latest, tied with 1954) |
| Strongest storm1 | Wilma (Most intense hurricane in the Atlantic basin) – 882 mbar (hPa) (26.05 inHg), 185 mph (295 km/h) (1-minute sustained) |
| Total depressions | 31 (record high) |
| Total storms | 28 (record high) |
| Hurricanes | 15 (record high) |
| Major hurricanes (Cat. 3+) | 7 (record high, tied with 1961) |
| Total fatalities | 3,913 total |
| Total damage | $158.9 billion (2005 USD) (Most costliest season in Atlantic history) |
| 1Strongest storm is determined by lowest pressure | |
2003, 2004, 2005, 2006, 2007 | |
| Related articles | |
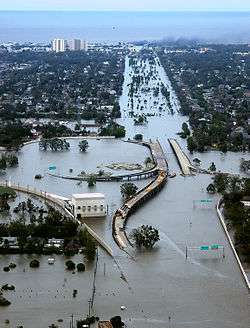
The 2005 Atlantic hurricane season was the most active Atlantic hurricane season in recorded history, shattering numerous records. The impact of the season was widespread and ruinous with an estimated 3,913 deaths and record damage of about $159.2 billion. Of the storms that made landfall, five of the season's seven major hurricanes—Dennis, Emily, Katrina, Rita, and Wilma—were responsible for most of the destruction. The Mexican states of Quintana Roo and Yucatán and the US states of Florida and Louisiana were each struck twice by major hurricanes; Cuba, the Bahamas, Haiti, Mississippi, Texas, Alabama, and Tamaulipas were each struck once and in each case brushed by at least one more. The most catastrophic effects of the season were felt on the United States' Gulf Coast, where a 30 ft (10 m) storm surge from Hurricane Katrina caused devastating flooding that destroyed most structures on the Mississippi coastline; subsequent levee failures in New Orleans, Louisiana caused by the storm crippled the city. Furthermore, Hurricane Stan combined with an extratropical system to cause deadly mudslides across Central America, with Guatemala being hardest-hit.
The 2005 season was the first to observe more tropical cyclones in the Atlantic than the West Pacific; on average, the latter experiences 26 while the Atlantic only averages 12. This event was repeated in the 2010 season; however, the 2010 typhoon season broke the record for the fewest storms observed in a single year, while the 2005 typhoon season featured near average activity.
The season officially began on June 1, 2005, and lasted until November 30, although it effectively persisted into January 2006 due to continued storm activity. A record twenty-eight tropical and subtropical storms formed, of which a record fifteen became hurricanes. Of these, a record seven strengthened into major hurricanes, a record-tying five became Category 4 hurricanes and a record four reached Category 5 strength, the highest categorization for hurricanes on the Saffir-Simpson Hurricane Scale. Among these Category 5 storms were hurricanes Katrina and Wilma, respectively the costliest and the most intense Atlantic hurricanes on record. This year was also notable because the list of storm names was used up and six Greek letter names had to be used.
Seasonal forecasts
| Source | Date | Tropical storms |
Hurricanes | Major hurricanes |
| CSU | Average (1950–2000)[1] | 9.6 | 5.9 | 2.3 |
| NOAA | Average[2] | 11 | 6 | 2 |
| CSU | December 3, 2004 | 11 | 6 | 3 |
| CSU | April 1, 2005 | 13 | 7 | 3 |
| NOAA | May 16, 2005 | 12–15 | 7–9 | 3–5 |
| CSU | May 31, 2005 | 15 | 8 | 4 |
| NOAA | August 2, 2005 | 18–21 | 9–11 | 5–7 |
| CSU | August 5, 2005 | 20 | 10 | 6 |
| Actual activity | 28 | 15 | 7 | |
Forecasts of hurricane activity are issued before each hurricane season by noted hurricane expert William M. Gray and his associates at Colorado State University (CSU), and separately by forecasters with the U.S. Government's National Oceanic and Atmospheric Administration (NOAA). Prior to and during the 2005 season, Gray issued four forecasts, each time increasing the predicted level of activity. The NOAA issued two forecasts, one shortly before the season and one two months into the season, drastically increasing the predicted level of activity in the second release. Nonetheless, all forecasts fell far short of the actual activity of the season.
Preseason forecasts
On December 3, 2004, Gray's team issued its first extended-range forecast for the 2005 season, predicting a slightly above-average season. Additionally, the team predicted a greatly increased chance of a major hurricane striking the East Coast of the United States and the Florida peninsula. Though the forecast predicted above-average activity, the level predicted was significantly less than the 2004 season.[1] On April 1, 2005, after confirming that El Niño conditions would not develop, Gray and his team revised the December forecast upward, expecting thirteen tropical storms instead of eleven and seven hurricanes instead of six. In addition, the chance of a storm impacting the United States was raised slightly.[3] On May 16, 2005, 16 days before the season began, NOAA issued its outlook for the 2005 season, forecasting a 70% chance of above-normal activity. The accumulated cyclone energy (ACE) value for the season was predicted to be 120–190% of the median ACE of 87.5 × 10⁴ kt2.[4] Shortly thereafter, on May 31, the day before the season officially began, Gray's team revised its April forecast upwards to 15 named storms, 8 hurricanes, and 4 major hurricanes.[5]
Midseason outlook
On August 2, after an extraordinarily active early season, the NOAA released an updated outlook on the remainder of the season, significantly raising the expected level of activity to numbers about double those of a normal season. The ACE value was now forecast to be 180 to 270% of the median. The NOAA also noted a higher than normal confidence in the forecast of above-normal activity.[6] On August 5, 2005, Gray and his associates followed suit and issued their updated forecast; it was consistent with NOAA's update.[7] Although neither the NOAA nor Gray had ever forecast such high levels of activity, even the midseason outlooks fell far short of the actual level of activity. The actual ACE would prove to be 248 × 104 kt2[8] — 277% of the median.
Storms
June and July
On June 8, nearly two months earlier than when the 2004 season started, Tropical Storm Arlene formed in the western Caribbean, crossing Cuba before making landfall on the Florida Panhandle on June 11. Arlene caused only moderate damage, although one swimmer was caught in a riptide and drowned in Miami Beach, Florida.[9][10]
Tropical Storm Bret formed in the Bay of Campeche on June 28 and made landfall in Veracruz the next morning. The storm damaged hundreds of homes and caused flooding which killed two people.[11]
Hurricane Cindy formed in the Gulf of Mexico on July 4. Originally thought to be a tropical storm, Cindy made landfall in Louisiana on July 5 as a minimal hurricane, dropping up to five in (130 mm) of rain, spawning several tornadoes, flooding some coastal areas including Coden, Alabama, and killing three people. Cindy was upgraded to a hurricane in the post-storm analysis.[12][13]
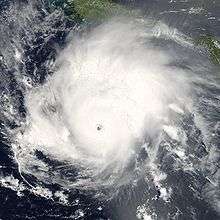
On July 5, Hurricane Dennis formed in the eastern Caribbean; it crossed Grenada before intensifying into a Category 4 hurricane, the strongest ever recorded in July with a pressure of 930 mbar (hPa). Dennis struck Cuba at full force, then made a final landfall on the Florida Panhandle. The hurricane killed 89 people (mostly in Haiti) and caused $4–$6 billion (2005 USD, $4.85 billion – $7.28 billion 2016 USD) in damage in Cuba and the United States.[14][15]
Soon thereafter, Hurricane Emily formed in the Atlantic on July 11. It entered the Caribbean Sea and quickly intensified to a Category 4 storm, breaking Dennis's record for July intensity when its pressure reached 929 mbar (hPa). Emily then briefly reached Category 5 intensity—the earliest such storm ever recorded in the Atlantic. Emily crossed the Yucatán Peninsula at Category 4 strength before hitting Tamaulipas at Category 3 strength. Emily killed at least 14 people over the course of its path. An estimated $400 million (2005 USD; $485 million 2016 USD) in damage was reported.[16]
Tropical Storm Franklin formed off the Bahamas on July 18. The storm moved northeast and became extratropical off the coast of Atlantic Canada without ever having threatened land.[17]
Tropical Storm Gert followed soon after on July 24. Gert struck Veracruz near where Emily had hit a few days before; roughly 1,000 people were evacuated for fear of flooding, but no damage or deaths were reported.[18]
August
Like July, August also got off to a fast start: Tropical Storm Harvey formed southwest of Bermuda on August 3. Harvey dropped some rain on Bermuda as it moved to the northeast; it became extratropical on August 8 in the open Atlantic Ocean.[19]
The tropical depression that would become Hurricane Irene formed west of the Cape Verde Islands on August 4. The system moved west and north and did not reach hurricane strength until August 14, at which point it became the second Cape Verde-type hurricane of the season. Irene turned northeast and briefly reached Category 2 status before weakening and becoming extratropical on August 18. It never posed a threat to land.[20]

Tropical Depression Ten formed east of the Lesser Antilles on August 13. The system dissipated the next day. Its remnants soon merged with another system and eventually contributed to the formation of Hurricane Katrina.[21]
Tropical Storm Jose followed, forming in the Bay of Campeche on August 22. It strengthened rapidly but quickly reached the coast and made landfall in the Mexican state of Veracruz on August 23, preventing further strengthening. Jose forced 25,000 people to evacuate their homes in Veracruz and killed six people in the state of Oaxaca; two more were reported missing.[22] In all, damage in Mexico amounted to $45 million (2005 USD; $54.6 million 2016 USD).[23]
.ogv.jpg)
Hurricane Katrina formed in mid-August over the Bahamas. It became a tropical storm on August 24 and reached hurricane intensity before making landfall in south Florida as a minimal hurricane. A few hours later, the storm entered the Gulf of Mexico and intensified rapidly into a Category 5 hurricane while crossing the Loop Current on August 28. Katrina made landfall shortly after 06:00 CST on August 29 near the mouth of the Mississippi River as an extremely large Category 3 hurricane. Category 5-level storm surges (as the storm had weakened only in the previous several hours) caused catastrophic damage along the coastlines of Louisiana, Mississippi, and Alabama. Within hours, levees separating Lake Pontchartrain from New Orleans, Louisiana were breached by the surge, ultimately flooding about 80% of the city. Wind damage was reported well inland, impeding relief efforts. Katrina is estimated to be responsible for at least $108 billion (2005 USD; $131 billion in 2016 USD) in damage, breaking Hurricane Andrew's record in 1992 and making it the costliest natural disaster in U.S. history. It was the deadliest U.S. hurricane since the 1928 Okeechobee Hurricane, killing at least 1,836 people. The 1900 Galveston Hurricane remains the deadliest natural disaster in United States history, with a death toll of approximately 6,000.[24][25]
On August 24, a vigorous tropical wave developed off the coast of Africa which eventually spawned an area of low pressure. The low gradually became better organized and was designated Tropical Depression Thirteen on August 28, about midway between the Lesser Antilles and Africa. However, northerly wind shear prevented the depression from strengthening and it degenerated into a broad low-pressure area the next day. After traveling rapidly towards the north the low regenerated into a tropical depression and shortly after was declared Tropical Storm Lee on August 31. Lee was only briefly a tropical storm before it weakened back to a tropical depression. The depression degenerated into a broad low-pressure area again before being absorbed by a cold front on September 4.[26]
September
Hurricane Maria led off the month of September, forming as a tropical storm well east of the Leeward Islands on September 2. Maria reached its peak as a Category 3 hurricane on September 5, turning northeast and weakening before becoming extratropical on September 10. Unusually, this extratropical storm strengthened as it moved toward Iceland; its remnants struck Norway where one person was killed in a landslide.[27]
Hurricane Nate formed southwest of Bermuda on September 5 and moved northeast as it strengthened into a strong Category 1 hurricane. Nate became extratropical on September 10; the storm never approached land, although it did interfere with Canadian naval vessels en route to the Gulf Coast to help in Katrina relief efforts.[28]
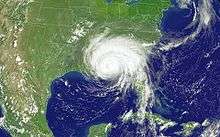
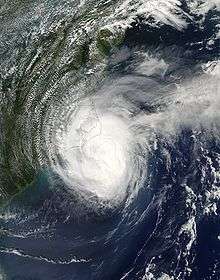
Hurricane Ophelia formed as a tropical depression in the Bahamas on September 6 and almost immediately made landfall on Grand Bahama. It became a tropical storm off the coast of Florida before strengthening into a large Category 1 storm and raking a long stretch of the southern North Carolina coast with heavy winds and storm surge on September 12 and September 13. The hurricane's eye never made landfall and moved back out to sea before becoming extratropical on September 17 and striking Atlantic Canada. Total damage estimates were around $70 million (2005 USD).[29]
Hurricane Philippe formed east of the Leeward Islands on September 17. It moved northwards, reaching Category 1 intensity before weakening and finally dissipating on September 23. No landmasses were affected.[30]

Hurricane Rita formed as a tropical storm over the Turks and Caicos Islands on September 18. The storm reached Category 2 intensity as it moved south of the Florida Keys on September 20. Rapid intensification ensued as Rita moved into the Gulf of Mexico, and Rita became a Category 5 hurricane on September 21, becoming the third (now fourth) most intense hurricane ever recorded in the Atlantic Basin. Rita made landfall near the Texas-Louisiana border on September 24. Major flooding was reported in Port Arthur and Beaumont, Texas, while Cameron and Calcasieu parishes in Louisiana were devastated. Offshore oil platforms throughout Rita's path also suffered significant damage. Six people are confirmed dead from Rita's direct effects, and total damage from the storm is estimated at about $10 billion (2005 USD; $12.1 billion 2016 USD). One hundred and thirteen indirect deaths have been reported, mostly from the exodus from Houston, Texas and surrounding counties.[31][32]
Tropical Depression Nineteen formed west of the Cape Verde Islands on September 30 but dissipated on October 2 without having threatened land.[33]
October

Hurricane Stan was the first October storm, reaching tropical storm status on October 2 just before crossing the Yucatán Peninsula. In the Bay of Campeche, Stan briefly reached hurricane strength before making landfall south of Veracruz, Veracruz, on October 4. Stan was a part of a large system of rainstorms, which dropped torrential rainfall that caused catastrophic flooding and mudslides over southern Mexico and Central America. Well over 1,000 total deaths were caused by the flooding, of which 80–100 are directly attributed to Stan.[34]
An initially unnoticed Unnamed Subtropical Storm was discovered by the NHC during the postseason analysis. This short-lived subtropical storm formed on October 4 south of the Azores and was absorbed by an extratropical low the next day, after passing over those islands.[35]
Tropical Storm Tammy led a brief existence before making landfall in northeastern Florida on October 5. Tammy dropped heavy rains over portions of the southeast United States before merging with a frontal system that would eventually cause the Northeast U.S. flooding of October 2005.[36][37]
Subtropical Depression Twenty-two formed southeast of Bermuda on October 8. It dissipated the next day, although its remnants approached New England and contributed to the Northeast U.S. flooding of October 2005.[38]
Hurricane Vince formed over unfavorably cold water in the east Atlantic near the Madeira Islands on October 8 as a subtropical storm. It was first recorded by the NHC on October 9 when it became tropical, and shortly thereafter, it briefly strengthened into a hurricane. The storm made an even more unusual landfall in Spain on October 11, making it the first tropical cyclone to impact Spain since the 1842 Spain hurricane.[39]
Hurricane Wilma formed on October 17 in the western Caribbean southwest of Jamaica and rapidly strengthened. On October 19 it became the strongest tropical cyclone on record in the Atlantic basin, with 185 mph (295 km/h) winds and a central pressure of 882 millibars (26.0 inHg). The hurricane moved slowly and struck Quintana Roo on October 22 as a Category 4 hurricane, causing very heavy damage to Cancún and Cozumel. After emerging into the Gulf of Mexico, Wilma sharply changed directions and passed north of Cuba before striking southern Florida on the 24th as a Category 3 storm, then moving into the Atlantic Ocean and becoming extratropical. Wilma is directly credited with 23 deaths; total damage is estimated at around $29 billion (2005 USD; $35.2 billion 2016 USD), mostly in the United States, Mexico, and Cuba.[40]
Tropical Storm Alpha formed in the eastern Caribbean on October 22 and crossed Hispaniola, causing major flooding before merging with Wilma. A total of 42 people are reported dead from the storm in Haiti and the Dominican Republic.[41]
Hurricane Beta formed in the southern Caribbean on October 26 and strengthened into a Category 3 hurricane before making landfall in the Colombian islands of San Andrés & Providencia and in Nicaragua on October 30.[42] As of 2012, Hurricane Beta was responsible for nine fatalities and more than $15.5 million in damage across four countries.
November, December, and January 2006

Tropical activity declined very slowly as the season wound down. Tropical Storm Gamma initially formed on November 15 in the central Caribbean, and degenerated into a tropical wave before reforming. Although the storm dissipated on November 20 after having made landfall in northern Honduras, rainfall from Gamma caused 41 deaths in Honduras and Belize.[43]
Tropical Storm Delta formed in the eastern Atlantic on November 23; it approached but never attained hurricane strength. Delta became extratropical on November 28 shortly before striking the Canary Islands at full force, causing seven deaths and toppling El Dedo de Dios, a famous land formation on Gran Canaria.[44]
Hurricane Epsilon formed as a tropical storm on November 29 in a hostile environment in the middle of the Atlantic. It reached hurricane strength on December 2 and defied forecasting by persisting for over a week before dissipating.[45]
Tropical Storm Zeta became the final storm of the season when it formed on December 30, six hours short of tying the record of Hurricane Alice of 1954 as the latest-forming named storm in a season. Zeta dissipated on January 6, 2006, having become the longest-lived January tropical cyclone in Atlantic basin history.[46]
Deaths and damage

The storms of the season were extraordinarily damaging and were responsible for significant loss of life. Total damage is estimated to be about $159.2 billion (2005 US$), and an estimated 2,067 people were confirmed dead. However, due to uncertainties in the death toll caused by Stan, the death toll from the season could be as high as 4,000 people.[47]
The hardest-hit area was the United States Gulf Coast from eastern Texas to the Florida Panhandle. First to strike the area was Hurricane Dennis, which caused $2.23 billion in damage along the Florida Panhandle.[14] Hurricane Katrina caused catastrophic damage to the Gulf Coast, devastating a long stretch of coast along Louisiana, Mississippi, and Alabama with a 30-foot (9 m) storm surge. Wind damage was reported well inland, slowing down recovery efforts. Storm surge also breached levees in the city of New Orleans, Louisiana, flooding about 80% of the city. Total damage has been estimated at $108 billion, and at least 1,836 people were killed by the storm; Katrina is by far the costliest hurricane in U.S. history, surpassing 1992's Hurricane Andrew, and the deadliest hurricane in the U.S. since 1928.[24][48][49] Hurricane Rita struck near the same area, re-flooded New Orleans (though to a far less degree than Katrina), and caused extensive damage along the coastlines of Louisiana and Texas; total damage is estimated at about $12 billion.[50] Tropical Storm Arlene and Hurricane Cindy also struck the Gulf Coast but caused much lighter damage.[9][12]
The Mexican state of Quintana Roo was also heavily hit, suffering billions of dollars in damage when Hurricanes Emily and Wilma both made landfall between Cozumel and Cancún. Wilma was particularly devastating, lashing the area with major hurricane-force winds for over a full day, and was possibly the most damaging hurricane in Mexican history.[40]
Wilma caused widespread heavy damage in south Florida, causing $20.6 billion in damage total in the United States.[51] Hurricanes Katrina and Rita had struck the same area earlier, causing lesser (but still significant) damage, and Tropical Storm Arlene killed one person caught in a rip current.[9] Hurricane Dennis also brushed the area on its track northward.[14]
In October the remnants of Tropical Storm Tammy and Subtropical Depression Twenty-two met over the Northeastern United States, causing intense flooding.[38]
Southeastern North Carolina suffered some damage from the slow-moving Hurricane Ophelia; damage from that storm were originally estimated at $1.6 billion, but finalized at only $70 million. The remainder of the Atlantic coast escaped the major storms, although some regions were affected by the remnants of several storms (including Katrina, Ophelia, Tammy, Subtropical Depression Twenty-two, and Wilma).[29]
Northeastern Mexico, including Veracruz and Tamaulipas, was struck repeatedly. Hurricane Emily struck Tamaulipas directly, causing severe damage. Tropical Storms Bret, Gert, and Jose also made landfall in the area but caused minimal damage, although they did cause 12 deaths.[22]
Southern Mexico, along with portions of Central America, suffered heavy flooding and mudslides from Hurricane Stan and nearby nontropical rains. Over 1,600 people were confirmed dead in total, with some towns completely wiped out, though most of these deaths were not directly related to the hurricane. Central America also suffered flooding from Tropical Storm Gamma and Hurricane Wilma, and Nicaragua was struck directly by Hurricane Beta. Gamma caused $13–18 million (2005 USD) in damage to crops; no damage figures are available for any of the other storms.[47]
The island of Hispaniola escaped the worst storms; however, at least 89 people were killed in Haiti from the effects of Hurricanes Dennis and Wilma and Tropical Storm Alpha. The Leeward Islands were generally spared all the storms,[47] although Dennis and Emily caused significant damage in the Windward Islands.[47]
Cuba was struck by Hurricane Dennis at peak strength, causing $1.4 billion in damage; it was the worst hurricane to hit Cuba in over 40 years. Some areas of Cuba also suffered heavy damage from Hurricanes Rita and Wilma.[14]
Unusual impacts were felt in Europe and nearby islands from four storms. Hurricane Maria intensified and affected northern Europe as a vicious extratropical storm, while Hurricane Vince maintained tropical characteristics onto the Iberian Peninsula as a weak tropical depression. Tropical Storm Delta struck the Canary Islands just after becoming extratropical, causing extensive damage before reaching Morocco as a weak extratropical system. In addition, the Azores were affected by the unnamed subtropical storm at its peak strength. Eight people were killed by those storms, and significant damage was reported as a result of Maria and Delta, although no figures are available.[47]
Economic impact
The level of activity of the season had far-reaching economic consequences. Because of the vulnerability of both oil extracting and refining capacity in the Gulf of Mexico, storms led to speculative spikes in the price of crude oil. The damage to refinery capacity in the United States caused gasoline to soar to record prices (even adjusted for inflation). Governments in Europe and the United States tapped strategic reserves of gasoline and petroleum, and shortages were reported in the days after Katrina in areas heavily dependent on the Gulf of Mexico for refined gasoline. Even weeks after the storm, prices remained elevated as the shortage in production remained over 1 million barrels (160,000 m3) per day.[24]
Rita damaged wells in the western Gulf of Mexico which were primarily exploratory, leading to concerns that future production would be damped for some time to come. Additionally, as the storm churned in the Gulf, forecasters predicted that it would strike Houston, Texas, the location of many major oil refineries that survived Katrina, leading to additional spikes in oil prices before the predictions changed. In Georgia, Governor Sonny Perdue declared "snow days" on September 26 and September 27, 2005, at all Georgia public schools to conserve fuel for school buses in anticipation of Rita's impact. However, as the storm veered away from Houston shortly before landfall, damage to refining capacity was not as great as feared.[31]
Agriculture in multiple countries was hard hit by extremely heavy rains from severe storms during the season. Early in the season, Hurricane Dennis caused significant damage to various citrus and vegetable crops in Cuba, though the damage was not crippling.[14] In Central America, Hurricane Stan and associated nontropical storms dropped upwards of 20 inches (500 mm) of rain, causing, in addition to severe flash floods and mud slides, heavy damage to crops, especially to the banana and coffee crops, which were nearly ready to be harvested. This caused significant economic disruption in Guatemala and surrounding nations, as the rural economies are highly dependent on the coffee and banana crops.[34] When Hurricane Beta struck Nicaragua later in the season, it also caused heavy damage to the banana crop, but the harvests had already ended, mitigating economic disruption.[42]
Katrina also had significant political consequences, as President George W. Bush, Louisiana governor Kathleen Blanco, and New Orleans mayor Ray Nagin all came under heavy criticism for what were considered sluggish or inappropriate responses to Hurricane Katrina. On December 14, 2005, congressional hearings began to investigate whether these claims had any merit. In addition, Michael Brown, head of the United States Federal Emergency Management Agency (FEMA), was forced to resign from his post after the organization came under fire for what was perceived as an insufficient response to Katrina.[52]
Forecasting uncertainty
A number of storms that formed in 2005 exhibited unusual behavior and challenged forecasters' ability to make correct predictions. Hurricane Vince formed farther northeast in the Atlantic than any other tropical cyclone on record at the time—only 2009's Grace has formed farther north—and then unexpectedly reached hurricane strength over waters considered too cold to support a hurricane.[39] Hurricane Wilma became the fastest-intensifying hurricane on record, and later strengthened unexpectedly in the face of strong wind shear.[53] Tropical Storm Delta, Hurricane Epsilon and Tropical Storm Zeta all formed over the cold waters of the late-season eastern Atlantic, much like Hurricane Vince (though at lower latitudes). All three persisted in the face of heavy wind shear, and Epsilon managed to reach hurricane strength over waters well below the temperatures previously thought necessary for hurricane formation. Epsilon became the longest-lasting December hurricane[45] while Zeta became the longest-lasting storm in January.[46]
Records and notable events
The 2005 season broke numerous records for tropical cyclone activity,[54] although records before 1944 are incomplete, so it is possible it might not be the most active season in history.[55]
Number of storms
| Systems | Average | Record | 2005 |
|---|---|---|---|
| Storms | 10 | 21 | 28 |
| Hurricanes | 6 | 12 | 15 |
| Category 3+ Hurricanes | 2 | 7 | 7 |
| Category 5 Hurricanes | 0.3 | 2 (tie) | 4 |
During the season 28 storms formed (27 named and one unnamed), surpassing almost all records for storm formation in the Atlantic. More tropical storms, hurricanes, major hurricanes and Category 5 hurricanes formed during the season than in any previously recorded Atlantic season.
The season was the first season to use "V" and "W" names, and when the season ran out of official alphabetical names after the use of Wilma, forecasters resorted to using letters from the Greek alphabet for the first time (although Alpha and Delta had been used for subtropical storms in the 1970s).
Almost every storm in 2005 set a record for early formation. Of the twenty-eight storms which formed, twenty-two of them qualified as the earliest-forming storm of that number; starting with Hurricane Dennis, almost every storm was such. (The record set by Dennis was later broken by Debby in 2012, which was again broken in 2016 with Danielle.) The season's activity was reflected with a very high cumulative accumulated cyclone energy (ACE) rating of 250. This total ranks it as the second-most active season on record, with only the 1933 season having a higher ACE value.[56] ACE is, broadly speaking, a measure of the power of the hurricane multiplied by the length of time it existed, so storms that last a long time, as well as particularly strong hurricanes, have high ACEs. ACE is only calculated for full advisories on tropical systems at or exceeding 34 knots (39 mph, 63 km/h) or tropical storm strength. Although officially, subtropical cyclones are excluded from the total,[57] the figure above includes periods when storms were in a subtropical phase.
Intense storms

Three of the six most intense hurricanes on record formed in 2005, topped off by Hurricane Wilma's 882 mbar (26.0 inHg) minimum pressure, shattering the 17-year-old record set by Hurricane Gilbert.[40] Hurricanes Emily, Katrina and Rita also attained Category 5 intensity, and Hurricanes Rita and Katrina became the fourth- and sixth-most intense recorded Atlantic storms, respectively. Hurricane Emily was not originally recorded as a Category 5 storm, but it was upgraded in the post-storm analysis by the National Hurricane Center.[16] The 2005 season is the only season on record with four Category 5 storms on the Saffir-Simpson Hurricane Scale; the previous record was only two. In addition, Hurricane Dennis reached Category 4 status, tying the record set by the 1999 season with five Category 4 storms.
Early strength and activity
| Most intense Atlantic hurricane seasons (since 1850)[nb 1] | ||
|---|---|---|
| Rank | Season | ACE |
| 1 | 1933 | 259 |
| 2 | 2005 | 250 |
| 3 | 1893 | 231 |
| 4 | 1926 | 230 |
| 5 | 1995 | 228 |
| 6 | 2004 | 227 |
| 7 | 1950 | 211 |
| 8 | 1961 | 205 |
| 9 | 1998 | 182 |
| 10 | 1999 | 177 |
In July, Hurricane Dennis became the strongest storm to form prior to August and the earliest Category 4 storm to form in the Caribbean.[14] When Hurricane Emily reached Category 5 intensity later in the month, the 2005 season became the only season to have two hurricanes reach Category 4 intensity before the end of July; Emily also broke Dennis's nine-day-old record for the strongest storm on record before August. Emily was also the first Category 5 hurricane ever recorded in July and the earliest by nearly three weeks (beating Hurricane Allen). The high level of activity and strength was reflected in the accumulated cyclone energy value at the end of July; at 63 it was the highest ever.
Additionally, seven storms formed before the end of July, breaking the record of five set in the 1887, 1933, 1936, 1959, 1966, and 1995 seasons. Five of those storms formed during July, also a new record.
Late activity
After forming on November 29, Hurricane Epsilon became the longest-lasting December hurricane on record when it maintained hurricane strength from December 2 to December 7. Epsilon is the second-strongest hurricane ever recorded in the month of December; only Hurricane Nicole of 1998 was stronger.
When Tropical Storm Zeta formed on December 30, it came second only to Hurricane Alice (also December 30, 1954, but later in the day) as the latest ever that the last storm of the season formed. Zeta also became only the second storm, after Alice, to persist through the end of the year and still be active at the start of the next.
Storm names
The names to the right were used for tropical storms and hurricanes that formed in the North Atlantic in 2005. This was the same list used for the 1999 season, with the exceptions of Franklin and Lee, which replaced Floyd and Lenny. The names not retired from this list were used again in the 2011 Atlantic hurricane season. Storms were named Franklin, Lee, Maria, Nate, Ophelia, Philippe, Rita, Stan, Tammy, Vince, Wilma, Beta, Gamma, Epsilon, and Zeta for the first time in 2005 (the names Alpha and Delta had been previously used in 1972 for two subtropical storms, but this is the first time they have been used in this way). This season used fifteen previously unused names, the most ever in an Atlantic season. Additionally, a subtropical storm that formed in early October was not recognized as such at the time and so did not receive a name. Vince and Wilma were the first named "V" and "W" storms ever in the Atlantic basin. In the spring of 2006, the World Meteorological Organization retired five hurricane names: Dennis, Katrina, Rita, Stan, and Wilma. Their replacements in the 2011 season were Don, Katia, Rina, Sean, and Whitney, respectively.[60] It was also decided it "was not practical to 'retire into hurricane history' a letter in the Greek Alphabet."[61] This surpassed the previous record for the number of hurricane names retired after a single season, four (held by the 1955, 1995, and 2004 seasons).[62]
Season effects
This is a table of all of the storms that have formed during the 2005 Atlantic hurricane season. It includes their names, duration, peak strength, areas affected, damage, and death totals. Deaths in parentheses are additional and indirect (an example of an indirect death would be a traffic accident), but were still related to that storm. Damage and deaths include totals while the storm was extratropical, a wave, or a low, and all of the damage figures are in 2005 USD.
| Saffir–Simpson hurricane wind scale | ||||||
| TD | TS | C1 | C2 | C3 | C4 | C5 |
| Storm name |
Dates active | Storm category
at peak intensity |
Max 1-min wind mph (km/h) |
Min. press. (mbar) |
Areas affected | Damage (millions USD) |
Deaths | |||
|---|---|---|---|---|---|---|---|---|---|---|
| Arlene | June 8 – 13 | Tropical storm | 70 (110) | 989 | Cayman Islands, Cuba, Southeast United States, Midwest United States | 11.8 | 1 | |||
| Bret | June 28 – 30 | Tropical storm | 40 (65) | 1002 | Central Mexico | 9.3 | 1 | |||
| Cindy | July 3 – 7 | Category 1 hurricane | 75 (120) | 991 | Yucatan Peninsula, Southeastern US, East Coast of the United States | 320 | 1 (4) | |||
| Dennis | July 4 – 13 | Category 4 hurricane | 150 (240) | 930 | Windward Islands, Greater Antilles, Southeastern US, Great Lakes Region | 3,710 | 76 (12) | |||
| Emily | July 11 – 21 | Category 5 hurricane | 160 (260) | 929 | Lesser Antilles, Greater Antilles, South America, Yucatan Peninsula, Mexico, Texas | 1,014 | 17 | |||
| Franklin | July 21 – 29 | Tropical storm | 70 (110) | 997 | Bahamas, Bermuda, Newfoundland | None | None | |||
| Gert | July 23 – 25 | Tropical storm | 45 (75) | 1005 | Central Mexico | 6 | 1 | |||
| Harvey | August 2 – 8 | Tropical storm | 65 (100) | 994 | Bermuda | None | None | |||
| Irene | August 4 – 18 | Category 2 hurricane | 105 (165) | 970 | East Coast of the US | None | 1 | |||
| Ten | August 13 – 14 | Tropical depression | 35 (55) | 1008 | None | None | None | |||
| Jose | August 22 – 23 | Tropical storm | 60 (95) | 998 | Central Mexico | 45 | 6 (2) | |||
| Katrina | August 23 – 30 | Category 5 hurricane | 175 (280) | 902 | Bahamas, South Florida, Cuba, Southeastern US, Eastern US | 108,000 | 1,836 | |||
| Lee | August 28 – September 2 | Tropical storm | 40 (65) | 1006 | None | None | None | |||
| Maria | September 1 – 10 | Category 3 hurricane | 115 (185) | 962 | Iceland, Scotland | 3.1 | 1 (3) | |||
| Nate | September 5 – 10 | Category 1 hurricane | 90 (150) | 979 | Bermuda, Azores | None | 2 | |||
| Ophelia | September 6 – 17 | Category 1 hurricane | 85 (140) | 976 | Bahamas, Florida, The Carolinas, East Coast of the US, Atlantic Canada, Europe | 70 | 1 (2) | |||
| Philippe | September 17 – 23 | Category 1 hurricane | 80 (130) | 985 | Bermuda | Minimal | None | |||
| Rita | September 18 – 26 | Category 5 hurricane | 180 (285) | 895 | Hispaniola, Bahamas, Cuba, Florida, Gulf Coast of the United States, Midwestern United States | 12,000 | 125 | |||
| Nineteen | September 30 – October 2 | Tropical depression | 35 (55) | 1006 | None | None | None | |||
| Stan | October 1 – 5 | Category 1 hurricane | 80 (130) | 977 | Central America, Mexico | 3,900 | 1,668 | |||
| Unnamed | October 4 – 5 | Subtropical storm | 50 (85) | 997 | Azores | None | None | |||
| Tammy | October 5 – 6 | Tropical storm | 50 (85) | 1001 | Bahamas, Southeastern US | 30 | 10 | |||
| Twenty-two | October 8 – 10 | Subtropical depression | 35 (55) | 1008 | Bermuda, New England | Minimal | 10 | |||
| Vince | October 8 – 11 | Category 1 hurricane | 75 (120) | 988 | Portugal, Spain | Minimal | None | |||
| Wilma | October 15 – 26 | Category 5 hurricane | 185 (295) | 882 | Bahamas, Jamaica, Central America, Yucatan Peninsula, Cuba, South Florida, Bahamas, Atlantic Canada | 29,400 | 87 | |||
| Alpha | October 22 – 24 | Tropical storm | 50 (85) | 998 | Hispaniola, Bahamas | Unknown | 26 | |||
| Beta | October 26 – 31 | Category 3 hurricane | 115 (185) | 962 | Central America, Colombia | 15.5 | 9 | |||
| Gamma | November 14 – 21 | Tropical storm | 50 (85) | 1002 | Lesser Antilles, Central America | 18 | 39 | |||
| Delta | November 22 – 28 | Tropical storm | 70 (110) | 980 | Canary Islands, North Africa | 364 | 19 | |||
| Epsilon | November 29 – December 8 | Category 1 hurricane | 85 (140) | 981 | None | None | None | |||
| Zeta | December 30 – January 6 | Tropical storm | 65 (100) | 994 | None | None | None | |||
| Season Aggregates | ||||||||||
| 31 cyclones | June 8, 2005 – January 6, 2006 | 185 (295) | 882 | 158,916.7 | 3,960 | |||||
See also
- List of Atlantic hurricanes
- List of Atlantic hurricane seasons
- 2005 Pacific hurricane season
- 2005 Pacific typhoon season
- 2005 North Indian Ocean cyclone season
- South-West Indian Ocean cyclone seasons: 2004–05, 2005–06
- Australian region cyclone seasons: 2004–05, 2005–06
- South Pacific cyclone seasons: 2004–05, 2005–06
Notes
- ↑ There is an undercount bias of zero to six tropical cyclones per year between 1851 and 1885 and zero to four per year between 1886 and 1910, due to the lack of modern observation techniques, see Tropical cyclone observation. This may have led to significantly lower ACE ratings for hurricane seasons prior to 1910.[58][59]
References
- 1 2 William M. Gray; Philip J. Klotzbach (December 3, 2004). "Extended Range Forecast of Atlantic Seasonal Hurricane Activity and US Landfall Strike Probability for 2005". Colorado State University. Archived from the original on March 7, 2006. Retrieved February 15, 2006.
- ↑ NOAA (April 13, 2006). "NOAA Reviews Record-Setting 2005 Atlantic Hurricane Season". National Oceanic and Atmospheric Administration. Archived from the original on April 23, 2006. Retrieved April 26, 2006.
- ↑ William M. Gray; Philip J. Klotzbach (April 1, 2005). "Extended Range Forecast of Atlantic Seasonal Hurricane Activity and US Landfall Strike Probability for 2005". Colorado State University. Archived from the original on February 10, 2006. Retrieved February 15, 2006.
- ↑ NOAA (May 16, 2005). "NOAA: 2005 Atlantic Hurricane Outlook". NOAA. Retrieved May 1, 2006.
- ↑ William M. Gray; Philip J. Klotzbach (May 31, 2005). "Extended Range Forecast of Atlantic Seasonal Hurricane Activity and US Landfall Strike Probability for 2005". Colorado State University. Archived from the original on February 7, 2006. Retrieved February 15, 2006.
- ↑ NOAA (August 2, 2005). "NOAA Raises the 2005 Atlantic Hurricane Season Outlook". NOAA. Archived from the original on February 8, 2006. Retrieved February 15, 2006.
- ↑ William M. Gray; Philip J. Klotzbach (August 5, 2005). "Extended Range Forecast of Atlantic Seasonal Hurricane Activity, Individual Monthly Activity, and US Landfall Strike Probability for 2005". Colorado State University. Archived from the original on February 11, 2006. Retrieved February 15, 2006.
- ↑ National Climatic Data Center (November 1, 2007). "NCDC: Atlantic Ocean 2005 Tropical Cyclones". National Climatic Data Center. Retrieved July 24, 2008.
- 1 2 3 Lixion A. Avila; Daniel P. Brown (July 20, 2005). "Tropical Cyclone Report: Tropical Storm Arlene" (PDF). National Hurricane Center. Retrieved January 28, 2011.
- ↑ "Tropical Storm Arlene HPC Advisory Archive". Hydrometeorological Prediction Center. 2005. Retrieved January 28, 2011.
- ↑ Richard J. Pasch (January 23, 2006). "Tropical Cyclone Report: Tropical Storm Bret" (PDF). National Hurricane Center. Retrieved January 28, 2011.
- 1 2 Stacy R. Stewart. "Tropical Cyclone Report: Hurricane Cindy" (PDF). National Hurricane Center. Retrieved January 28, 2011.
- ↑ Hydrometeorological Prediction Center (February 14, 2006). "Hurricane Cindy HPC Advisory Archive". Hydrometeorological Prediction Center. Retrieved January 28, 2011.
- 1 2 3 4 5 6 Jack Beven (November 22, 2005). "Tropical Cyclone Report: Hurricane Dennis" (PDF). National Hurricane Center. Archived (PDF) from the original on 2 January 2011. Retrieved January 28, 2011.
- ↑ "Hurricane Dennis HPC Advisory Archive". Hydrometeorological Prediction Center. 2005. Retrieved January 28, 2011.
- 1 2 James L. Franklin; Daniel P. Brown (March 10, 2006). "Tropical Cyclone Report: Hurricane Emily" (PDF). National Hurricane Center. Retrieved January 28, 2011.
- ↑ Richard D. Knabb (March 17, 2006). "Tropical Cyclone Report: Tropical Storm Franklin" (PDF). National Hurricane Center. Retrieved January 28, 2011.
- ↑ Lixion A. Avila (August 10, 2005). "Tropical Cyclone Report: Tropical Storm Gert" (PDF). National Hurricane Center. Archived (PDF) from the original on 22 December 2010. Retrieved January 28, 2011.
- ↑ Richard D. Knabb (March 17, 2006). "Tropical Cyclone Report: Tropical Storm Harvey" (PDF). National Hurricane Center. Retrieved January 28, 2011.
- ↑ Stacy R. Stewart (January 20, 2006). "Tropical Cyclone Report: Hurricane Irene" (PDF). National Hurricane Center. Retrieved January 28, 2011.
- ↑ Jack Beven (January 17, 2006). "Tropical Cyclone Report: Tropical Depression Ten" (PDF). National Hurricane Center. Retrieved January 28, 2011.
- 1 2 James L. Franklin (January 13, 2006). "Tropical Cyclone Report: Tropical Storm Jose" (PDF). National Hurricane Center. Retrieved January 28, 2011.
- ↑ Fuente: El Universal (2005). "Estiman daños en Veracruz por 500 millones de pesos". Teorema Ambiental. Archived from the original on September 30, 2007. Retrieved January 28, 2011.
- 1 2 3 Richard D. Knabb; Jamie R. Rhome; Daniel P. Brown (August 10, 2006). "Tropical Cyclone Report: Hurricane Katrina" (PDF). National Hurricane Center. Archived (PDF) from the original on 2 January 2011. Retrieved January 28, 2011.
- ↑ Hydrometeorological Prediction Center (2005). "Hurricane Katrina HPC Advisory Archive". Hydrometeorological Prediction Center. Retrieved January 28, 2011.
- ↑ Lixion A. Avila (December 7, 2005). "Tropical Cyclone Report: Tropical Storm Lee" (PDF). National Hurricane Center. Retrieved January 28, 2011.
- ↑ Richard J. Pasch; Eric S. Blake (February 8, 2006). "Tropical Cyclone Report: Hurricane Maria" (PDF). National Hurricane Center. Retrieved January 28, 2011.
- ↑ Stacy R. Stewart (November 29, 2005). "Tropical Cyclone Report: Hurricane Nate" (PDF). National Hurricane Center. Retrieved January 28, 2011.
- 1 2 Beven, John L; Cobb Hugh D.; National Hurricane Center (2006-01-24). Hurricane Ophelia (PDF) (Tropical Cyclone Report). United States National Oceanic and Atmospheric Administration's National Weather Service. Retrieved 2012-06-13.
- ↑ Franklin, James L; National Hurricane Center (February 9, 2006). Hurricane Philippe (PDF) (Tropical Cyclone Report). United States National Oceanic and Atmospheric Administration's National Weather Service. Retrieved 2012-06-13.
- 1 2 Richard D. Knabb; Daniel P. Brown; Jamie R. Rhome (August 14, 2006). "Tropical Cyclone Report: Hurricane Rita" (PDF). National Hurricane Center. Archived (PDF) from the original on 2 January 2011. Retrieved January 28, 2011.
- ↑ "Hurricane Rita HPC Advisory Archive". Hydrometeorological Prediction Center. 2005. Retrieved January 28, 2011.
- ↑ Lixion A. Avila (January 1, 2006). "Tropical Cyclone Report: Tropical Depression Nineteen" (PDF). National Hurricane Center. Retrieved January 28, 2011.
- 1 2 Richard J. Pasch; David P. Roberts (February 14, 2006). "Tropical Cyclone Report: Hurricane Stan" (PDF). National Hurricane Center. Retrieved January 28, 2011.
- ↑ Jack Beven; Eric S. Blake (April 10, 2006). "Tropical Cyclone Report: Unnamed Subtropical Storm" (PDF). National Hurricane Center. Retrieved January 28, 2011.
- ↑ Stacy R. Stewart (January 28, 2006). "Tropical Cyclone Report: Tropical Storm Tammy" (PDF). National Hurricane Center. Retrieved January 28, 2011.
- ↑ "Tropical Storm Tammy HPC Advisory Archive". Hydrometeorological Prediction Center. 2005. Retrieved January 28, 2011.
- 1 2 Jack Beven (January 17, 2006). "Tropical Cyclone Report: Subtropical Depression Twenty-Two" (PDF). National Hurricane Center. Retrieved January 28, 2011.
- 1 2 James L. Franklin (February 22, 2006). "Tropical Cyclone Report: Hurricane Vince" (PDF). National Hurricane Center. Retrieved January 28, 2011.
- 1 2 3 Richard J. Pasch; Eric S. Blake; Hugh D. Cobb III; David P. Roberts (September 28, 2006). "Tropical Cyclone Report: Hurricane Wilma" (PDF). National Hurricane Center. Archived (PDF) from the original on 2 January 2011. Retrieved January 28, 2011.
- ↑ Lixion A. Avila (January 4, 2006). "Tropical Cyclone Report: Tropical Storm Alpha" (PDF). National Hurricane Center. Retrieved January 28, 2011.
- 1 2 Richard J. Pasch; David P. Roberts (March 28, 2006). "Tropical Cyclone Report: Hurricane Beta" (PDF). National Hurricane Center. Retrieved January 28, 2011.
- ↑ Stacy R. Stewart (November 24, 2005). "Tropical Cyclone Report: Tropical Storm Gamma" (PDF). National Hurricane Center. Retrieved January 28, 2011.
- ↑ Jack Beven (February 14, 2006). "Tropical Cyclone Report: Tropical Storm Delta" (PDF). National Hurricane Center. Retrieved January 28, 2011.
- 1 2 James L. Franklin (January 7, 2006). "Tropical Cyclone Report: Hurricane Epsilon" (PDF). National Hurricane Center. Retrieved January 28, 2011.
- 1 2 Richard D. Knabb; Daniel P. Brown (March 17, 2006). "Tropical Cyclone Report: Tropical Storm Zeta" (PDF). National Hurricane Center. Retrieved January 28, 2011.
- 1 2 3 4 5 Beven, John L.; Avila, Lixion A.; Blake, Eric S.; Brown, Daniel P.; Franklin, James L.; Knabb, Richard D.; Pasch, Richard J.; Rhome, Jamie R.; Stewart, Stacy R. (March 2008). "Atlantic Hurricane Season of 2005". Monthly Weather Review. 136 (3): 1109–1173. Bibcode:2008MWRv..136.1109B. doi:10.1175/2007MWR2074.1.
- ↑ Christopher Landsea (2005). "AOML Frequently Asked Questions, E12". National Oceanic and Atmospheric Administration. Archived from the original on April 22, 2006. Retrieved April 3, 2006.
- ↑ United States Department of Commerce (June 2006). "Hurricane Katrina Service Assessment Report" (PDF). Archived (PDF) from the original on July 23, 2006. Retrieved July 14, 2006.
- ↑ National Climatic Data Center, National Hurricane Center (August 10, 2011). "The deadliest, costliest and most intense United States tropical cyclones from 1851 to 2010 (and other frequently requested hurricane facts)" (PDF). National Oceanic and Atmospheric Administration. p. 47. Retrieved August 10, 2011.
- ↑ National Hurricane Center (2006). "Hurricane History: Hurricane Wilma 2005". National Oceanic and Atmospheric Administration. Archived from the original on July 9, 2006. Retrieved August 7, 2006.
- ↑ United States Congress (February 19, 2006). A Failure of Initiative: Final Report of the Select Bipartisan Committee to Investigate the Preparation for and Response to Hurricane Katrina (PDF). Washington, DC: Government Printing Office. Retrieved August 13, 2011.
- ↑ Masters, Jeff (2005). "Wilma strengthens, heads out to sea". Retrieved April 3, 2006.
- ↑ National Oceanic and Atmospheric Administration (2005). "Noteworthy Records of the 2005 Atlantic Hurricane Season". National Oceanic and Atmospheric Administration. Retrieved April 3, 2006.
- ↑ Chris Landsea (2005). "AOML Frequently Asked Questions, E11". National Oceanic and Atmospheric Administration. Archived from the original on April 22, 2006. Retrieved April 3, 2006.
- ↑ Hurricane Research Division (April 2012). "Atlantic basin Comparison of Original and Revised HURDAT". National Oceanic and Atmospheric Administration. Retrieved May 7, 2012.
- ↑ David Levinson (August 20, 2008). "2005 Atlantic Ocean Tropical Cyclones". National Climatic Data Center. Retrieved July 23, 2011.
- ↑ Chris Landsea, Hurricane Research Division (2010-05-08). "Subject: E11) How many tropical cyclones have there been each year in the Atlantic basin? What years were the greatest and fewest seen?". National Oceanic and Atmospheric Administration. Retrieved 2011-01-03.
- ↑ Chris Landsea, Hurricane Research Division (2014-03-26). "HURDAT Re-analysis Original vs. Revised HURDAT". NOAA. Retrieved 2014-03-27.
- ↑ National Oceanic and Atmospheric Administration (2006). "Dennis, Katrina, Rita, Stan and Wilma "Retired" From List Of Storm Names". Archived from the original on April 7, 2006. Retrieved April 6, 2006.
- ↑ "RA IV Hurricane Committee Twenty-Eighth Session: Final Report" (PDF). World Meteorological Organization. March 30 – April 4, 2006. Retrieved September 1, 2016. Storms named with Greek letters that would otherwise be eligible for retirement would appear in the retired name list, but have a notation affixed with the circumstances.
- ↑ "Retired Hurricane Names Since 1954". National Hurricane Center. March 16, 2011. Archived from the original on June 28, 2011. Retrieved July 22, 2011.
Further reading
- Horton, Benjamin P.; Rossi, Veronica; Hawkes, Andrea D. (2009). "The sedimentary record of the 2005 hurricane season from the Mississippi and Alabama coastlines". Quaternary International. 195 (1–2): 15–30. Bibcode:2009QuInt.195...15H. doi:10.1016/j.quaint.2008.03.004.
External links

| Wikinews has news related to: |
| Wikimedia Commons has media related to 2005 Atlantic hurricane season. |
- National Hurricane Center
- NCDC: Climate of 2005: Atlantic Hurricane Season Summary
- NHC preliminary summary of 2005 wind speeds and deaths
- National Hurricane Center's 2005 Archive
- Weather Prediction Center's 2005 Advisory Archive
- U.S. Rainfall from Tropical Cyclones in 2005
- U.S. National Climatic Data Center – Atlantic Basin 2005 Accumulated Cyclone Energy (ACE) Index
- Flash Hurricane Tracker – track active and archived hurricanes.
- Unisys' 2005 Season Page – includes map of paths of all storms
- 27 Storms: Arlene to Zeta (SVS Animation 3354) – animation of all the tropical storms of the season, omitting the unnamed subtropical storm (NASA/Goddard Space Flight Center Scientific Visualization Studio)
- FLHurricane.com 2005 data – includes GoogleMaps tracking
- Storm Watch | Tableau Public
Tropical cyclones of the 2005 Atlantic hurricane season | ||
|---|---|---|
| ||
| ||