Atmospheric pressure
| Continuum mechanics | ||||
|---|---|---|---|---|
 | ||||
|
Laws
|
||||
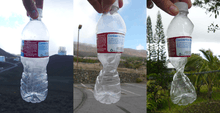
Atmospheric pressure, sometimes also called barometric pressure, is the pressure exerted by the weight of air in the atmosphere of Earth (or that of another planet). In most circumstances atmospheric pressure is closely approximated by the hydrostatic pressure caused by the weight of air above the measurement point. Low-pressure areas have less atmospheric mass above their location, whereas high-pressure areas have more atmospheric mass above their location. Likewise, as elevation increases, there is less overlying atmospheric mass, so that atmospheric pressure decreases with increasing elevation. On average, a column of air one square centimetre [cm2] (0.16 sq in) in cross-section, measured from sea level to the top of the atmosphere, has a mass of about 1.03 kilograms (2.3 lb) and weight of about 10.1 newtons (2.3 lbf). That force (across one square centimeter) is a pressure of 10.1 N/cm2 or 101,000 N/m2. A column 1 square inch (6.5 cm2) in cross-section would have a weight of about 14.7 lb (6.7 kg) or about 65.4 N.
Standard atmospheric
The standard atmosphere (symbol: atm) is a unit of pressure defined as 101325 Pa (1.01325 bar), equivalent to 760 mmHg (torr), 29.92 inHg and 14.696 psi.[1]
Mean sea level pressure
The mean sea level pressure (MSLP) is the atmospheric pressure at sea level. This is the atmospheric pressure normally given in weather reports on radio, television, and newspapers or on the Internet. When barometers in the home are set to match the local weather reports, they measure pressure adjusted to sea level, not the actual local atmospheric pressure.
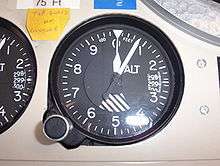
The altimeter setting in aviation, is an atmospheric pressure adjustment.
Average sea-level pressure is 1013.25 mbar (101.325 kPa; 29.921 inHg; 760.00 mmHg). In aviation weather reports (METAR), QNH is transmitted around the world in millibars or hectopascals (1 hectopascal = 1 millibar), except in the United States, Canada, and Colombia where it is reported in inches (to two decimal places) of mercury. The United States and Canada also report sea level pressure SLP, which is adjusted to sea level by a different method, in the remarks section, not in the internationally transmitted part of the code, in hectopascals or millibars.[2] However, in Canada's public weather reports, sea level pressure is instead reported in kilopascals.[3]
In the US weather code remarks, three digits are all that are transmitted; decimal points and the one or two most significant digits are omitted: 1013.2 mbar (101.32 kPa) is transmitted as 132; 1000.0 mbar (100.00 kPa) is transmitted as 000; 998.7 mbar is transmitted as 987; etc. The highest sea-level pressure on Earth occurs in Siberia, where the Siberian High often attains a sea-level pressure above 1050 mbar (105 kPa; 31 inHg), with record highs close to 1085 mbar (108.5 kPa; 32.0 inHg). The lowest measurable sea-level pressure is found at the centers of tropical cyclones and tornadoes, with a record low of 870 mbar (87 kPa; 26 inHg) (see Atmospheric pressure records).
Altitude variation


Pressure varies smoothly from the Earth's surface to the top of the mesosphere. Although the pressure changes with the weather, NASA has averaged the conditions for all parts of the earth year-round. As altitude increases, atmospheric pressure decreases. One can calculate the atmospheric pressure at a given altitude.[4] Temperature and humidity also affect the atmospheric pressure, and it is necessary to know these to compute an accurate figure. The graph at right was developed for a temperature of 15 °C and a relative humidity of 0%.
At low altitudes above the sea level, the pressure decreases by about 1.2 kPa for every 100 meters. For higher altitudes within the troposphere, the following equation (the barometric formula) relates atmospheric pressure p to altitude h


where the constant parameters are as described below:
| Parameter | Description | Value |
|---|---|---|
| p0 | sea level standard atmospheric pressure | 101325 Pa |
| L | temperature lapse rate, = g/cp for dry air | 0.0065 K/m |
| cp | constant pressure specific heat | ~ 1007 J/(kg•K) |
| T0 | sea level standard temperature | 288.15 K |
| g | Earth-surface gravitational acceleration | 9.80665 m/s2 |
| M | molar mass of dry air | 0.0289644 kg/mol |
| R0 | universal gas constant | 8.31447 J/(mol•K) |
Local variation

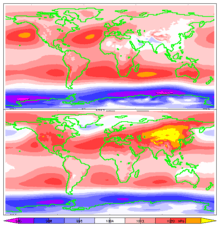
Atmospheric pressure varies widely on Earth, and these changes are important in studying weather and climate. See pressure system for the effects of air pressure variations on weather.
Atmospheric pressure shows a diurnal or semidiurnal (twice-daily) cycle caused by global atmospheric tides. This effect is strongest in tropical zones, with an amplitude of a few millibars, and almost zero in polar areas. These variations have two superimposed cycles, a circadian (24 h) cycle and semi-circadian (12 h) cycle.
Records
The highest adjusted-to-sea level barometric pressure ever recorded on Earth (above 750 meters) was 1,085.7 hectopascals (32.06 inHg) measured in Tosontsengel, Mongolia on 19 December 2001.[5] The highest adjusted-to-sea level barometric pressure ever recorded (below 750 meters) was at Agata, Evenkiyskiy, Russia [66°53’N, 93°28’E, elevation: 261 m (856.3 ft)] on 31 December 1968 of 1,083.8 hectopascals (32.00 inHg).[6] The discrimination is due to the problematic assumptions (assuming a standard lapse rate) associated with reduction of sea level from high elevations.[5]
The Dead Sea, the lowest place on Earth at 425 metres (1400 feet) below sea level, has a correspondingly high typical atmospheric pressure of 1065 hPa.[7]
The lowest non-tornadic atmospheric pressure ever measured was 0.858 atm (25.69 inHg), 870 hPa, set on 12 October 1979, during Typhoon Tip in the western Pacific Ocean. The measurement was based on an instrumental observation made from a reconnaissance aircraft.[8]
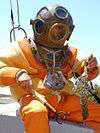
Measurement based on depth of water
One atmosphere (101 kPa or 14.7 psi) is the pressure caused by the weight of a column of fresh water of approximately 10.3 m (33.8 ft). Thus, a diver 10.3 m underwater experiences a pressure of about 2 atmospheres (1 atm of air plus 1 atm of water). Conversely, 10.3 m is the maximum height to which water can be raised using suction under standard atmospheric conditions.
Low pressures such as natural gas lines are sometimes specified in inches of water, typically written as w.c. (water column) or w.g. (inches water gauge). A typical gas-using residential appliance in the US is rated for a maximum of 14 w.c., which is approximately 35 hPa. Similar metric units with a wide variety of names and notation based on millimetres, centimetres or metres are now less commonly used.
Boiling point of water
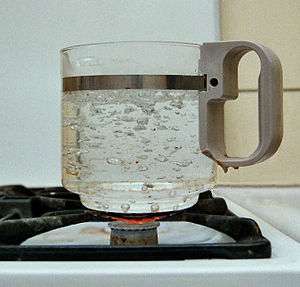
Clean fresh water boils at about 100 °C (212 °F) at earth's standard atmospheric pressure. The boiling point is the temperature at which the vapor pressure is equal to the atmospheric pressure around the water.[9] Because of this, the boiling point of water is lower at lower pressure and higher at higher pressure. This is why cooking at high elevations requires adjustments to recipes.[10] A rough approximation of elevation can be obtained by measuring the temperature at which water boils; in the mid-19th century, this method was used by explorers.[11]
Measurement and maps
An important application of the knowledge that atmospheric pressure varies directly with altitude was in determining the height of hills and mountains thanks to the availability of reliable pressure measurement devices. While in 1774 Maskelyne was confirming Newton's theory of gravitation at and on Schiehallion in Scotland (using plumb bob deviation to show the effect of "gravity") and accurately measure elevation, William Roy using barometric pressure was able to confirm his height determinations, the agreement being to within one meter (3.28 feet). This was then a useful tool for survey work and map making and long has continued to be useful. It was part of the "application of science" which gave practical people the insight that applied science could easily and relatively cheaply be "useful".[12]
See also
- Atmosphere (unit)
- Barometric formula
- Barotrauma – physical damage to body tissues caused by a difference in pressure between an air space inside or beside the body and the surrounding gas or liquid.
- Cabin pressurization
- Effects of high altitude on humans
- High-pressure area
- International Standard Atmosphere - a tabulation of typical variation of principal thermodynamic variables of the atmosphere (pressure, density, temperature, etc.) with altitude, at middle latitudes.
- Low-pressure area
- NRLMSISE-00
- Plenum chamber
- Pressure
- Subtropical high belts
References
- ↑ International Civil Aviation Organization. Manual of the ICAO Standard Atmosphere, Doc 7488-CD, Third Edition, 1993. ISBN 92-9194-004-6.
- ↑ Sample METAR of CYVR Nav Canada
- ↑ Montreal Current Weather, CBC Montreal, Canada, retrieved 2014-03-30
- ↑ A quick derivation relating altitude to air pressure by Portland State Aerospace Society, 2004, accessed 05032011
- 1 2 World: Highest Sea Level Air Pressure Above 750 m, Wmo.asu.edu, 2001-12-19, retrieved 2013-04-15
- ↑ World: Highest Sea Level Air Pressure Below 750 m, Wmo.asu.edu, 1968-12-31, retrieved 2013-04-15
- ↑ Kramer, MR; Springer C; Berkman N; Glazer M; Bublil M; Bar-Yishay E; Godfrey S (March 1998). "Rehabilitation of hypoxemic patients with COPD at low altitude at the Dead Sea, the lowest place on earth" (PDF). Chest. 113 (3): 571–575. doi:10.1378/chest.113.3.571. PMID 9515826.
PMID 9515826
- ↑ Chris Landsea (2010-04-21). "Subject: E1), Which is the most intense tropical cyclone on record?". Atlantic Oceanographic and Meteorological Laboratory. Archived from the original on 6 December 2010. Retrieved 2010-11-23.
- ↑ Vapour Pressure, Hyperphysics.phy-astr.gsu.edu, retrieved 2012-10-17
- ↑ High Altitude Cooking, Crisco.com, 2010-09-30, retrieved 2012-10-17
- ↑ Berberan-Santos, M. N.; Bodunov, E. N.; Pogliani, L. (1997). "On the barometric formula". American Journal of Physics. 65 (5): 404–412. Bibcode:1997AmJPh..65..404B. doi:10.1119/1.18555
- ↑ Hewitt, Rachel, Map of a Nation – a Biography of the Ordnance Survey ISBN 1-84708-098-7
External links
- How Atmospheric Pressure Affects Objects (Audio slideshow from the National High Magnetic Field Laboratory)
- 1976 Standard Atmosphere from NASA
- Source code and equations for the 1976 Standard Atmosphere
- A mathematical model of the 1976 U.S. Standard Atmosphere
- Calculator using multiple units and properties for the 1976 Standard Atmosphere
- Calculator giving standard air pressure at a specified altitude, or altitude at which a pressure would be standard
- Some of the effects of air pressure
- Atmospheric calculator and Geometric to Pressure altitude converter
Experiments
- Movies on atmospheric pressure experiments from Georgia State University's HyperPhysics website – requires QuickTime
- Test showing a can being crushed after boiling water inside it, then moving it into a tub of ice cold water.