Bethnal Green North East (UK Parliament constituency)
| Bethnal Green North East | |
|---|---|
|
Former Borough constituency for the House of Commons | |
| 1885–1950 | |
| Number of members | one |
| Replaced by | Bethnal Green |
| Created from | Hackney |
Bethnal Green North East was a parliamentary constituency in London, which returned one Member of Parliament to the House of Commons of the Parliament of the United Kingdom. It was created for the 1885 general election and abolished for the 1950 general election.
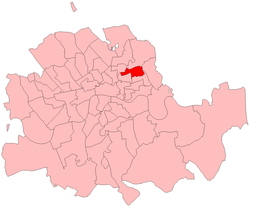
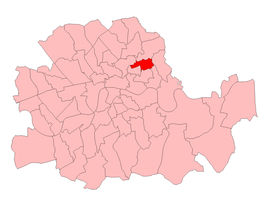
Boundaries
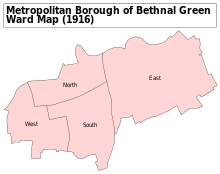
The constituency consisted of the north and east wards of the civil parish of Bethnal Green, Middlesex (later the Metropolitan Borough of Bethnal Green in the County of London).
Members of Parliament
| Year | Member | Whip | |
|---|---|---|---|
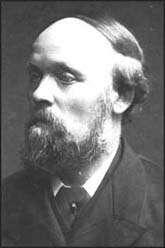
| 1885 | George Howell | Liberal | |
| 1895 | Sir Mancherjee Bhownagree | Conservative | |
| 1906 | Sir Edwin Cornwall | Liberal | |
| 1919 | Coalition Liberal | ||
| 1922 | Garnham Edmonds | Liberal | |
| 1923 | Walter Windsor | Labour | |
| 1929 | Harry Nathan | Liberal | |
| February 1933 a | Independent Liberal | ||
| June 1934 b | Labour | ||
| 1935 | Daniel Chater | Labour | |
| 1950 | constituency abolished - see Bethnal Green | ||
Notes:-
- a No election. Nathan resigned the Liberal whip.
- b No election. Nathan took the Labour whip.
Election results
Elections in the 1880s
| Party | Candidate | Votes | % | ± | |
|---|---|---|---|---|---|
| Lib-Lab | George Howell | 3,095 | 62.7 | n/a | |
| Conservative | John Dawson Mayne | 1,844 | 37.3 | n/a | |
| Majority | 1,251 | 25.4 | n/a | ||
| Turnout | 7,102 | 69.5 | n/a | ||
| Lib-Lab win | |||||
| Party | Candidate | Votes | % | ± | |
|---|---|---|---|---|---|
| Lib-Lab | George Howell | 2,278 | 54.4 | -8.3 | |
| Liberal Unionist | Edward John Stoneham | 1,906 | 45.6 | +8.3 | |
| Majority | 372 | 8.8 | -16.6 | ||
| Turnout | 7,102 | 58.9 | -10.6 | ||
| Lib-Lab hold | Swing | -8.3 | |||
Elections in the 1890s
| Party | Candidate | Votes | % | ± | |
|---|---|---|---|---|---|
| Lib-Lab | George Howell | 2,918 | 54.4 | 0.0 | |
| Conservative | Henry Hananel Marks | 2,321 | 43.2 | -2.4 | |
| Social Democratic Federation | Hugh Robert Taylor | 106 | 2.0 | n/a | |
| Independent | R. Ballard | 23 | 0.4 | n/a | |
| Majority | 597 | 11.2 | +2.4 | ||
| Turnout | 7,438 | 72.2 | +13.3 | ||
| Lib-Lab hold | Swing | +1.2 | |||
| Party | Candidate | Votes | % | ± | |
|---|---|---|---|---|---|
| Conservative | Mancherjee Merwanjee Bhownagree | 2,591 | 51.6 | +8.4 | |
| Lib-Lab | George Howell | 2,431 | 48.4 | 6.0 | |
| Majority | 160 | 3.2 | -14.4 | ||
| Turnout | 7,431 | 67.6 | -4.6 | ||
| Conservative gain from Lib-Lab | Swing | +7.2 | |||
Elections in the 1900s
| Party | Candidate | Votes | % | ± | |
|---|---|---|---|---|---|
| Conservative | Sir Mancherjee Merwanjee Bhownagree | 2,988 | 53.4 | +1.8 | |
| Liberal | Harry Lawson Webster Levy-Lawson | 2,609 | 46.6 | -1.8 | |
| Majority | 379 | 6.8 | +3.6 | ||
| Turnout | 8,012 | 69.9 | +2.3 | ||
| Conservative hold | Swing | +1.8 | |||
.jpg)
| Party | Candidate | Votes | % | ± | |
|---|---|---|---|---|---|
| Liberal | Sir Edwin Andrew Cornwall | 4,127 | 66.0 | +19.4 | |
| Conservative | Sir Mancherjee Merwanjee Bhownagree | 2,130 | 34.0 | -19.4 | |
| Majority | 1,997 | 32.0 | 38.8 | ||
| Turnout | 7,730 | 80.9 | +11.0 | ||
| Liberal gain from Conservative | Swing | +19.4 | |||
Elections in the 1910s
| Party | Candidate | Votes | % | ± | |
|---|---|---|---|---|---|
| Liberal | Sir Edwin Andrew Cornwall | 3,842 | 61.2 | -4.8 | |
| Conservative | John Elsdale Molson | 2,435 | 38.8 | +4.8 | |
| Majority | 1,407 | 22.4 | -9.6 | ||
| Turnout | 83.1 | +2.2 | |||
| Liberal hold | Swing | -4.8 | |||
| Party | Candidate | Votes | % | ± | |
|---|---|---|---|---|---|
| Liberal | Sir Edwin Andrew Cornwall | 3,188 | 61.0 | -0.2 | |
| Conservative | John Elsdale Molson | 2,037 | 39.0 | +0.2 | |
| Majority | 1,151 | 22.0 | -0.4 | ||
| Turnout | 69.2 | -13.9 | |||
| Liberal hold | Swing | -0.2 | |||
General Election 1914/15:
Another General Election was required to take place before the end of 1915. The political parties had been making preparations for an election to take place and by the July 1914, the following candidates had been selected;
- Liberal: Sir Edwin Andrew Cornwall
- Unionist:
| Party | Candidate | Votes | % | ± | |
|---|---|---|---|---|---|
| Liberal | 4,448 | 56.4 | -4.6 | ||
| National Party | Lieut. Wilfred Liddell Steel | 2,312 | 29.3 | n/a | |
| Independent | William Shadforth | 1,127 | 14.3 | n/a | |
| Majority | 2,136 | 27.1 | +5.1 | ||
| Turnout | 25,253 | 31.2 | |||
| Liberal hold | Swing | n/a | |||
- endorsed by the Coalition Government
Elections in the 1920s
| Party | Candidate | Votes | % | ± | |
|---|---|---|---|---|---|
| Liberal | Garnham Edmonds | 5,774 | 36.1 | -20.3 | |
| Communist | Walter Windsor | 5,659 | 35.3 | n/a | |
| Unionist | Eric Alfred Hoffgaard | 2,806 | 17.5 | n/a | |
| National Liberal | George Morgan Garro-Jones | 1,780 | 11.5 | n/a | |
| Majority | 115 | 0.8 | -26.3 | ||
| Turnout | 27,262 | 58.8 | +27.6 | ||
| Liberal hold | Swing | n/a | |||
| Party | Candidate | Votes | % | ± | |
|---|---|---|---|---|---|
| Labour | Walter Windsor | 7,415 | 45.7 | +12.4 | |
| Liberal | Garnham Edmonds | 6,790 | 41.8 | +5.7 | |
| Unionist | Robert Inigo Tasker | 2,035 | 12.5 | -5.0 | |
| Majority | 625 | 3.9 | 4.7 | ||
| Turnout | 27,468 | 59.1 | +0.3 | ||
| Labour gain from Liberal | Swing | +3.3 | |||
| Party | Candidate | Votes | % | ± | |
|---|---|---|---|---|---|
| Labour | Walter Windsor | 9,560 | 50.2 | +4.5 | |
| Liberal | Garnham Edmonds | 9,465 | 49.8 | +8.0 | |
| Majority | 95 | 0.4 | -3.5 | ||
| Turnout | 27,827 | 68.4 | +9.3 | ||
| Labour hold | Swing | -1.8 | |||
| Party | Candidate | Votes | % | ± | |
|---|---|---|---|---|---|
| Liberal | Harry Louis Nathan | 11,690 | 47.4 | -2.4 | |
| Labour | Walter Windsor | 11,101 | 44.9 | -5.3 | |
| Unionist | James Alan Bell | 1,908 | 7.7 | n/a | |
| Majority | 589 | 2.5 | 2.9 | ||
| Turnout | 34,453 | 71.7 | +3.3 | ||
| Liberal gain from Labour | Swing | +1.5 | |||
Elections in the 1930s
| Party | Candidate | Votes | % | ± | |
|---|---|---|---|---|---|
| Liberal | Harry Louis Nathan | 13,135 | 55.9 | +8.5 | |
| Labour | William Barratt | 10,368 | 44.1 | -0.8 | |
| Majority | 2,767 | 11.8 | +9.3 | ||
| Turnout | 34,377 | 68.4 | -3.3 | ||
| Liberal hold | Swing | +4.7 | |||
| Party | Candidate | Votes | % | ± | |
|---|---|---|---|---|---|
| Labour Co-op | Daniel Chater | 11,581 | 63.5 | +19.4 | |
| Liberal | Joseph Burton Hobman | 6,644 | 36.5 | -19.4 | |
| Majority | 4,937 | 27.0 | 38.6 | ||
| Turnout | 32,809 | 55.5 | -12.9 | ||
| Labour Co-op gain from Liberal | Swing | +19.4 | |||
Elections in the 1940s
General Election 1939/40
Another General Election was required to take place before the end of 1940. The political parties had been making preparations for an election to take place and by the Autumn of 1939, the following candidates had been selected;
- Labour: Daniel Chater[14]
- Liberal: Ormond Lewis[15]
| Party | Candidate | Votes | % | ± | |
|---|---|---|---|---|---|
| Labour Co-op | Daniel Chater | 7,696 | 59.9 | -3.6 | |
| Liberal | Paul Hervé Giraud Wright | 3,979 | 30.9 | -5.6 | |
| Conservative | Lord Buckhurst | 1,185 | 9.2 | n/a | |
| Majority | 3,717 | 29.0 | +2.0 | ||
| Turnout | 19,225 | 66.9 | +11.4 | ||
| Labour Co-op hold | Swing | +1.0 | |||
References
- ↑ British Parliamentary Election Results 1885-1918, FWS Craig
- ↑ British Parliamentary Election Results 1885-1918, FWS Craig
- ↑ British Parliamentary Election Results 1885-1918, FWS Craig
- ↑ British Parliamentary Election Results 1885-1918, FWS Craig
- ↑ British Parliamentary Election Results 1885-1918, FWS Craig
- ↑ British Parliamentary Election Results 1885-1918, FWS Craig
- ↑ British Parliamentary Election Results 1918-1949, FWS Craig
- ↑ British Parliamentary Election Results 1918-1949, FWS Craig
- ↑ British Parliamentary Election Results 1918-1949, FWS Craig
- ↑ British Parliamentary Election Results 1918-1949, FWS Craig
- ↑ British Parliamentary Election Results 1918-1949, FWS Craig
- ↑ British Parliamentary Election Results 1918-1949, FWS Craig
- ↑ British Parliamentary Election Results 1918-1949, FWS Craig
- ↑ Report of the Annual Conference of the Labour Party, 1939
- ↑ The Liberal Magazine, 1939
- ↑ British Parliamentary Election Results 1918-1949, FWS Craig