Bjerrum plot
A Bjerrum plot is a graph of the concentrations of the different species of a polyprotic acid in a solution, as functions of the solution's pH,[1] when the solution is at equilibrium. Due to the many orders of magnitude spanned by the concentrations, they are commonly plotted on a logarithmic scale. Sometimes the ratios of the concentrations are plotted rather than the actual concentrations. Occasionally H+ and OH− are also plotted.
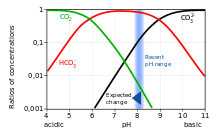
Most often, the carbonate system is plotted, where the polyprotic acid is carbonic acid (a diprotic acid), and the different species are carbonic acid, carbon dioxide, bicarbonate, and carbonate. In acidic conditions, the dominant form is CO2; in basic (alkalinic) conditions, the dominant form is CO32−; and in between, the dominant form is HCO3−. At every pH, the concentration of carbonic acid is assumed to be negligible compared to the concentration of CO2, and so is often omitted from Bjerrum plots. These plots are typically used in ocean chemistry to track the response of an ocean to changes in both pH and of inputs in carbonate and CO
2.[2]
The Bjerrum plots for other polyprotic acids, including silicic, boric, sulphuric and phosphoric acids, can also be constructed.[1]
Bjerrum plot equations for carbonate system
If carbon dioxide, carbonic acid, hydrogen ions, bicarbonate and carbonate are all dissolved in water, and at chemical equilibrium, their equilibrium concentrations are often assumed to be given by:
![[{\textrm {CO}}_{2}]_{{eq}}={\frac {[{\textrm {H}}^{+}]_{{eq}}^{2}}{[{\textrm {H}}^{+}]_{{eq}}^{2}+K_{1}[{\textrm {H}}^{+}]_{{eq}}+K_{1}K_{2}}}\times {\textrm {DIC}},](../I/m/5c64507f41a8e6cc124f36d34dc941c5ec97d447.svg)
![[{\textrm {HCO}}_{3}^{-}]_{{eq}}={\frac {K_{1}[{\textrm {H}}^{+}]_{{eq}}}{[{\textrm {H}}^{+}]_{{eq}}^{2}+K_{1}[{\textrm {H}}^{+}]_{{eq}}+K_{1}K_{2}}}\times {\textrm {DIC}},](../I/m/c69c378ff186a1351ef7c3b8518be7c0ee3c6387.svg)
![[{\textrm {CO}}_{3}^{{2-}}]_{{eq}}={\frac {K_{1}K_{2}}{[{\textrm {H}}^{+}]_{{eq}}^{2}+K_{1}[{\textrm {H}}^{+}]_{{eq}}+K_{1}K_{2}}}\times {\textrm {DIC}},](../I/m/77e886a8ee430a6964c2ad580a8675b151eb9dfb.svg)
where the subscript 'eq' denotes that these are equilibrium concentrations, K1 is the equilibrium constant for the reaction CO
2 + H
2O ⇌ H+ + HCO3− (i.e. the first acid dissociation constant for carbonic acid), K2 is the equilibrium constant for the reaction HCO3− ⇌ H+ + CO32− (i.e. the second acid dissociation constant for carbonic acid), and DIC is the (unchanging) total concentration of dissolved inorganic carbon in the system, i.e. [CO2] + [HCO3−] + [CO32−]. K1, K2 and DIC each have units of a concentration, e.g. mol/litre.
A Bjerrum plot is obtained by using these three equations to plot these three species against pH = –log10[H+]eq, for given K1, K2 and DIC. The fractions in these equations give the three species' relative proportions, and so if DIC is unknown, or the actual concentrations are unimportant, these proportions may be plotted instead.
These three equations show that the curves for CO2 and HCO3− intersect at [H+]eq = K1, and the curves for HCO3− and CO32− intersect at [H+]eq = K2. Therefore, the values of K1 and K2 that were used to create a given Bjerrum plot can easily be found from that plot, by reading off the concentrations at these points of intersection. An example with linear Y axis is shown in the accompanying graph. It should be noted that the values of K1 and K2, and therefore the curves in the Bjerrum plot, vary substantially with temperature and salinity.[3]
Chemical and mathematical derivation of Bjerrum plot equations for carbonate system
Suppose that the reactions between carbon dioxide, hydrogen ions, bicarbonate and carbonate ions, all dissolved in water, are as follows:
- CO
2 + H
2O ⇌ H+ + HCO3− (1) - HCO3− ⇌ H+ + CO32−. (2)
(Note that reaction (1) is actually the combination of two elementary reactions: CO
2 + H
2O ⇌ H
2CO
3 ⇌ H+ + HCO3−.)
Assuming the mass action law applies to these two reactions, that water is abundant, and that the different chemical species are always well-mixed, their rate equations are
![{\frac {{\textrm {d}}[{\textrm {CO}}_{2}]}{{\textrm {d}}t}}=-k_{1}[{\textrm {CO}}_{2}]+k_{{-1}}[{\textrm {H}}^{+}][{\textrm {HCO}}_{3}^{-}],](../I/m/6de134b2361770f97043336485841e9b71760ab0.svg)
![{\frac {{\textrm {d}}[{\textrm {H}}^{+}]}{{\textrm {d}}t}}=k_{1}[{\textrm {CO}}_{2}]-k_{{-1}}[{\textrm {H}}^{+}][{\textrm {HCO}}_{3}^{-}]+k_{2}[{\textrm {HCO}}_{3}^{-}]-k_{{-2}}[{\textrm {H}}^{+}][{\textrm {CO}}_{3}^{{2-}}],](../I/m/e14806de144e5fcf23f83fa45c0076f01aa8438e.svg)
![{\frac {{\textrm {d}}[{\textrm {HCO}}_{3}^{-}]}{{\textrm {d}}t}}=k_{1}[{\textrm {CO}}_{2}]-k_{{-1}}[{\textrm {H}}^{+}][{\textrm {HCO}}_{3}^{-}]-k_{2}[{\textrm {HCO}}_{3}^{-}]+k_{{-2}}[{\textrm {H}}^{+}][{\textrm {CO}}_{3}^{{2-}}],](../I/m/075781675b0f5e1a8e01f32cd7ce7298583aebcf.svg)
![{\frac {{\textrm {d}}[{\textrm {CO}}_{3}^{{2-}}]}{{\textrm {d}}t}}=k_{2}[{\textrm {HCO}}_{3}^{-}]-k_{{-2}}[{\textrm {H}}^{+}][{\textrm {CO}}_{3}^{{2-}}],](../I/m/88d34d5cd11198310bc9611e942e58228a519b8c.svg)
where [ ] denotes concentration, t is time, and k1 and k-1 are appropriate proportionality constants for reaction (1), called respectively the forwards and reverse rate constants for this reaction. (Similarly k2 and k-2 for reaction (2).)
At any equilibrium, the concentrations are unchanging, hence the left hand sides of these equations are zero. Then, from the first of these four equations, the ratio of reaction (1)'s rate constants equals the ratio of its equilibrium concentrations, and this ratio, called K1, is called the equilibrium constant for reaction (1), i.e.
- (3)
![K_{1}={\frac {k_{1}}{k_{{-1}}}}={\frac {[{\textrm {H}}^{+}]_{{eq}}[{\textrm {HCO}}_{3}^{-}]_{{eq}}}{[{\textrm {CO}}_{2}]_{{eq}}}},](../I/m/34a8bbf9e461643a80970e7c88bf90b606e1d20a.svg)
where the subscript 'eq' denotes that these are equilibrium concentrations.
Similarly, from the fourth equation for the equilibrium constant K2 for reaction (2),
- (4)
![K_{2}={\frac {k_{2}}{k_{{-2}}}}={\frac {[{\textrm {H}}^{+}]_{{eq}}[{\textrm {CO}}_{3}^{{2-}}]_{{eq}}}{[{\textrm {HCO}}_{3}^{-}]_{{eq}}}}.](../I/m/bbd12f7f452c8bc79923b48813a7d4fbbd08cc79.svg)
Rearranging (3) gives
- (5)
![[{\textrm {HCO}}_{3}^{-}]_{{eq}}={\frac {K_{1}[{\textrm {CO}}_{2}]_{{eq}}}{[{\textrm {H}}^{+}]_{{eq}}}},](../I/m/4c44829914c17f8790c48e2479f8446795da6f55.svg)
and rearranging (4), then substituting in (5), gives
- (6)
![[{\textrm {CO}}_{3}^{{2-}}]_{{eq}}={\frac {K_{2}[{\textrm {HCO}}_{3}^{-}]_{{eq}}}{[{\textrm {H}}^{+}]_{{eq}}}}={\frac {K_{1}K_{2}[{\textrm {CO}}_{2}]_{{eq}}}{[{\textrm {H}}^{+}]_{{eq}}^{2}}}.](../I/m/d79fa6859b32f926456d0aee3e455151b648768d.svg)
The total concentration of dissolved inorganic carbon in the system is given by
- substituting in (5) and (6)
![{\textrm {DIC}}=[{\textrm {CO}}_{2}]+[{\textrm {HCO}}_{3}^{-}]+[{\textrm {CO}}_{3}^{{2-}}]](../I/m/f1bbbc5a0e1e41f64eef87842b2a93da7ff5b6de.svg)
![=[{\textrm {CO}}_{2}]_{{eq}}\left(1+{\frac {K_{1}}{[{\textrm {H}}^{+}]_{{eq}}}}+{\frac {K_{1}K_{2}}{[{\textrm {H}}^{+}]_{{eq}}^{2}}}\right)](../I/m/8b284790aacdd68f00a7ff8e4ee2dab0c0a1eb1d.svg)
![=[{\textrm {CO}}_{2}]_{{eq}}\left({\frac {[{\textrm {H}}^{+}]_{{eq}}^{2}+K_{1}[{\textrm {H}}^{+}]_{{eq}}+K_{1}K_{2}}{[{\textrm {H}}^{+}]_{{eq}}^{2}}}\right).](../I/m/a63cc82397b76126c5364516eb688702a6ed6e54.svg)
Re-arranging this gives the equation for CO
2:
![[{\textrm {CO}}_{2}]_{{eq}}={\frac {[{\textrm {H}}^{+}]_{{eq}}^{2}}{[{\textrm {H}}^{+}]_{{eq}}^{2}+K_{1}[{\textrm {H}}^{+}]_{{eq}}+K_{1}K_{2}}}\times {\textrm {DIC}}.](../I/m/8e27f7abfe747c293e20cd24fc680b1f76087f28.svg)
The equations for HCO3− and CO32− are obtained by substituting this into (5) and (6).
See also
References
- 1 2 Andersen, C. B. (2002). "Understanding carbonate equilibria by measuring alkalinity in experimental and natural systems". Journal of Geoscience Education. 50 (4): 389–403.
- ↑ D.A. Wolf-Gladrow (2007). "Total alkalinity: the explicit conservative expression and its application to biogeochemical processes" (PDF). Marine Chemistry. 106 (1).
- ↑ Mook W (2000) Chemistry of carbonic acid in water. In 'Environmental Isotopes in the Hydrological Cycle: Principles and Applications' pp. 143-165. (INEA / UNESCO: Paris). Retrieved 30NOV2013.