Bristol City Council election, 1995
| | |||||||||||||||||||||||||||||||
| |||||||||||||||||||||||||||||||
| |||||||||||||||||||||||||||||||
| |||||||||||||||||||||||||||||||
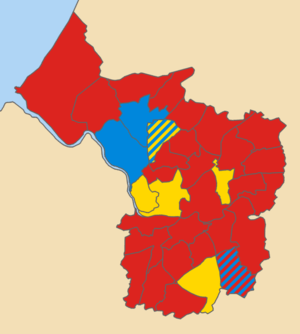
The 1995 Bristol City Council election took place on 4 May 1995 with all seats being up for election, in preparation for Bristol City Council becoming a Unitary Authority following the abolition of Avon County Council.[1] The same ward boundaries were used, however these are elections to a new authority and cannot be considered gains or losses compared to previously held seats.
The election saw national issues, such as the unpopularity of the national Conservative government and the state of the economy, being the major issues in the election. The Conservative candidates branded themselves as 'Bristol Conservatives', which was seen as an attempt to distance themselves from the national government.[1] The Labour Party was expected to win a large majority but they were criticised by the Conservatives for cutting money from the Scouts while giving money to a lesbian/bisexual women's group.[2]
Labour easily gained a majority and as predicted before the election the Liberal Democrats became the second largest party on the council driving the Conservatives down to third as compared to the previous district council.[1]
Election results
The party standings following the election:
| Party | Cllrs | % Vote | |
|---|---|---|---|
| Labour Party | 53 | 53.3 | |
| Liberal Democrats | 9 | 19.6 | |
| Conservative Party | 6 | 24.8 | |
| Total | 68 | 97.7 | |
Ward results
The change is calculated using the most recent election result in each ward, in most cases 1994, or otherwise 1992. Sebastian Matthews, who apparently stood as the "Macromedia Student" party, is possibly a nomination-paper error where 'Occupation' and 'Party' were swapped, c.f. Systems Designer.
| Party | Candidate | Votes | % | ± | |
|---|---|---|---|---|---|
| Labour | Nichola I. Barton | 1,763 | 62.9 | +2.4 | |
| Labour | Raymond J. Sefia | 1,472 | |||
| Green | David M. Simpson | 426 | 15.2 | +1.7 | |
| Liberal Democrat | John H. Bonham-Carter | 393 | 14.0 | -0.4 | |
| Liberal Democrat | Jane McGarry | 368 | |||
| Conservative | Kerrie Carpenter | 223 | 8.0 | -3.7 | |
| Conservative | Ian J. Henderson | 214 | |||
| Majority | 1,046 | 37.3 | |||
| Turnout | 31.8 | ||||
| Party | Candidate | Votes | % | ± | |
|---|---|---|---|---|---|
| Labour | Celia M. Lukins | 2,200 | 68.8 | +4.5 | |
| Labour | Ernie Bristow | 2,149 | |||
| Conservative | David L. Holme | 578 | 18.1 | -3.1 | |
| Liberal Democrat | Paul W. Lloyd | 419 | 13.1 | -1.4 | |
| Liberal Democrat | Pamela Henderson | 371 | |||
| Majority | 1,571 | 49.1 | |||
| Turnout | 41.8 | ||||
| Party | Candidate | Votes | % | ± | |
|---|---|---|---|---|---|
| Labour | Peter J. Crispin | 2,001 | 60.3 | +7.7 | |
| Labour | Claire M. Warren | 1,683 | |||
| Conservative | Jack LoPresti | 526 | 15.8 | -6.2 | |
| Liberal Democrat | Mary Sykes | 513 | 15.4 | -5.9 | |
| Conservative | Christian V.J. Simpson | 498 | |||
| Green | Charles N. Bolton | 281 | 8.5 | +4.4 | |
| Majority | 1,157 | 34.8 | |||
| Turnout | 34.9 | ||||
| Party | Candidate | Votes | % | ± | |
|---|---|---|---|---|---|
| Labour | Patricia M. McLaren | 2,115 | 50.5 | +7.6 | |
| Labour | Arthur Keefe | 2,064 | |||
| Liberal Democrat | David J.G. Kitson | 1,055 | 25.2 | -3.9 | |
| Liberal Democrat | Peter J. Maitland | 966 | |||
| Conservative | Ian E. Kealey | 718 | 17.2 | -1.3 | |
| Conservative | Pearl C.L. Abraham | 695 | |||
| Green | Justin M. Quinnell | 298 | 7.1 | +3.2 | |
| Majority | 1,009 | 24.1 | |||
| Turnout | 45.0 | ||||
| Party | Candidate | Votes | % | ± | |
|---|---|---|---|---|---|
| Labour | Terence Cleverley | 1,674 | 53.1 | +11.7 | |
| Labour | Paul C. Walker | 1,468 | |||
| Conservative | Richard S. Eddy | 1,138 | 36.1 | -13.3 | |
| Conservative | Michael J. Jarrett | 1,022 | |||
| Liberal Democrat | Nicholas L. Doddrell | 218 | 6.9 | +0.9 | |
| Green | Barrie R. Lewis | 124 | 3.9 | +0.7 | |
| Majority | 330 | 10.5 | |||
| Turnout | 40.8 | ||||
| Party | Candidate | Votes | % | ± | |
|---|---|---|---|---|---|
| Labour | William L. Martin | 2,357 | 64.1 | +21.2 | |
| Labour | Peter T.J. Begley | 2,297 | |||
| Conservative | Anthony R. Carey | 823 | 22.4 | -25.3 | |
| Conservative | Colin R. Bretherton | 761 | |||
| Liberal Democrat | Jeffery Exon | 495 | 13.5 | +6.5 | |
| Liberal Democrat | Linda Hopkins | 404 | |||
| Majority | 1,474 | 40.1 | |||
| Turnout | 39.9 | ||||
| Party | Candidate | Votes | % | ± | |
|---|---|---|---|---|---|
| Labour | Dan Norris | 1,905 | 48.3 | +18.9 | |
| Labour | Jane V. Painter | 1,859 | |||
| Liberal Democrat | Peter H. Main | 1,217 | 30.8 | +2.3 | |
| Liberal Democrat | Catherine F. Johnstone | 1,188 | |||
| Conservative | Holly Richmond | 656 | 16.6 | -21.7 | |
| Conservative | Ian D. Millard | 609 | |||
| Green | Mary B. Wood | 169 | 4.3 | +0.5 | |
| Majority | 642 | 16.3 | |||
| Turnout | 45.5 | ||||
| Party | Candidate | Votes | % | ± | |
|---|---|---|---|---|---|
| Liberal Democrat | Charles R. Boney | 1,395 | 41.4 | -5.8 | |
| Liberal Democrat | Stephen R. Williams | 1,264 | |||
| Labour | Paul A. Garland | 1,182 | 35.1 | +3.9 | |
| Labour | William J. Waines | 997 | |||
| Conservative | Ashley P. Fox | 518 | 15.4 | -1.3 | |
| Conservative | David J. Smith | 499 | |||
| Green | Rowan V. Beton | 277 | 8.2 | +3.2 | |
| Majority | 82 | 2.4 | |||
| Turnout | 34.8 | ||||
| Party | Candidate | Votes | % | ± | |
|---|---|---|---|---|---|
| Liberal Democrat | Barbara Janke | 1,574 | 40.5 | -6.7 | |
| Liberal Democrat | Brian H. Price | 1,554 | |||
| Conservative | John Bretten | 1,241 | 32.0 | -3.7 | |
| Conservative | Alan D. Tasker | 1,192 | |||
| Labour | Nicole A.M. Steven | 808 | 20.8 | +7.3 | |
| Labour | Denton W. Brockway | 807 | |||
| Green | Lucinda Hersey | 259 | 6.7 | +3.1 | |
| Majority | 313 | 8.1 | |||
| Turnout | 39.5 | ||||
| Party | Candidate | Votes | % | ± | |
|---|---|---|---|---|---|
| Labour | Shelley M. Lanchbury | 1,609 | 46.1 | +6.8 | |
| Labour | Fabian G. Breckels | 1,584 | |||
| Conservative | Philip A. Cobbold | 899 | 25.7 | -3.9 | |
| Conservative | Anthony M.B. Orr | 884 | |||
| Liberal Democrat | Michael C. Bosel | 727 | 20.8 | -5.9 | |
| Liberal Democrat | Gizella K. Hughes | 717 | |||
| Green | Geoff Collard | 258 | 7.4 | +3.0 | |
| Majority | 685 | 19.6 | |||
| Turnout | 38.3 | ||||
| Party | Candidate | Votes | % | ± | |
|---|---|---|---|---|---|
| Liberal Democrat | John F. Kiely | 1,840 | 51.8 | +2.8 | |
| Liberal Democrat | Michael B. Smith | 1,710 | |||
| Labour | Michael Langley | 1,399 | 39.4 | +0.2 | |
| Labour | David White | 1,298 | |||
| Green | Robert Nicholls | 165 | 4.6 | +1.7 | |
| Conservative | Paul N. Hancock | 146 | 4.1 | +0.3 | |
| Majority | 311 | 8.8 | |||
| Turnout | 46.2 | ||||
| Party | Candidate | Votes | % | ± | |
|---|---|---|---|---|---|
| Labour | Sally J. Andrews | 1,785 | 56.2 | +13.1 | |
| Labour | David Sutton | 1,608 | |||
| Conservative | Lesley A. Alexander | 850 | 26.8 | +2.5 | |
| Conservative | Timothy C. Collins | 799 | |||
| Liberal Democrat | Paul R. Potts | 542 | 17.1 | +2.4 | |
| Liberal Democrat | Roland I. Potts | 447 | |||
| Majority | 758 | 23.9 | |||
| Turnout | 37.1 | ||||
| Party | Candidate | Votes | % | ± | |
|---|---|---|---|---|---|
| Labour | Stephen James Grant | 1,385 | 69.8 | +11.2 | |
| Labour | George Micklewright | 1,300 | |||
| Militant Labour | Ian P. Marshall | 312 | 15.7 | -4.4 | |
| Militant Labour | Wayne Coombes | 251 | |||
| Conservative | Jonathan R. Hucker | 159 | 8.0 | -0.5 | |
| Green | Graham H. Davey | 128 | 6.5 | +4.5 | |
| Majority | 988 | 49.8 | |||
| Turnout | 27.4 | ||||
| Party | Candidate | Votes | % | ± | |
|---|---|---|---|---|---|
| Labour | Adrian Becker | 2,264 | 53.1 | +10.3 | |
| Labour | Anne M. Walder | 1,952 | |||
| Conservative | Kenneth I. Blanchard | 1,390 | 32.6 | +7.1 | |
| Conservative | Victor C. Eaglestone | 1,085 | |||
| Liberal Democrat | Stella J. Hender | 425 | 10.0 | -9.3 | |
| Liberal Democrat | Jean C. Norman | 376 | |||
| Green | Simon D. Kellett | 184 | 4.3 | +4.3 | |
| Majority | 562 | 13.2 | |||
| Turnout | 44.1 | ||||
| Party | Candidate | Votes | % | ± | |
|---|---|---|---|---|---|
| Labour | Bernard W. Chalmers | 1,950 | 75.3 | +29.7 | |
| Labour | Mervyn R. Hulin | 1,754 | |||
| Conservative | Barrie R. Edwards | 447 | 17.3 | -15.8 | |
| Conservative | Jonathan D.R. Price | 353 | |||
| Green | Susan P. Ball | 194 | 7.5 | +1.7 | |
| Majority | 1,307 | 50.4 | |||
| Turnout | 31.2 | ||||
| Party | Candidate | Votes | % | ± | |
|---|---|---|---|---|---|
| Labour | Jack D. Fisk | 2,353 | 63.3 | +11.7 | |
| Labour | Richard J. Pyle | 2,197 | |||
| Conservative | Donald C. Miller | 942 | 25.3 | +0.4 | |
| Conservative | Janet G. Reed | 817 | |||
| Liberal Democrat | Anne W. Stephen | 424 | 11.4 | -2.2 | |
| Liberal Democrat | John W.A. Toye | 311 | |||
| Majority | 1,255 | 33.7 | |||
| Turnout | 47.4 | ||||
| Party | Candidate | Votes | % | ± | |
|---|---|---|---|---|---|
| Liberal Democrat | Judith M. Webb | 2,079 | 51.4 | +8.3 | |
| Liberal Democrat | Sandra S. Loader | 1,937 | |||
| Labour | Michael J. Chivers | 1,167 | 28.9 | +7.8 | |
| Labour | Mohammad K. Ahmed | 1,093 | |||
| Conservative | Brian W. Edwards | 798 | 19.7 | -15.2 | |
| Conservative | Steven M. Willis | 760 | |||
| Majority | 770 | 19.0 | |||
| Turnout | 40.0 | ||||
| Party | Candidate | Votes | % | ± | |
|---|---|---|---|---|---|
| Liberal Democrat | Rosalie M. Brown | 2,198 | 43.9 | -5.5 | |
| Conservative | Joyce M. Fey | 2,051 | 41.0 | +3.3 | |
| Conservative | John L. Portch | 1,982 | |||
| Liberal Democrat | John E. Mortell | 1,843 | |||
| Labour | Keith Evans | 753 | 15.1 | +4.8 | |
| Labour | Roger J. Livingston | 657 | |||
| Majority | 69 | 1.4 | |||
| Turnout | 55.7 | ||||
| Party | Candidate | Votes | % | ± | |
|---|---|---|---|---|---|
| Labour | Graham R. Robertson | 2,043 | 77.4 | +21.6 | |
| Labour | J. Douglas Naysmith | 2,009 | |||
| Conservative | Barbara J. Moore | 596 | 22.6 | +7.8 | |
| Conservative | Alfred D. Seville | 588 | |||
| Majority | 1,413 | 53.5 | |||
| Turnout | 34.6 | ||||
| Party | Candidate | Votes | % | ± | |
|---|---|---|---|---|---|
| Labour | Arthur Massey | 1,760 | 48.1 | +5.0 | |
| Labour | David R. Poole | 1,751 | |||
| Conservative | Betty J.D. Topham | 1,441 | 39.4 | +7.9 | |
| Conservative | Anthony J. Smith | 1,279 | |||
| Liberal Democrat | Margaret S. Hodgkins | 355 | 9.7 | -3.9 | |
| Liberal Democrat | Sylvia E. Young | 351 | |||
| Green | Peter M. Scott | 105 | 2.9 | +1.0 | |
| Majority | 310 | 8.5 | |||
| Turnout | 46.1 | ||||
| Party | Candidate | Votes | % | ± | |
|---|---|---|---|---|---|
| Labour | Rosemary A. Clarke | 1,944 | 65.7 | +5.6 | |
| Labour | John T. Bees | 1,934 | |||
| Conservative | Jeanne Veale | 655 | 22.1 | -1.8 | |
| Conservative | Richard L. Clifton | 618 | |||
| Liberal Democrat | Andrew Ludlow | 361 | 12.2 | -3.8 | |
| Liberal Democrat | Francis R. Young | 344 | |||
| Majority | 1,279 | 43.2 | |||
| Turnout | 41.1 | ||||
| Party | Candidate | Votes | % | ± | |
|---|---|---|---|---|---|
| Labour | Tessa Coombes | 1,774 | 58.3 | +14.8 | |
| Labour | Patricia Roberts | 1,672 | |||
| Conservative | John E. Gammon | 576 | 18.9 | -22.4 | |
| Liberal Democrat | Evelyn M. Elworthy | 486 | 16.0 | +3.2 | |
| Green | John M. Hills | 205 | 6.7 | +4.3 | |
| Majority | 1,096 | 36.0 | |||
| Turnout | 35.8 | ||||
| Party | Candidate | Votes | % | ± | |
|---|---|---|---|---|---|
| Labour | Robert J. Channon | 1,759 | 72.6 | +10.9 | |
| Labour | Lesley Broomhead | 1,718 | |||
| Liberal Democrat | Michael Baker | 400 | 16.5 | +3.5 | |
| Liberal Democrat | Paul Elvin | 308 | |||
| Conservative | George E. Burton | 264 | 10.9 | +2.1 | |
| Majority | 1,318 | 54.4 | |||
| Turnout | 29.2 | ||||
| Party | Candidate | Votes | % | ± | |
|---|---|---|---|---|---|
| Labour | Judy Patterson | 1,880 | 65.7 | +12.1 | |
| Labour | Philip W. Gregory | 1,824 | |||
| Liberal Democrat | Joan Grace | 636 | 22.2 | -2.4 | |
| Liberal Democrat | Ian H. Parry | 566 | |||
| Conservative | Christopher R. Stallabrass | 347 | 12.1 | +0.1 | |
| Conservative | Geoffrey R. Gollop | 336 | |||
| Majority | 1,188 | 41.5 | |||
| Turnout | 39.6 | ||||
| Party | Candidate | Votes | % | ± | |
|---|---|---|---|---|---|
| Labour | John Ashton | 2,060 | 48.9 | +9.9 | |
| Labour | Joan B. McLaren | 1,989 | |||
| Conservative | Mark F.H. Casewell | 1,102 | 26.1 | -3.4 | |
| Conservative | Antony S. Waycott | 1,086 | |||
| Liberal Democrat | Robert J. Wills | 926 | 22.0 | -4.8 | |
| Liberal Democrat | Michael J. Woods | 841 | |||
| Macromedia Student | Sebastian A.H. Matthews | 127 | 3.0 | +3.0 | |
| Majority | 887 | 21.0 | |||
| Turnout | 45.3 | ||||
| Party | Candidate | Votes | % | ± | |
|---|---|---|---|---|---|
| Labour | Peter W. Hammond | 1,745 | 64.8 | +11.0 | |
| Labour | Jennifer M. Smith | 1,699 | |||
| Conservative | Martin Kerry | 599 | 22.3 | +4.8 | |
| Conservative | Jarmila Parry | 567 | |||
| Liberal Democrat | Carol F. Taylor | 348 | 12.9 | -1.6 | |
| Liberal Democrat | Simon R. Young | 251 | |||
| Majority | 1,100 | 40.9 | |||
| Turnout | 34.8 | ||||
| Party | Candidate | Votes | % | ± | |
|---|---|---|---|---|---|
| Labour | Andrew J. May | 2,123 | 62.6 | +4.0 | |
| Labour | David Johnson | 2,104 | |||
| Conservative | Cora A.P. Stephenson | 503 | 14.8 | -2.1 | |
| Conservative | Neil A. Cuthbertson | 478 | |||
| Liberal Democrat | Richard F. Hughes | 411 | 12.1 | -6.9 | |
| Green | Sigrid Shayer | 357 | 10.5 | +5.0 | |
| Majority | 1,601 | 47.2 | |||
| Turnout | 38.1 | ||||
| Party | Candidate | Votes | % | ± | |
|---|---|---|---|---|---|
| Labour | Charles S. Price | 1,802 | 61.3 | +18.1 | |
| Labour | Margaret A. Shovelton | 1,778 | |||
| Conservative | Edward J. Withers | 632 | 21.5 | -21.8 | |
| Conservative | Derek A.E. Fey | 629 | |||
| Liberal Democrat | Gordon H. Draper | 508 | 17.3 | +5.7 | |
| Liberal Democrat | Tony R. Potts | 414 | |||
| Majority | 1,146 | 39.0 | |||
| Turnout | 35.4 | ||||
| Party | Candidate | Votes | % | ± | |
|---|---|---|---|---|---|
| Labour | John E. Deasy | 2,062 | 72.5 | +22.0 | |
| Labour | Ronald E. Stone | 1,983 | |||
| Liberal Democrat | Gordon Williams | 436 | 15.3 | -11.0 | |
| Liberal Democrat | Kenneth M. Peacock | 432 | |||
| Conservative | Derek V. Hooper | 345 | 12.1 | -9.0 | |
| Conservative | Marilyn Hutton | 308 | |||
| Majority | 1,547 | 54.4 | |||
| Turnout | 36.9 | ||||
| Party | Candidate | Votes | % | ± | |
|---|---|---|---|---|---|
| Labour | Robin Moss | 2,002 | 42.6 | +11.0 | |
| Conservative | Colin J.N. Williams | 1,985 | 42.3 | -17.8 | |
| Labour | David Spry | 1,968 | |||
| Conservative | David H.R. Morris | 1,820 | |||
| Liberal Democrat | Jane M. Collins | 709 | 15.1 | +7.8 | |
| Liberal Democrat | Rosemary A. Windmill | 383 | |||
| Majority | 17 | 0.4 | |||
| Turnout | 46.3 | ||||
| Party | Candidate | Votes | % | ± | |
|---|---|---|---|---|---|
| Conservative | Peter J. Abraham | 2,051 | 51.1 | -1.9 | |
| Conservative | Christopher M.B. Alderson | 1,992 | |||
| Liberal Democrat | Keri A. Dow | 1,034 | 25.8 | -4.2 | |
| Liberal Democrat | Dennis H. Brown | 961 | |||
| Labour | Luke Akehurst | 769 | 19.2 | +5.3 | |
| Labour | Edward F. Fowler | 719 | |||
| Green | William F. McCaskie | 160 | 4.0 | +0.9 | |
| Majority | 958 | 23.9 | |||
| Turnout | 39.6 | ||||
| Party | Candidate | Votes | % | ± | |
|---|---|---|---|---|---|
| Conservative | David H. Poole | 2,614 | 54.8 | -0.1 | |
| Conservative | Robert W. Wall | 2,544 | |||
| Labour | Dick Drew | 1,102 | 23.1 | +9.6 | |
| Liberal Democrat | Carol K. Stratton | 1,050 | 22.0 | -9.6 | |
| Liberal Democrat | Antony A. Stratton | 976 | |||
| Majority | 1,442 | 30.3 | |||
| Turnout | 53.0 | ||||
| Party | Candidate | Votes | % | ± | |
|---|---|---|---|---|---|
| Labour | Helen Holland | 2,025 | 77.8 | +15.8 | |
| Labour | Paul Smith | 2,008 | |||
| Conservative | Robert R. Morris | 392 | 15.1 | -10.3 | |
| Green | Christine J. Presley | 187 | 7.2 | +5.4 | |
| Majority | 1,616 | 62.1 | |||
| Turnout | 31.7 | ||||
| Party | Candidate | Votes | % | ± | |
|---|---|---|---|---|---|
| Labour | Diane E. Bunyan | 2,368 | 69.1 | +23.8 | |
| Labour | Christopher L. Orlik | 2,035 | |||
| Green | Anita J. Lewis | 543 | 15.8 | +5.1 | |
| Conservative | William R.J. Biggs | 516 | 15.1 | -15.8 | |
| Conservative | Lilian F. Biggs | 506 | |||
| Majority | 1,492 | 43.5 | |||
| Turnout | 32.3 | ||||
References
- 1 2 3 Bennett, Will (1995-04-25). "Conservatives battling to survive in reborn Bristol". London: The Independent. Retrieved 2009-04-14.
- ↑ Woolf, Marie (1995-04-23). "Bad news? Labour's abolished it". The Independent on Sunday. p. 2.
| Metropolitan boroughs |
|
|---|---|
| Unitary authorities | |
| District councils |
|
| Welsh councils |
|
| Scottish councils |
|
| Bristol City Council | |
|---|---|
| Avon County Council |
|
| |