Bristol City Council election, 1999
| | |||||||||||||||||||||||||||||||
| |||||||||||||||||||||||||||||||
| |||||||||||||||||||||||||||||||
| |||||||||||||||||||||||||||||||
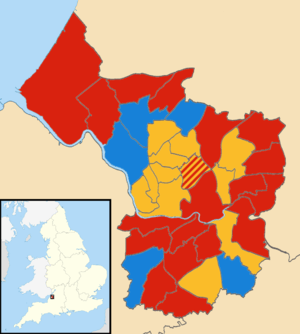
1999 local election results in Bristol
The 1999 Bristol City Council election took place on 6 May 1999, on the same day as other local elections. All seats were up for election due to boundary changes, with each ward electing 2 councillors. The total number of seats on the council increased by 2 due to the creation of a new ward: Clifton East.[1]
Despite losing seats to both the Liberal Democrats and the Conservatives, the Labour Party maintained control of the council with a slim overall majority.[2]
Ward results
Ashley
| Party | Candidate | Votes | % | ± | |
|---|---|---|---|---|---|
| Labour | Helga Christine Benson | 1,311 | 22.99 | ||
| Liberal Democrat | Trevor Ernest Riddlestone | 1,147 | 20.11 | ||
| Liberal Democrat | Sean Clifford Emmett | 1,013 | 17.76 | ||
| Labour | Robin Moss | 955 | 17.45 | ||
| Green | David Mark Simpson | 764 | 13.40 | ||
| Socialist Labour | Bernard Joseph Kennedy | 331 | 5.80 | ||
| Conservative | Ian James Henderson | 142 | 2.49 | ||
| Majority | |||||
| Turnout | 2970 | 34.87 | |||
| Labour hold | Swing | ||||
| Liberal Democrat hold | Swing | ||||
Avonmouth
| Party | Candidate | Votes | % | ± | |
|---|---|---|---|---|---|
| Labour | Celia Mildred Lukins | 1,912 | 32.41 | ||
| Labour | Patricia Roberts | 1,486 | 25.19 | ||
| Conservative | Albert Edward Murphy | 1,334 | 22.61 | ||
| Liberal Democrat | Paul Wakefield Lloyd | 584 | 9.90 | ||
| Liberal Democrat | Sheila Catherine Mercer | 344 | 5.83 | ||
| Green | Lela Helen McTernan | 239 | 4.05 | ||
| Majority | |||||
| Turnout | 3,285 | 36.50 | |||
| Labour hold | Swing | ||||
| Labour hold | Swing | ||||
Bedminster
| Party | Candidate | Votes | % | ± | |
|---|---|---|---|---|---|
| Labour | Peter John Crispin | 1,397 | 31.11 | ||
| Labour | Claire Margaret Warren | 1,184 | 26.37 | ||
| Conservative | Christian Virginia Jessie Simpson | 567 | 12.63 | ||
| Liberal Democrat | William Richard Guest | 552 | 12.29 | ||
| Liberal Democrat | Michael James Twohig | 391 | 8.71 | ||
| Green | Peter Murray Andrews | 299 | 6.66 | ||
| Socialist Alternative | Wayne Coombes | 100 | 2.23 | ||
| Majority | |||||
| Turnout | 2,383 | 27.66 | |||
| Labour hold | Swing | ||||
| Labour hold | Swing | ||||
Bishopston
| Party | Candidate | Votes | % | ± | |
|---|---|---|---|---|---|
| Liberal Democrat | David John Gordon Kitson | 1,805 | 25.09 | ||
| Liberal Democrat | Beverley Arthur Knott | 1,568 | 21.80 | ||
| Labour | Patricia McLaren | 1,449 | 20.14 | ||
| Labour | Arthur Keefe | 1,336 | 18.57 | ||
| Conservative | Richard James Manns | 353 | 4.91 | ||
| Green | Ian George Coates | 349 | 4.85 | ||
| Conservative | Oliver Edward Mead | 333 | 4.63 | ||
| Majority | |||||
| Turnout | 3,649 | 41.21 | |||
| Liberal Democrat hold | Swing | ||||
| Liberal Democrat gain from Labour | Swing | ||||
Bishopsworth
| Party | Candidate | Votes | % | ± | |
|---|---|---|---|---|---|
| Conservative | Richard Stephen Eddy | 2,295 | 32.99 | ||
| Conservative | Ronald Hodges | 1,969 | 28.30 | ||
| Labour | Geoffrey Alan Clarke | 1,112 | 15.98 | ||
| Labour | Paul Crawford Walker | 992 | 14.26 | ||
| Green | Barrie Robert Lewis | 237 | 3.41 | ||
| Liberal Democrat | Jean Althea Lemin | 209 | 3.00 | ||
| Liberal Democrat | David Malcolm Rothwell | 143 | 2.03 | ||
| Majority | |||||
| Turnout | 3,548 | 41.71 | |||
| Conservative gain from Labour | Swing | ||||
| Conservative gain from Labour | Swing | ||||
Brislington East
| Party | Candidate | Votes | % | ± | |
|---|---|---|---|---|---|
| Labour | Peter Thomas James Begley | 1,552 | 30.32 | ||
| Labour | WIlliam Leslie Martin | 1,364 | 26.65 | ||
| Conservative | Colin Robert Bretherton | 718 | 14.03 | ||
| Conservative | Craig Heeley | 608 | 11.88 | ||
| Liberal Democrat | Paul Elvin | 311 | 6.08 | ||
| Liberal Democrat | Yvonne Potts | 272 | 5.31 | ||
| Socialist Labour | Brian Andrew Corbett | 158 | 3.09 | ||
| Green | Jacqueline Allison | 135 | 2.64 | ||
| Majority | |||||
| Turnout | 2,631 | 30.15 | |||
| Labour hold | Swing | ||||
| Labour hold | Swing | ||||
Brislington West
| Party | Candidate | Votes | % | ± | |
|---|---|---|---|---|---|
| Liberal Democrat | Jacqueline Edna Norman | 1,541 | 26.81 | ||
| Liberal Democrat | Peter Henry Main | 1,537 | 26.74 | ||
| Labour | Anthony Frederick Poole | 835 | 14.53 | ||
| Labour | Simon Mark Geoffrey Crew | 820 | 14.27 | ||
| Conservative | Robert Andrew Britton | 467 | 8.13 | ||
| Conservative | Beryl McGarry | 436 | 7.59 | ||
| Green | Maureen Ann Arnaiz | 111 | 1.93 | ||
| Majority | |||||
| Turnout | 2,915 | 36.66 | |||
| Liberal Democrat hold | Swing | ||||
| Liberal Democrat hold | Swing | ||||
Cabot
| Party | Candidate | Votes | % | ± | |
|---|---|---|---|---|---|
| Liberal Democrat | Anne Pauline White | 1,091 | 29.82 | ||
| Liberal Democrat | Victor Roy Tallis | 996 | 27.22 | ||
| Labour | Margaret Mary Bannerman | 438 | 11.97 | ||
| Labour | Glynthea Margaret Modood | 438 | 11.97 | ||
| Conservative | Ashley Peter Fox | 261 | 7.13 | ||
| Conservative | James Danvers Baillieu | 238 | 6.50 | ||
| Green | Thomas Ritchie Kilner | 212 | 5.79 | ||
| Majority | |||||
| Turnout | 1,855 | 24.65 | |||
| Liberal Democrat hold | Swing | ||||
| Liberal Democrat hold | Swing | ||||
Clifton
| Party | Candidate | Votes | % | ± | |
|---|---|---|---|---|---|
| Liberal Democrat | Barbara Janke | 1,441 | 27.56 | ||
| Liberal Democrat | Brian Hugh Price | 1,287 | 24.62 | ||
| Conservative | Pearl Christine Lavinia Abraham | 694 | 13.27 | ||
| Conservative | Patricia Anne Tyreman | 693 | 13.26 | ||
| Labour | Bhupinder Sandhu | 463 | 8.86 | ||
| Labour | Alan Rogan | 396 | 7.57 | ||
| Green | Gundula Audrey Hidde Dorey | 254 | 4.86 | ||
| Majority | |||||
| Turnout | 2,648 | 34.08 | |||
| Liberal Democrat hold | Swing | ||||
| Liberal Democrat hold | Swing | ||||
Clifton East
| Party | Candidate | Votes | % | ± | |
|---|---|---|---|---|---|
| Liberal Democrat | Geoffrey Robert Jones | 886 | 22.46 | ||
| Liberal Democrat | Simon Timothy Cook | 829 | 21.50 | ||
| Conservative | Philip Arthur Cobbold | 666 | 17.27 | ||
| Conservative | Robert Marven | 628 | 16.29 | ||
| Labour | Edmund John Bramall | 350 | 9.08 | ||
| Labour | Sally Elinor Mary Purves | 347 | 9.00 | ||
| Green | John Mark Hills | 170 | 4.41 | ||
| Majority | |||||
| Turnout | 2,107 | 26.82 | |||
| Liberal Democrat win (new seat) | |||||
| Liberal Democrat win (new seat) | |||||
Cotham
| Party | Candidate | Votes | % | ± | |
|---|---|---|---|---|---|
| Liberal Democrat | Colin William Eldridge | 1,306 | 24.81 | ||
| Liberal Democrat | Barrington Dodd | 1,226 | 23.29 | ||
| Labour | Louise Marie Davies | 913 | 17.34 | ||
| Labour | Robert David Knowles-Leak | 712 | 13.53 | ||
| Conservative | Michael John Cobb | 392 | 7.45 | ||
| Green | Geoff Collard | 387 | 7.35 | ||
| Conservative | Harold Christopher Summers Webb | 328 | 6.23 | ||
| Majority | |||||
| Turnout | 2,667 | 30.37 | |||
| Liberal Democrat hold | Swing | ||||
| Liberal Democrat hold | Swing | ||||
Easton
| Party | Candidate | Votes | % | ± | |
|---|---|---|---|---|---|
| Liberal Democrat | John Francis Kiely | 1,495 | 28.58 | ||
| Liberal Democrat | Muriel Cole | 1,410 | 26.95 | ||
| Labour | Fabian Guy Breckles | 916 | 17.51 | ||
| Labour | David Sutton | 818 | 15.64 | ||
| Green | Aidan Knapp | 244 | 4.66 | ||
| Conservative | Jean Bowrey | 127 | 2.43 | ||
| Socialist Labour | Kenneth Cyril Davison | 121 | 2.31 | ||
| Conservative | Lee Walker | 100 | 1.91 | ||
| Majority | |||||
| Turnout | 2,683 | 32.49 | |||
| Liberal Democrat hold | Swing | ||||
| Liberal Democrat hold | Swing | ||||
Eastville
| Party | Candidate | Votes | % | ± | |
|---|---|---|---|---|---|
| Liberal Democrat | Paul Roberts Potts | 1,401 | 26.39 | ||
| Liberal Democrat | Anthony James Wood | 1,271 | 23.94 | ||
| Labour | Raymond Shute | 767 | 14.45 | ||
| Labour | Mohammad Khalil Ahmed | 676 | 12.73 | ||
| Conservative | Lesley Ann Alexander | 472 | 8.89 | ||
| Conservative | George Edward Burton | 422 | 7.95 | ||
| Green | Graham Hugh Davey | 132 | 2.49 | ||
| Socialist Alternative | Mark Ian Baker | 95 | 1.79 | ||
| Socialist Alternative | Nicola Janet Susan Mayger | 73 | 1.38 | ||
| Majority | 2,731 | 31.34 | |||
| Turnout | |||||
| Liberal Democrat hold | Swing | ||||
| Liberal Democrat hold | Swing | ||||
Filwood
| Party | Candidate | Votes | % | ± | |
|---|---|---|---|---|---|
| Labour | Kelvin John Blake | 1,146 | 27.04 | ||
| Labour | George Micklewright | 1,048 | 24.73 | ||
| Liberal Democrat | Ann Cooper | 887 | 20.93 | ||
| Liberal Democrat | Linda Hopkins | 871 | 20.55 | ||
| Conservative | Jonathan Robert Hucker | 148 | 3.49 | ||
| Socialist Alternative | Christine Ann Marshall | 94 | 2.22 | ||
| Socialist Alternative | Robin Victor Clapp | 44 | 1.04 | ||
| Majority | |||||
| Turnout | 2,192 | 27.65 | |||
| Labour hold | Swing | ||||
| Labour hold | Swing | ||||
Frome Vale
| Party | Candidate | Votes | % | ± | |
|---|---|---|---|---|---|
| Labour | Adrian Becker | 1,512 | 26.36 | ||
| Labour | Alun Geraint Davies | 1,354 | 23.61 | ||
| Conservative | Victor Claude Eaglestone | 994 | 17.33 | ||
| Conservative | Isle Elisabeth Temple | 945 | 16.48 | ||
| Liberal Democrat | Ronald Ivor Potts | 442 | 7.71 | ||
| Liberal Democrat | Betty Doris Sheppard | 380 | 6.63 | ||
| Socialist Labour | Michael Paul Langley | 108 | 1.88 | ||
| Majority | |||||
| Turnout | 2,948 | 35.89 | |||
| Labour hold | Swing | ||||
| Labour hold | Swing | ||||
Hartcliffe
| Party | Candidate | Votes | % | ± | |
|---|---|---|---|---|---|
| Labour | Bernard William Chalmers | 1,292 | 31.01 | ||
| Labour | Mervyn Roderick Hulin | 1,154 | 27.70 | ||
| Conservative | Shirley Diane Hodges | 513 | 12.31 | ||
| Conservative | Jonathan David Russell Price | 494 | 11.86 | ||
| Liberal Democrat | Evelyn Mary Elworthy | 303 | 7.27 | ||
| Liberal Democrat | Nicholas Lance Doddrell | 293 | 7.03 | ||
| Green | Susan Patricia Ball | 117 | 2.81 | ||
| Majority | |||||
| Turnout | 2,120 | 26.14 | |||
| Labour hold | Swing | ||||
| Labour hold | Swing | ||||
Henbury
| Party | Candidate | Votes | % | ± | |
|---|---|---|---|---|---|
| Labour | Claire Louise Cook | 1,501 | 29.09 | ||
| Labour | Richard John Pyle | 1,480 | 28.68 | ||
| Conservative | Anthony James Smith | 806 | 15.62 | ||
| Conservative | Matthew Christopher Stallabrass | 756 | 14.65 | ||
| Liberal Democrat | Christine Napier | 312 | 6.05 | ||
| Liberal Democrat | Pamela Denise Henderson | 305 | 5.91 | ||
| Majority | |||||
| Turnout | 2,619 | 35.49 | |||
| Labour hold | Swing | ||||
| Labour hold | Swing | ||||
Hengrove
| Party | Candidate | Votes | % | ± | |
|---|---|---|---|---|---|
| Liberal Democrat | Judith Mary Webb | 1,279 | 20.33 | ||
| Liberal Democrat | Mary Sykes | 1,050 | 16.69 | ||
| Conservative | Richard James Carter | 1,027 | 16.33 | ||
| Labour | Barry David Clark | 1,012 | 16.09 | ||
| Conservative | Steven Mark Willis | 943 | 14.99 | ||
| Labour | Richard Anthony Hughes | 906 | 14.40 | ||
| Green | Mary Beryl Wood | 73 | 1.16 | ||
| Majority | |||||
| Turnout | 3,192 | 36.37 | |||
| Liberal Democrat hold | Swing | ||||
| Liberal Democrat gain from Labour | Swing | ||||
Henleaze
| Party | Candidate | Votes | % | ± | |
|---|---|---|---|---|---|
| Liberal Democrat | Rosalie Margaret Brown | 2,306 | 27.79 | ||
| Liberal Democrat | Dennis Hunter Brown | 2,106 | 25.38 | ||
| Conservative | Geoffrey Richard Gollop | 1,477 | 17.80 | ||
| Conservative | John Goulandris | 1,384 | 16.68 | ||
| Labour | Keith Evans | 450 | 5.42 | ||
| Labour | Judith Mary Sluglett Borodkine | 396 | 4.77 | ||
| Green | Keith Vivian Wiltshire | 178 | 2.15 | ||
| Majority | |||||
| Turnout | 4,190 | 51.42 | |||
| Liberal Democrat hold | Swing | ||||
| Liberal Democrat hold | Swing | ||||
Hillfields
| Party | Candidate | Votes | % | ± | |
|---|---|---|---|---|---|
| Labour | Graham Roy Robertson | 1,369 | 26.94 | ||
| Labour | Judy Patterson | 1,334 | 26.25 | ||
| Conservative | Barbara Jean Moore | 663 | 13.05 | ||
| Conservative | Aldred Derek Seville | 649 | 12.77 | ||
| Liberal Democrat | John Patrick Hassell | 499 | 9.82 | ||
| Liberal Democrat | Myer Daniel Chalmers | 459 | 9.03 | ||
| Socialist Alternative | Paul Martin Moorhouse | 109 | 2.14 | ||
| Majority | |||||
| Turnout | 2,614 | 29.14 | |||
| Labour hold | Swing | ||||
| Labour hold | Swing | ||||
Horfield
| Party | Candidate | Votes | % | ± | |
|---|---|---|---|---|---|
| Conservative | Martin Kerry | 1,449 | 22.99 | ||
| Conservative | Alan Neil Bailey | 1,386 | 21.99 | ||
| Labour | Kathleen Rosalie Walker | 1,254 | 19.89 | ||
| Labour | Nichola Irene Barton | 1,196 | 18.97 | ||
| Liberal Democrat | Andrew James Ludlow | 450 | 7.14 | ||
| Liberal Democrat | Simon Ross Young | 432 | 6.85 | ||
| Green | Christopher Sykes | 137 | 2.17 | ||
| Majority | |||||
| Turnout | 3,188 | 36.65 | |||
| Conservative hold | Swing | ||||
| Conservative gain from Labour | Swing | ||||
Kingsweston
| Party | Candidate | Votes | % | ± | |
|---|---|---|---|---|---|
| Labour | John Thomas Bees | 1,158 | 22.55 | ||
| Labour | John Waines | 889 | 17.31 | ||
| Liberal Democrat | Terence Richard Daniel Thomas | 860 | 16.74 | ||
| Conservative | Richard Leslie Clifton | 754 | 14.68 | ||
| Conservative | Douglas William Dowling | 724 | 14.10 | ||
| Liberal Democrat | Sylvia Eileen Young | 638 | 12.42 | ||
| Green | David Woodgate | 113 | 2.20 | ||
| Majority | |||||
| Turnout | 2,641 | 35.27 | |||
| Labour hold | Swing | ||||
| Labour hold | Swing | ||||
Knowle
| Party | Candidate | Votes | % | ± | |
|---|---|---|---|---|---|
| Labour | Jane Veronica Painter | 1,198 | 24.75 | ||
| Labour | Tessa Coombes | 1,162 | 24.01 | ||
| Liberal Democrat | David John Traube | 806 | 16.65 | ||
| Conservative | John Philip Stephenson | 682 | 14.09 | ||
| Liberal Democrat | Alexander Timothy Matthew Oliver | 547 | 11.30 | ||
| Green | Glenn Royston Vowles | 352 | 7.27 | ||
| Socialist Alternative | Domenico William Hill | 93 | 1.92 | ||
| Majority | |||||
| Turnout | 2,625 | 31.87 | |||
| Labour hold | Swing | ||||
| Labour hold | Swing | ||||
Lawrence Hill
| Party | Candidate | Votes | % | ± | |
|---|---|---|---|---|---|
| Labour | John Channon | 1,085 | 23.72 | ||
| Labour | Brenda Hugill | 1,007 | 22.02 | ||
| Liberal Democrat | John Richard Astley | 917 | 20.05 | ||
| Liberal Democrat | Stella Jane Hender | 793 | 17.34 | ||
| Conservative | Mary Rose Brewer | 187 | 4.09 | ||
| Conservative | Diane Newton | 171 | 3.74 | ||
| Green | Joanna Baker | 145 | 3.17 | ||
| Socialist Labour | David Henry White | 138 | 3.02 | ||
| Socialist Labour | Paul Francis Williams | 131 | 2.86 | ||
| Majority | |||||
| Turnout | 2,370 | 27.48 | |||
| Labour hold | Swing | ||||
| Labour hold | Swing | ||||
Lockleaze
| Party | Candidate | Votes | % | ± | |
|---|---|---|---|---|---|
| Labour | Paul Anthony Garland | 1,227 | 29.32 | ||
| Labour | Arthur Massey | 1,147 | 27.41 | ||
| Liberal Democrat | Joan Grace | 594 | 14.19 | ||
| Conservative | Lewes William Price | 534 | 12.76 | ||
| Liberal Democrat | Ian Huw Parry | 526 | 12.57 | ||
| Green | Samantha Elizabeth Thompson | 157 | 3.75 | ||
| Majority | |||||
| Turnout | 2,235 | 28.37 | |||
| Labour hold | Swing | ||||
| Labour hold | Swing | ||||
Redland
| Party | Candidate | Votes | % | ± | |
|---|---|---|---|---|---|
| Liberal Democrat | Sylvia Jeanne Townsend | 1,148 | 16.56 | ||
| Liberal Democrat | James Charles White | 1,054 | 15.20 | ||
| Labour | Shelley Margaret Lanchbury | 1,022 | 14.74 | ||
| Labour | Elaine Rosemary Bennett | 1,021 | 14.72 | ||
| Conservative | Alastair Peter Lindsay Watson | 977 | 14.09 | ||
| Conservative | Susan Fleming | 975 | 14.06 | ||
| Green | Justin Michael Quinnell | 443 | 6.39 | ||
| Green | John Fraser Laird Devaney | 294 | 4.24 | ||
| Majority | |||||
| Turnout | 3,483 | 41.22 | |||
| Liberal Democrat gain from Labour | Swing | ||||
| Liberal Democrat gain from Labour | Swing | ||||
Southmead
| Party | Candidate | Votes | % | ± | |
|---|---|---|---|---|---|
| Labour | Jenny Smith | 1,063 | 32.42 | ||
| Labour | Peter Hammond | 1,020 | 31.11 | ||
| Conservative | Anthony Michael Orr | 390 | 11.89 | ||
| Liberal Democrat | Carol Ann Knight | 370 | 11.28 | ||
| Liberal Democrat | Martyn George Dunn | 364 | 11.10 | ||
| Socialist Labour | Vincent Michael Horrigan | 72 | 2.20 | ||
| Majority | |||||
| Turnout | 1,766 | 23.11 | |||
| Labour hold | Swing | ||||
| Labour hold | Swing | ||||
Southville
| Party | Candidate | Votes | % | ± | |
|---|---|---|---|---|---|
| Labour | Rosemary Elaine Brennan | 1,481 | 29.68 | ||
| Labour | Andrew May | 1,433 | 28.72 | ||
| Conservative | Cora Ann Stephenson | 483 | 9.68 | ||
| Liberal Democrat | Jonathan Freeman | 459 | 9.20 | ||
| Conservative | Ian Darsie Millard | 443 | 8.88 | ||
| Green | Charles Nicholas Bolton | 340 | 6.81 | ||
| Liberal Democrat | Melanie Lago Worman | 283 | 5.67 | ||
| Socialist Alternative | Roger Stephen Thomas | 68 | 1.36 | ||
| Majority | |||||
| Turnout | 2,622 | 31.81 | |||
| Labour hold | Swing | ||||
| Labour hold | Swing | ||||
St George East
| Party | Candidate | Votes | % | ± | |
|---|---|---|---|---|---|
| Labour | Margaret Ann Shovelton | 1,280 | 26.89 | ||
| Labour | Charles Stanley Price | 1,270 | 26.68 | ||
| Conservative | Jennifer Rogers | 674 | 14.16 | ||
| Conservative | Rachael Sarah Frise | 665 | 13.97 | ||
| Liberal Democrat | Gordon Draper | 495 | 10.40 | ||
| Liberal Democrat | Tony Robert Potts | 377 | 7.92 | ||
| Majority | |||||
| Turnout | 2,419 | 27.50 | |||
| Labour hold | Swing | ||||
| Labour hold | Swing | ||||
St George West
| Party | Candidate | Votes | % | ± | |
|---|---|---|---|---|---|
| Labour | John Edward Deasy | 1,296 | 30.81 | ||
| Labour | Ronald Edward Stone | 1,252 | 29.76 | ||
| Liberal Democrat | Michael Kenneth Peacock | 481 | 11.43 | ||
| Liberal Democrat | Gordon Lennox Williams | 458 | 10.89 | ||
| Conservative | Charles William Alexander | 383 | 9.10 | ||
| Conservative | Paul Andrew Place | 337 | 8.01 | ||
| Majority | |||||
| Turnout | 2,148 | 27.18 | |||
| Labour hold | Swing | ||||
| Labour hold | Swing | ||||
Stockwood
| Party | Candidate | Votes | % | ± | |
|---|---|---|---|---|---|
| Conservative | Jack Lopresti | 1,638 | 23.96 | ||
| Conservative | David Henry Robert Morris | 1,608 | 23.52 | ||
| Labour | Graham Frederick Tanner | 1,320 | 19.31 | ||
| Labour | Jonathan Marian Wyatt | 1,244 | 18.20 | ||
| Liberal Democrat | Jane Mary Collins | 490 | 7.17 | ||
| Liberal Democrat | Robert Ian Johnston | 431 | 6.30 | ||
| Green | Mary Elizabeth Thomson | 105 | 1.54 | ||
| Majority | |||||
| Turnout | 3,487 | 40.76 | |||
| Conservative hold | Swing | ||||
| Conservative gain from Labour | Swing | ||||
Stoke Bishop
| Party | Candidate | Votes | % | ± | |
|---|---|---|---|---|---|
| Conservative | Christopher Dominic Marmaduke Bellairs Alderson |
1,948 | 31.18 | ||
| Conservative | Peter John Abraham | 1,921 | 30.75 | ||
| Liberal Democrat | Vera Susan Mackel | 698 | 11.17 | ||
| Liberal Democrat | Paul Edward Smith | 669 | 10.71 | ||
| Labour | Dianne Elizabeth Manning | 415 | 6.64 | ||
| Labour | Beverley Watkins | 415 | 6.64 | ||
| Green | William Frame McCaskie | 181 | 2.90 | ||
| Majority | |||||
| Turnout | 3,145 | 38.75 | |||
| Conservative hold | Swing | ||||
| Conservative hold | Swing | ||||
Westbury-on-Trym
| Party | Candidate | Votes | % | ± | |
|---|---|---|---|---|---|
| Conservative | David Henry Poole | 2,371 | 31.12 | ||
| Conservative | Robert William Wall | 2,265 | 29.73 | ||
| Liberal Democrat | Philippa Margaret Elizabeth Jones | 740 | 9.71 | ||
| Labour | Dick Drew | 720 | 9.45 | ||
| Liberal Democrat | Geraldine Box | 680 | 8.93 | ||
| Labour | Susan Milestone | 630 | 8.27 | ||
| Green | Christina Mary Stockdale | 213 | 2.80 | ||
| Majority | |||||
| Turnout | 3,819 | 45.49 | |||
| Conservative hold | Swing | ||||
| Conservative hold | Swing | ||||
Whitchurch Park
| Party | Candidate | Votes | % | ± | |
|---|---|---|---|---|---|
| Labour | Helen Holland | 1,340 | 34.43 | ||
| Labour | David Johnson | 1,225 | 31.47 | ||
| Liberal Democrat | Stephen Edward John Farthing | 473 | 12.15 | ||
| Liberal Democrat | Peter Douglas Burrows | 362 | 9.30 | ||
| Conservative | Derek Raymond King Frise | 349 | 8.97 | ||
| Green | David Simon Coombes | 143 | 3.67 | ||
| Majority | |||||
| Turnout | 2,127 | 26.16 | |||
| Labour hold | Swing | ||||
| Labour hold | Swing | ||||
Windmill Hill
| Party | Candidate | Votes | % | ± | |
|---|---|---|---|---|---|
| Labour | Diane Elizabeth Bunyan | 1,526 | 31.54 | ||
| Labour | Christopher Louis Orlik | 1,273 | 26.31 | ||
| Green | Maxine Louise Gilman | 460 | 9.51 | ||
| Conservative | Graham David Morris | 396 | 8.19 | ||
| Liberal Democrat | Josephine Cynthia Carpenter | 358 | 7.40 | ||
| Conservative | Robert Rhys Morris | 343 | 7.09 | ||
| Liberal Democrat | James Mictel Carpenter | 333 | 6.88 | ||
| Socialist Alternative | Stephen Michael Luff | 149 | 3.08 | ||
| Majority | |||||
| Turnout | 2,472 | 27.98 | |||
| Labour hold | Swing | ||||
| Labour hold | Swing | ||||
References
- ↑ "Bristol City Council Election Results for 6 May 1999". Bristol City Council. Retrieved 12 April 2016.
- ↑ "Electoral reviews". Local Government Boundary Commission for England. Retrieved 12 April 2016.
| Metropolitan boroughs |
|
|---|---|
| Unitary authorities |
|
| District councils (England) |
|
| Welsh councils |
|
| Scottish councils |
|
| National Assembly elections | |
| |
| Bristol City Council | |
|---|---|
| Avon County Council |
|
| |
This article is issued from Wikipedia - version of the 4/17/2016. The text is available under the Creative Commons Attribution/Share Alike but additional terms may apply for the media files.