California's 13th congressional district
Coordinates: 37°48′N 122°15′W / 37.8°N 122.25°W
| California's 13th congressional district | ||
|---|---|---|
.tif.png) | ||
| Current Representative | Barbara Lee (D–Oakland) | |
| Ethnicity | 34.2% White, 19.9% Black, 22.8% Asian, 20.8% Hispanic, 2.2[1]% other | |
| Cook PVI | D+37 | |
California's 13th congressional district is a congressional district in the U.S. state of California.
Barbara Lee, a Democrat, has represented this district since January 2013.
Currently, the 13th district consists of the northern portion of Alameda County. Cities in the district include Alameda, Albany, Berkeley, Emeryville, Oakland, Piedmont, and San Leandro.[2]
Prior to redistricting by the California Citizens Redistricting Commission of 2011, the 13th district was further south, but still lay within western Alameda County.
History
Election results from statewide races
| Election results from statewide races | ||
|---|---|---|
| Year | Office | Results |
| 2012 | President | Obama 87.5 - 9.0% |
| Senator | ||
| 2010 | Governor | Brown 68.7 - 27.4% |
| Senator | Boxer 69.4 - 25.9% | |
| 2008 | President[3] | Obama 74.4 - 23.8% |
| 2006 | Governor[4] | Angelides 52.1 - 42.4% |
| Senator[5] | Feinstein 75.0 - 20.0% | |
| 2004 | President[6] | Kerry 70.9 - 28.0% |
| Senator[7] | Boxer 72.8 - 23.2% | |
| 2003 | Recall[8][9] | No 63.2 - 36.8% |
| Bustamante 46.8 - 31.5% | ||
| 2002 | Governor[10] | Davis 62.8 - 26.7% |
| 2000 | President[11] | Gore 66.4 - 29.6% |
| Senator[12] | Feinstein 66.9 - 27.3% | |
| 1998 | Governor | |
| Senator | ||
| 1996 | President | |
| 1994 | Governor | |
| Senator | ||
| 1992 | President | Clinton 54.4 - 25.6% |
| Senator | Boxer 58.0 - 31.4% | |
| Senator | Feinstein 66.1 - 26.9% | |
List of representatives
| Representative | Party | Dates | Notes | Counties |
|---|---|---|---|---|
| District created | March 4, 1933 | |||
 Charles Kramer Charles Kramer |
Democratic | March 4, 1933 – January 3, 1943 |
Lost re-election | Los Angeles |
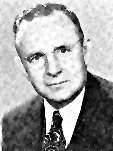
 Norris Poulson Norris Poulson |
Republican | January 3, 1943 – January 3, 1945 |
Lost re-election | |
 Ned R. Healy Ned R. Healy |
Democratic | January 3, 1945 – January 3, 1947 |
Lost re-election | |
| Norris Poulson |
Republican | January 3, 1947 – January 3, 1953 |
Redistricted to the 24th district | |
 Ernest K. Bramblett Ernest K. Bramblett |
Republican | January 3, 1953 – January 3, 1955 |
Redistricted from the 11th district Retired |
Monterey, San Luis Obispo, Santa Barbara, Ventura |
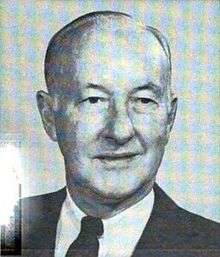 Charles M. Teague Charles M. Teague |
Republican | January 3, 1955 – January 3, 1963 |
Died | |
| January 3, 1963 – January 3, 1967 |
Santa Barbara, Ventura | |||
| January 3, 1967 – January 3, 1973 |
Southwestern Los Angeles, Santa Barbara, Ventura | |||
| January 3, 1973 – January 1, 1974 |
Most of Santa Barbara and Ventura | |||
| Vacant | January 1, 1974 – March 5, 1974 | |||
 Robert J. Lagomarsino Robert J. Lagomarsino |
Republican | March 5, 1974 – January 3, 1975 |
Redistricted to the 19th district | |
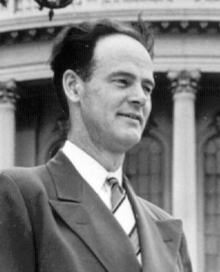
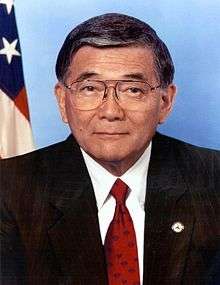 Norman Mineta Norman Mineta |
Democratic | January 3, 1975 – January 3, 1983 |
Redistricted to the 15th district | Santa Clara |
| January 3, 1983 – January 3, 1993 |
Santa Clara (western San Jose) | |||
 Pete Stark Pete Stark |
Democratic | January 3, 1993 – January 3, 2003 |
Redistricted from the 9th district | Western Alameda, small part of northern Santa Clara |
| January 3, 2003 – January 3, 2013 |
Redistricted to the 15th district and lost | Southwestern Alameda | ||
 Barbara Lee Barbara Lee |
Democratic | January 3, 2013 – present |
Redistricted from the 9th district | East Bay including Berkeley and Oakland |
Election results
|
1932 • 1934 • 1936 • 1938 • 1940 • 1942 • 1944 • 1946 • 1948 • 1950 • 1952 • 1954 • 1956 • 1958 • 1960 • 1962 • 1964 • 1966 • 1968 • 1970 • 1972 • 1974 (Special) • 1974 • 1976 • 1978 • 1980 • 1982 • 1984 • 1986 • 1988 • 1990 • 1992 • 1994 • 1996 • 1998 • 2000 • 2002 • 2004 • 2006 • 2008 • 2010 • 2012 • 2014 |
1932
| Party | Candidate | Votes | % | ||
|---|---|---|---|---|---|
| Democratic | Charles Kramer | 65,261 | 52.7 | ||
| Republican | Charles H. Randall | 53,449 | 43.1 | ||
| Liberty | George D. Higgins | 5,237 | 4.2 | ||
| Total votes | 123,947 | 100.0 | |||
| Voter turnout | % | ||||
| Democratic win (new seat) | |||||
1934
| Party | Candidate | Votes | % | |
|---|---|---|---|---|
| Democratic | Charles Kramer (incumbent) | 83,384 | 62.5 | |
| Republican | Thomas K. Case | 27,993 | 21.0 | |
| Prohibition | Charles H. Randall | 18,760 | 14.1 | |
| Socialist | Michael S. Kerrigan | 2,113 | 1.6 | |
| Communist | John J. Graham | 1,268 | 0.9 | |
| Total votes | 133,518 | 100.0 | ||
| Voter turnout | % | |||
| Democratic hold | ||||
1936
| Party | Candidate | Votes | % | |
|---|---|---|---|---|
| Democratic | Charles Kramer (incumbent) | 119,251 | 90.0 | |
| No party | Floyd Seaman (write-in) | 6,946 | 5.2% | |
| Communist | Emma Cutler | 6,362 | 4.8 | |
| Total votes | 132,559 | 100.0 | ||
| Voter turnout | % | |||
| Democratic hold | ||||
1938
| Party | Candidate | Votes | % | |
|---|---|---|---|---|
| Democratic | Charles Kramer (incumbent) | 96,258 | 65.9 | |
| Republican | K. L. Stockton | 44,808 | 30.7 | |
| Communist | Louis Baron | 5,104 | 3.4 | |
| Total votes | 146,170 | 100.0 | ||
| Voter turnout | % | |||
| Democratic hold | ||||
1940
| Party | Candidate | Votes | % | |
|---|---|---|---|---|
| Democratic | Charles Kramer (incumbent) | 127,167 | 75.7 | |
| Prohibition | Charles H. Randall | 36,406 | 21.7 | |
| Communist | Celeste Strack | 4,434 | 2.6 | |
| Total votes | 168,007 | 100.0 | ||
| Voter turnout | % | |||
| Democratic hold | ||||
1942
| Party | Candidate | Votes | % | |||
|---|---|---|---|---|---|---|
| Republican | Norris Poulson | 38,577 | 49.5 | |||
| Democratic | Charles Kramer (incumbent) | 33,060 | 42.4 | |||
| Townsend | Calvert S. Wilson | 6,306 | 8.1 | |||
| Total votes | 77,943 | 100.0 | ||||
| Voter turnout | % | |||||
| Republican gain from Democratic | ||||||
1944
| Party | Candidate | Votes | % | |||
|---|---|---|---|---|---|---|
| Democratic | Ned R. Healy | 66,854 | 55 | |||
| Republican | Norris Poulson (incumbent) | 54,792 | 45 | |||
| Total votes | 121,646 | 100 | ||||
| Voter turnout | % | |||||
| Democratic gain from Republican | ||||||
1946
| Party | Candidate | Votes | % | |||
|---|---|---|---|---|---|---|
| Republican | Norris Poulson | 48,071 | 51.8 | |||
| Democratic | Ned R. Healy (incumbent) | 44,712 | 48.2 | |||
| Total votes | 92,783 | 100.0 | ||||
| Voter turnout | % | |||||
| Republican gain from Democratic | ||||||
1948
| Party | Candidate | Votes | % | |
|---|---|---|---|---|
| Republican | Norris Poulson (incumbent) | 62,951 | 52.6 | |
| Democratic | Ned R. Healy | 56,624 | 47.4 | |
| Total votes | 119,575 | 100.0 | ||
| Voter turnout | % | |||
| Republican hold | ||||
1950
| Party | Candidate | Votes | % | |
|---|---|---|---|---|
| Republican | Norris Poulson (incumbent) | 83,296 | 84.9 | |
| Progressive | Ellen P. Davidson | 14,789 | 15.1 | |
| Total votes | 98,085 | 100.0 | ||
| Voter turnout | % | |||
| Republican hold | ||||
1952
| Party | Candidate | Votes | % | |
|---|---|---|---|---|
| Republican | Ernest K. Bramblett (inc.) | 79,496 | 51 | |
| Democratic | Will Hays | 76,516 | 49 | |
| Total votes | 156,012 | 100 | ||
| Voter turnout | % | |||
| Republican hold | ||||
1954
| Party | Candidate | Votes | % | |
|---|---|---|---|---|
| Republican | Charles M. Teague | 69,287 | 52.5 | |
| Democratic | Timothy I. O'Reilly | 62,786 | 47.5 | |
| Total votes | 132,073 | 100.0 | ||
| Voter turnout | % | |||
| Republican hold | ||||
1956
| Party | Candidate | Votes | % | |
|---|---|---|---|---|
| Republican | Charles M. Teague (inc.) | 104,009 | 59.6 | |
| Democratic | William Kirk Stewart | 70,567 | 40.4 | |
| Total votes | 174,576 | 100.0 | ||
| Voter turnout | % | |||
| Republican hold | ||||
1958
| Party | Candidate | Votes | % | |
|---|---|---|---|---|
| Republican | Charles M. Teague (inc.) | 98,381 | 57 | |
| Democratic | William Kirk Stewart | 74,160 | 43 | |
| Total votes | 172,541 | 100 | ||
| Voter turnout | % | |||
| Republican hold | ||||
1960
| Party | Candidate | Votes | % | |
|---|---|---|---|---|
| Republican | Charles M. Teague (inc.) | 146,072 | 65 | |
| Democratic | George J. Holgate | 78,597 | 35 | |
| Total votes | 224,669 | 100 | ||
| Voter turnout | % | |||
| Republican hold | ||||
1962
| Party | Candidate | Votes | % | |
|---|---|---|---|---|
| Republican | Charles M. Teague (inc.) | 84,743 | 64.9 | |
| Democratic | George J. Holgate | 45,746 | 35.1 | |
| Total votes | 130,489 | 100.0 | ||
| Voter turnout | % | |||
| Republican hold | ||||
1964
| Party | Candidate | Votes | % | |
|---|---|---|---|---|
| Republican | Charles M. Teague (inc.) | 104,744 | 57.4 | |
| Democratic | George E. Taylor | 77,763 | 42.6 | |
| Total votes | 182,507 | 100.0 | ||
| Voter turnout | % | |||
| Republican hold | ||||
1966
| Party | Candidate | Votes | % | |
|---|---|---|---|---|
| Republican | Charles M. Teague (inc.) | 116,701 | 67.5 | |
| Democratic | Charles A. Storke | 56,240 | 32.5 | |
| Total votes | 172,941 | 100.0 | ||
| Voter turnout | % | |||
| Republican hold | ||||
1968
| Party | Candidate | Votes | % | |
|---|---|---|---|---|
| Republican | Charles M. Teague (inc.) | 148,357 | 65.9 | |
| Democratic | Stankey K. Sheinbaum | 76,928 | 34.1 | |
| Total votes | 225,285 | 100.0 | ||
| Voter turnout | % | |||
| Republican hold | ||||
1970
| Party | Candidate | Votes | % | |
|---|---|---|---|---|
| Republican | Charles M. Teague (inc.) | 125,507 | 58.2 | |
| Democratic | Gary Hart | 87,980 | 40.8 | |
| American Independent | Maude I. Jordet | 2,339 | 1.0 | |
| Total votes | 215,826 | 100.0 | ||
| Voter turnout | % | |||
| Republican hold | ||||
1972
| Party | Candidate | Votes | % | |
|---|---|---|---|---|
| Republican | Charles M. Teague (inc.) | 153,723 | 73.9 | |
| Democratic | Lester Dean Cleveland | 54,237 | 27.1 | |
| Total votes | 207,960 | 100.0 | ||
| Voter turnout | % | |||
| Republican hold | ||||
1974 (Special)
| Party | Candidate | Votes | % | |
|---|---|---|---|---|
| Republican | Robert J. Lagomarsino | ' | 53.7 | |
| Democratic | James D. Loebl | 18.8 | ||
| Democratic | James A. Browning, Jr. | 7.8 | ||
| Democratic | Roger A. Ikola | 6.3 | ||
| Democratic | E.T. "Tom" Jolicoeur | 6.0 | ||
| Democratic | David H. Miller | 3.2 | ||
| Democratic | R.W. Handley | 2.4 | ||
| Democratic | F. Joe Deauchamp | 1.9 | ||
| Total votes | ' | 100.0 | ||
| Voter turnout | % | |||
| Republican hold | ||||
1974
| Party | Candidate | Votes | % | |||
|---|---|---|---|---|---|---|
| Democratic | Norm Mineta | 78,649 | 52.6 | |||
| Republican | George W. Milias | 63,381 | 42.4 | |||
| Peace and Freedom | Elizabeth Cervantes Barron | 3,846 | 2.6 | |||
| American Independent | Floyd S. Stancliffe | 3,738 | 2.5 | |||
| Total votes | 149,614 | 100.0 | ||||
| Voter turnout | % | |||||
| Democratic gain from Republican | ||||||
1976
| Party | Candidate | Votes | % | |
|---|---|---|---|---|
| Democratic | Norm Mineta (incumbent) | 135,291 | 66.8 | |
| Republican | Ernie Konnyu | 63,130 | 31.2 | |
| American Independent | William Pollock Herrell | 4,190 | 2.1 | |
| Total votes | 202,611 | 100.0 | ||
| Voter turnout | % | |||
| Democratic hold | ||||
1978
| Party | Candidate | Votes | % | |
|---|---|---|---|---|
| Democratic | Norm Mineta (incumbent) | 100,809 | 57.5 | |
| Republican | Dan O'Keefe | 69,306 | 39.5 | |
| Peace and Freedom | Robert Goldsborough III | 5,246 | 3.0 | |
| Total votes | 175,361 | 100.0 | ||
| Voter turnout | % | |||
| Democratic hold | ||||
1980
| Party | Candidate | Votes | % | |
|---|---|---|---|---|
| Democratic | Norm Mineta (incumbent) | 132,246 | 58.9 | |
| Republican | W. E. "Ted" Gagne | 79,766 | 35.5 | |
| Libertarian | Ray Strong | 8,806 | 3.9 | |
| Peace and Freedom | Robert Goldsborough | 3,791 | 1.7 | |
| Total votes | 224,609 | 100.0 | ||
| Voter turnout | % | |||
| Democratic hold | ||||
1982
| Party | Candidate | Votes | % | |
|---|---|---|---|---|
| Democratic | Norm Mineta (incumbent) | 110,805 | 65.9 | |
| Republican | Tom Kelly | 52,806 | 31.4 | |
| Libertarian | Al Hinkle | 4,553 | 2.7 | |
| Total votes | 168,164 | 100.0 | ||
| Voter turnout | % | |||
| Democratic hold | ||||
1984
| Party | Candidate | Votes | % | |
|---|---|---|---|---|
| Democratic | Norm Mineta (incumbent) | 139,851 | 65.2 | |
| Republican | John D. "Jack" Williams | 70,666 | 33.0 | |
| Libertarian | John R. Redding | 3,836 | 1.8 | |
| Total votes | 214,353 | 100.0 | ||
| Voter turnout | % | |||
| Democratic hold | ||||
1986
| Party | Candidate | Votes | % | |
|---|---|---|---|---|
| Democratic | Norm Mineta (incumbent) | 107,696 | 69.7 | |
| Republican | Bob Nash | 46,754 | 30.3 | |
| Total votes | 154,450 | 100.0 | ||
| Voter turnout | % | |||
| Democratic hold | ||||
1988
| Party | Candidate | Votes | % | |
|---|---|---|---|---|
| Democratic | Norm Mineta (incumbent) | 143,980 | 67.1 | |
| Republican | Luke Somner | 63,959 | 29.8 | |
| Libertarian | John H. Webster | 6,583 | 3.1 | |
| Total votes | 214,522 | 100.0 | ||
| Voter turnout | % | |||
| Democratic hold | ||||
1990
| Party | Candidate | Votes | % | |
|---|---|---|---|---|
| Democratic | Norm Mineta (incumbent) | 97,286 | 58.0 | |
| Republican | David E. Smith | 59,773 | 35.7 | |
| Libertarian | John H. Webster | 10,587 | 6.3 | |
| Total votes | 167,646 | 100.0 | ||
| Voter turnout | % | |||
| Democratic hold | ||||
1992
| Party | Candidate | Votes | % | |
|---|---|---|---|---|
| Democratic | Pete Stark (incumbent) | 123,795 | 60.2 | |
| Republican | Verne W. Teyler | 64,953 | 31.6 | |
| Peace and Freedom | Roslyn A. Allen | 16,768 | 8.2 | |
| Total votes | 205,516 | 100.0 | ||
| Voter turnout | % | |||
| Democratic hold | ||||
1994
| Party | Candidate | Votes | % | |
|---|---|---|---|---|
| Democratic | Pete Stark (incumbent) | 97,344 | 64.62 | |
| Republican | Larry Molton | 45,555 | 30.24 | |
| Libertarian | Robert "Bob" Gough | 7,743 | 5.14 | |
| Total votes | 150,642 | 100.00 | ||
| Voter turnout | % | |||
| Democratic hold | ||||
1996
| Party | Candidate | Votes | % | |
|---|---|---|---|---|
| Democratic | Pete Stark (incumbent) | 114,408 | 65.2 | |
| Republican | James Fay | 53,385 | 30.4 | |
| Libertarian | Terry Savage | 7,746 | 4.4 | |
| Total votes | 176,539 | 100.0 | ||
| Voter turnout | % | |||
| Democratic hold | ||||
1998
| Party | Candidate | Votes | % | |
|---|---|---|---|---|
| Democratic | Pete Stark (incumbent) | 101,671 | 71.20 | |
| Republican | James R. Goetz | 38,050 | 26.65 | |
| Natural Law | Karnig Beylikjian | 3,066 | 4.4 | |
| Total votes | 142,787 | 100.0 | ||
| Voter turnout | % | |||
| Democratic hold | ||||
2000
| Party | Candidate | Votes | % | |
|---|---|---|---|---|
| Democratic | Pete Stark (incumbent) | 129,012 | 70.5 | |
| Republican | James R. "Jim" Goetz | 44,499 | 24.3 | |
| Libertarian | Howard Mora | 4,623 | 2.6 | |
| Natural Law | Timothy R. Hoehner | 2,647 | 1.4 | |
| American Independent | Don J. Grundmann | 2,365 | 1.2 | |
| Total votes | 183,146 | 100.0 | ||
| Voter turnout | % | |||
| Democratic hold | ||||
2002
| Party | Candidate | Votes | % | |
|---|---|---|---|---|
| Democratic | Pete Stark (incumbent) | 86,495 | 71.1 | |
| Republican | Syed R. Mahmoud | 26,852 | 22.1 | |
| Libertarian | Mark R. Stroberg | 3,703 | 3.1 | |
| American Independent | Don J. Grundmann | 2,772 | 2.2 | |
| Reform | John J. Bambey | 1,901 | 1.5 | |
| Total votes | 121,723 | 100.0 | ||
| Voter turnout | % | |||
| Democratic hold | ||||
2004
| Party | Candidate | Votes | % | |
|---|---|---|---|---|
| Democratic | Pete Stark (incumbent) | 144,605 | 71.7 | |
| Republican | George I. Bruno | 48,439 | 28.2 | |
| Libertarian | Mark R. Stroberg | 8,877 | 4.3 | |
| Total votes | 201,921 | 100.0 | ||
| Voter turnout | % | |||
| Democratic hold | ||||
2006
| Party | Candidate | Votes | % | |
|---|---|---|---|---|
| Democratic | Pete Stark (incumbent) | 144,409 | 74.9 | |
| Republican | George I. Bruno | 27,141 | 25.1 | |
| Total votes | 171,500 | 100.0 | ||
| Voter turnout | % | |||
| Democratic hold | ||||
2008
| Party | Candidate | Votes | % | |
|---|---|---|---|---|
| Democratic | Pete Stark (incumbent) | 166,829 | 76.5 | |
| Republican | Raymond Chui | 51,447 | 23.5 | |
| Total votes | 218,276 | 100.0 | ||
| Voter turnout | % | |||
| Democratic hold | ||||
2010
| Party | Candidate | Votes | % | |
|---|---|---|---|---|
| Democratic | Pete Stark (incumbent) | 118,278 | 72.19 | |
| Republican | Forest Baker | 45,545 | 27.81 | |
| Democratic hold | ||||
2012
| Party | Candidate | Votes | % | |
|---|---|---|---|---|
| Democratic | Barbara Lee | 250,436 | 87% | |
| No party preference | Marilyn M. Singleton | 38,146 | 13% | |
| Total votes | 288,582 | 100.0% | ||
| Democratic hold | ||||
2014
| Party | Candidate | Votes | % | |
|---|---|---|---|---|
| Democratic | Barbara Lee (incumbent) | 168,491 | 89% | |
| Republican | Dakin Sundeen | 21,940 | 11% | |
| Total votes | 190,431 | 100.0% | ||
| Democratic hold | ||||
Living former Members
As of April 2015, there are three former members of the U.S. House of Representatives from California's 13th congressional district that are currently living.
| Representative | Term in office | Date of birth (and age) |
|---|---|---|
| Robert J. Lagomarsino | 1974 - 1975 | September 4, 1926 |
| Ed Zschau | 1975 - 1993 | January 6, 1940 |
| Pete Stark | 1993 - 2013 | November 11, 1931 |
Historical district boundaries

See also
References
- ↑ "California election results - 2012 election". Los Angeles Times. Retrieved February 24, 2013.
- ↑ "Maps: Final Congressional Districts". Citizens Redistricting Commission. Retrieved February 25, 2013.
- ↑ (2008 President)
- ↑ Statement of Vote (2006 Governor)
- ↑ Statement of Vote (2006 Senator)
- ↑ Statement of Vote (2004 President)
- ↑ Statement of Vote (2004 Senator)
- ↑ Statement of Vote (2003 Recall Question)
- ↑ Statement of Vote (2003 Governor)
- ↑ Statement of Vote (2002 Governor)
- ↑ Statement of Vote (2000 President)
- ↑ Statement of Vote (2000 Senator)
- ↑ 1932 election results
- ↑ 1934 election results
- ↑ 1936 election results
- ↑ 1938 election results
- ↑ 1940 election results
- ↑ 1942 election results
- ↑ 1944 election results
- ↑ 1946 election results
- ↑ 1948 election results
- ↑ 1950 election results
- ↑ 1952 election results
- ↑ 1954 election results
- ↑ 1956 election results
- ↑ 1958 election results
- ↑ 1960 election results
- ↑ 1962 election results
- ↑ 1964 election results
- ↑ 1966 election results
- ↑ 1968 election results
- ↑ 1970 election results
- ↑ 1972 election results
- ↑ 1974 special election results
- ↑ 1974 election results
- ↑ 1976 election results
- ↑ 1978 election results
- ↑ 1980 election results
- ↑ 1982 election results
- ↑ 1984 election results
- ↑ 1986 election results
- ↑ 1988 election results
- ↑ 1990 election results
- ↑ 1992 election results
- ↑ 1994 election results
- ↑ 1996 election results
- ↑ 1998 election results
- ↑ 2000 election results
- ↑ 2002 general election results Archived February 3, 2009, at the Wayback Machine.
- ↑ 2004 general election results
- ↑ 2006 general election results Archived November 27, 2008, at the Wayback Machine.
- ↑ 2008 general election results
- ↑ 2010 general election results
- ↑ 2012 general election results Archived October 19, 2013, at the Wayback Machine.
- ↑ 2012 general election results Archived October 19, 2013, at the Wayback Machine.
External links
- GovTrack.us: California's 13th congressional district
- RAND California Election Returns: District Definitions (out of date)
- California Voter Foundation map - CD13 (out of date)