California's 24th congressional district
| California's 24th congressional district | ||
|---|---|---|
.tif.png) | ||
| Current Representative | Lois Capps (D–Santa Barbara) | |
| Ethnicity | 57.1% White, 1.8% Black, 4.1% Asian, 34.1% Hispanic, 2.9[1]% other | |
| Cook PVI | D+4 | |
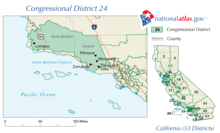
California's 24th congressional district is represented by Democrat Lois Capps. Following redistricting, the district contains all of Santa Barbara County and San Luis Obispo County as well the Los Padres National Forest in Ventura County.
From 2003–2013, the district covered most of Ventura and inland Santa Barbara Counties.
Voting
| Election results from statewide races | ||
|---|---|---|
| Year | Office | Results |
| 2012 | President[2] | Obama 54 - 43% |
| 2010 | Governor | Whitman 54 - 41% |
| Senator | Fiorina 55 - 40% | |
| 2008 | President[3] | Obama 52 - 46% |
| 2006 | Governor[4] | Schwarzenegger 66 - 30% |
| Senator[5] | Feinstein 49 - 46% | |
| 2004 | President[6] | Bush 56 - 43% |
| Senator[7] | Jones 48 - 47% | |
| 2003 | Recall[8][9] | Yes 67 - 33% |
| Schwarzenegger 55 - 20% | ||
| 2002 | Governor[10] | Simon 52 - 39% |
| 2000 | President[11] | Gore 57 - 38% |
| Senator[12] | Feinstein 59 - 35% | |
| 1998 | Governor | |
| Senator | ||
| 1996 | President | |
| 1994 | Governor | |
| Senator | ||
| 1992 | President | Clinton 48 - 30% |
| Senator | Boxer 50 - 43% | |
| Senator | Feinstein 57 - 37% | |
List of representatives
| Representative | Party | Dates | Notes | Counties |
|---|---|---|---|---|
| District created | January 3, 1953 | |||
 Norris Poulson Norris Poulson |
Republican | January 3, 1953 – June 11, 1953 |
Redistricted from the 13th district Resigned to become Mayor of Los Angeles |
Los Angeles |
| Vacant | June 11, 1953 – November 10, 1953 |
|||
 Glenard P. Lipscomb Glenard P. Lipscomb |
Republican | November 10, 1953 – January 3, 1967 |
||
| January 3, 1967 – February 1, 1970 |
Died | Los Angeles, southwestern San Bernardino | ||
| Vacant | February 1, 1970 – June 30, 1970 |
|||
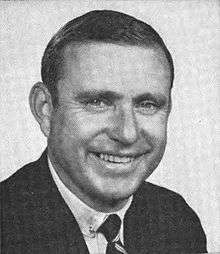 John H. Rousselot John H. Rousselot |
Republican | June 30, 1970 – January 3, 1973 |
||
| January 3, 1973 – January 3, 1975 |
Redistricted to the 26th district | Los Angeles | ||
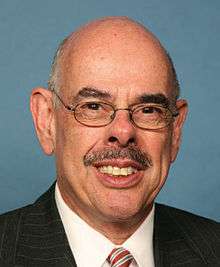 Henry Waxman Henry Waxman |
Democratic | January 3, 1975 – January 3, 1983 |
||
| January 3, 1983 – January 3, 1993 | Redistricted to the 29th district | North central Los Angeles (Hollywood) | ||
 Anthony C. Beilenson Anthony C. Beilenson |
Democratic | January 3, 1993 – January 3, 1997 |
Redistricted from the 23rd district Retired |
Southwestern Los Angeles, southeastern Ventura (Thousand Oaks) |
 Brad Sherman Brad Sherman |
Democratic | January 3, 1997 – January 3, 2003 |
Redistricted to the 27th district | |
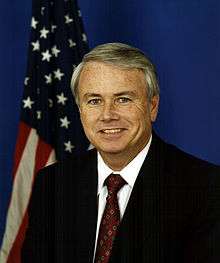 Elton Gallegly Elton Gallegly |
Republican | January 3, 2003 – January 3, 2013 |
Redistricted from the 23rd district Retired |
Inland Santa Barbara, most of Ventura |
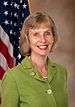 Lois Capps Lois Capps |
Democratic | January 3, 2013 - January 3, 2017 |
Redistricted from the 23rd district | Central Coast including San Luis Obispo and Santa Barbara |
 Salud Carbajal Salud Carbajal |
Democratic | January 3, 2017 - |
||
Election results
|
1952 • 1953 (Special) • 1954 • 1956 • 1958 • 1960 • 1962 • 1964 • 1966 • 1968 • 1970 (Special) • 1970 • 1972 • 1974 • 1976 • 1978 • 1980 • 1982 • 1984 • 1986 • 1988 • 1990 • 1992 • 1994 • 1996 • 1998 • 2000 • 2002 • 2004 • 2006 • 2008 • 2010 • 2012 • 2014 |
1952
| Party | Candidate | Votes | % | |
|---|---|---|---|---|
| Republican | Norris Poulson (incumbent) | 119,799 | 87.4 | |
| Progressive | Bertram L. Sharp | 17,307 | 12.6 | |
| Total votes | 137,106 | 100.0 | ||
| Voter turnout | % | |||
| Republican hold | ||||
1953 (Special)
Republican Glenard P. Lipscomb won the special election to replace fellow Republican Norris Poulson, who was elected Mayor of Los Angeles. Data for this special election is not available.[14]
1954
| Party | Candidate | Votes | % | |
|---|---|---|---|---|
| Republican | Glenard P. Lipscomb (inc.) | 65,431 | 56.9 | |
| Democratic | George Arnold | 49,592 | 43.1 | |
| Total votes | 115,023 | 100.0 | ||
| Voter turnout | % | |||
| Republican hold | ||||
1956
| Party | Candidate | Votes | % | |
|---|---|---|---|---|
| Republican | Glenard P. Lipscomb (inc.) | 84,120 | 61.9 | |
| Democratic | Fay Porter | 51,692 | 38.1 | |
| Total votes | 135,812 | 100.0 | ||
| Voter turnout | % | |||
| Republican hold | ||||
1958
| Party | Candidate | Votes | % | |
|---|---|---|---|---|
| Republican | Glenard P. Lipscomb (inc.) | 68,184 | 56.4 | |
| Democratic | William H. Ware, Jr. | 52,804 | 43.6 | |
| Total votes | 120,988 | 100.0 | ||
| Voter turnout | % | |||
| Republican hold | ||||
1960
| Party | Candidate | Votes | % | |
|---|---|---|---|---|
| Republican | Glenard P. Lipscomb (inc.) | 82,497 | 59.7 | |
| Democratic | Norman Hass | 55,613 | 40.3 | |
| Total votes | 138,110 | 100.0 | ||
| Voter turnout | % | |||
| Republican hold | ||||
1962
| Party | Candidate | Votes | % | |
|---|---|---|---|---|
| Republican | Glenard P. Lipscomb (inc.) | 120,884 | 70.3 | |
| Democratic | Knox Mellon | 50,970 | 29.7 | |
| Total votes | 171,854 | 100.0 | ||
| Voter turnout | % | |||
| Republican hold | ||||
1964
| Party | Candidate | Votes | % | |
|---|---|---|---|---|
| Republican | Glenard P. Lipscomb (inc.) | 139,784 | 67.9 | |
| Democratic | Bryan W. Stevens | 65,967 | 32.1 | |
| Total votes | 205,751 | 100.0 | ||
| Voter turnout | % | |||
| Republican hold | ||||
1966
| Party | Candidate | Votes | % | |
|---|---|---|---|---|
| Republican | Glenard P. Lipscomb (inc.) | 148,190 | 76.3 | |
| Democratic | Fred Warner Neal | 46,115 | 23.7 | |
| Total votes | 194,305 | 100.0 | ||
| Voter turnout | % | |||
| Republican hold | ||||
1968
| Party | Candidate | Votes | % | |
|---|---|---|---|---|
| Republican | Glenard P. Lipscomb (inc.) | 152,180 | 72.8 | |
| Democratic | Fred Warner Neal | 56,723 | 27.2 | |
| Total votes | 208,903 | ' | ||
| Republican hold | ||||
1970 (Special)
| Party | Candidate | Votes | % | |
|---|---|---|---|---|
| Republican | John H. Rousselot | 62,749 | 68.2 | |
| Democratic | Myrlie B. Evers | 29,248 | 31.8 | |
| Total votes | 91,997 | 100.0 | ||
| Voter turnout | % | |||
| Republican hold | ||||
1970
| Party | Candidate | Votes | % | |
|---|---|---|---|---|
| Republican | John H. Rousselot (inc.) | 124,071 | 65.1 | |
| Democratic | Myrlie B. Evers | 61,777 | 32.4 | |
| American Independent | Brian Scanlon | 3,018 | 1.6 | |
| Peace and Freedom | Harold Kaplan | 1,858 | 1.0 | |
| Total votes | 190,724 | 100.0 | ||
| Voter turnout | % | |||
| Republican hold | ||||
1972
| Party | Candidate | Votes | % | |
|---|---|---|---|---|
| Republican | John H. Rousselot (inc.) | 141,274 | 70.1 | |
| Democratic | Luther Mandell | 60,170 | 29.9 | |
| Total votes | 201,444 | ' | ||
| Republican hold | ||||
1974
| Party | Candidate | Votes | % | |
|---|---|---|---|---|
| Democratic | Henry Waxman | 85,343 | 64.0 | |
| Republican | Elliott Stone Graham | 43,680 | 33.0 | |
| American Independent | David E. Davis | 3,980 | 3.0 | |
| Total votes | 133,003 | 100.0 | ||
| Voter turnout | % | |||
| Democratic hold | ||||
1976
| Party | Candidate | Votes | % | |
|---|---|---|---|---|
| Democratic | Henry Waxman (incumbent) | 108,296 | 67.8 | |
| Republican | David Irvins Simmons | 51,478 | 32.2 | |
| Total votes | 159,774 | 100.0 | ||
| Voter turnout | % | |||
| Democratic hold | ||||
1978
| Party | Candidate | Votes | % | |
|---|---|---|---|---|
| Democratic | Henry Waxman (incumbent) | 85,075 | 62.7 | |
| Republican | Howard G. Schaefer | 44,243 | 32.6 | |
| Peace and Freedom | Kevin Casey Peters | 6,453 | 4.8 | |
| Total votes | 135,771 | 100.0 | ||
| Voter turnout | % | |||
| Democratic hold | ||||
1980
| Party | Candidate | Votes | % | |
|---|---|---|---|---|
| Democratic | Henry Waxman (incumbent) | 93,569 | 63.8 | |
| Republican | Roland Cayard | 39,744 | 27.1 | |
| Peace and Freedom | Margaret "Maggie" Feigin | 5,905 | 4.0 | |
| Libertarian | Robert E. Lehman | 5,172 | 3.5 | |
| American Independent | Jack Smilowitz | 2,341 | 1.6 | |
| Total votes | 146,731 | 100.0 | ||
| Voter turnout | % | |||
| Democratic hold | ||||
1982
| Party | Candidate | Votes | % | |
|---|---|---|---|---|
| Democratic | Henry Waxman (incumbent) | 88,516 | 65.1 | |
| Republican | Jerry Zerg | 42,133 | 31.0 | |
| Libertarian | Jeff Mandel | 5,420 | 1.8 | |
| Total votes | 136,069 | 100.0 | ||
| Voter turnout | % | |||
| Democratic hold | ||||
1984
| Party | Candidate | Votes | % | |
|---|---|---|---|---|
| Democratic | Henry Waxman (incumbent) | 97,340 | 63.4 | |
| Republican | Jerry Zerg | 51,010 | 33.2 | |
| Peace and Freedom | James Green | 2,780 | 1.8 | |
| Libertarian | Tim Custer | 2,477 | 1.6 | |
| Total votes | 153,607 | 100.0 | ||
| Voter turnout | % | |||
| Democratic hold | ||||
1986
| Party | Candidate | Votes | % | |
|---|---|---|---|---|
| Democratic | Henry Waxman (incumbent) | 103,914 | 87.9 | |
| Libertarian | George Abrahams | 8,871 | 7.5 | |
| Peace and Freedom | James Green | 5,388 | 4.6 | |
| Total votes | 118,173 | 100.0 | ||
| Voter turnout | % | |||
| Democratic hold | ||||
1988
| Party | Candidate | Votes | % | |
|---|---|---|---|---|
| Democratic | Henry Waxman (incumbent) | 112,038 | 72.2 | |
| Republican | John N. Cowles | 36,835 | 23.8 | |
| Peace and Freedom | James Green | 3,571 | 2.3 | |
| Libertarian | George Abrahams | 2,627 | 1.7 | |
| Total votes | 155,071 | 100.0 | ||
| Voter turnout | % | |||
| Democratic hold | ||||
1990
| Party | Candidate | Votes | % | |
|---|---|---|---|---|
| Democratic | Henry Waxman (incumbent) | 71,562 | 68.9 | |
| Republican | John N. Cowles | 26,607 | 25.6 | |
| Peace and Freedom | Maggie Phair | 5,706 | 5.5 | |
| Total votes | 103,875 | 100.0 | ||
| Voter turnout | % | |||
| Democratic hold | ||||
1992
| Party | Candidate | Votes | % | |
|---|---|---|---|---|
| Democratic | Anthony C. Beilenson (inc.) | 141,742 | 55.5 | |
| Republican | Tom McClintock | 99,835 | 39.1 | |
| Peace and Freedom | John Paul Lindblad | 13,690 | 5.4 | |
| Total votes | 255,267 | 100.0 | ||
| Voter turnout | % | |||
| Democratic hold | ||||
1994
| Party | Candidate | Votes | % | |
|---|---|---|---|---|
| Democratic | Anthony C. Beilenson (inc.) | 95,342 | 49.35 | |
| Republican | Rich Sybert | 91,806 | 47.52 | |
| Libertarian | John C. Koehler | 6,031 | 3.12 | |
| Total votes | 193,179 | 100.0 | ||
| Voter turnout | % | |||
| Democratic hold | ||||
1996
| Party | Candidate | Votes | % | |
|---|---|---|---|---|
| Democratic | Brad Sherman | 106,193 | 49.5 | |
| Republican | Rich Sybert | 93,629 | 43.6 | |
| Peace and Freedom | Ralph Shroyer | 6,267 | 2.9 | |
| Libertarian | Erich Miller | 5,691 | 2.6 | |
| Natural Law | Ron Lawrence | 3,068 | 1.4 | |
| Total votes | 214,848 | 100.0 | ||
| Voter turnout | % | |||
| Democratic hold | ||||
1998
| Party | Candidate | Votes | % | |
|---|---|---|---|---|
| Democratic | Brad Sherman (incumbent) | 103,491 | 57.31 | |
| Republican | Randy Hoffman | 69,501 | 38.49 | |
| Natural Law | Catherine Carter | 3,033 | 1.68 | |
| Libertarian | Erich D. Miller | 2,695 | 1.49 | |
| Peace and Freedom | Ralph Shroyer | 1,860 | 1.03 | |
| Total votes | 180,580 | 100.0 | ||
| Voter turnout | % | |||
| Democratic hold | ||||
2000
| Party | Candidate | Votes | % | |
|---|---|---|---|---|
| Democratic | Brad Sherman (incumbent) | 155,398 | 66.1 | |
| Republican | Jerry Doyle | 70,169 | 29.8 | |
| Libertarian | Juan Carlos Ros | 6,966 | 2.9 | |
| Natural Law | Michael Cuddehe | 2,911 | 1.2 | |
| Total votes | 235,444 | 100.0 | ||
| Voter turnout | % | |||
| Democratic hold | ||||
2002
| Party | Candidate | Votes | % | |
|---|---|---|---|---|
| Republican | Elton Gallegly (incumbent) | 120,585 | 65.2 | |
| Democratic | Fern Rudin | 58,755 | 31.8 | |
| Libertarian | Gary Harber | 5,666 | 3.0 | |
| Total votes | 185,006 | 100.0 | ||
| Voter turnout | % | |||
| Republican hold | ||||
2004
| Party | Candidate | Votes | % | |
|---|---|---|---|---|
| Republican | Elton Gallegly (incumbent) | 178,660 | 62.9 | |
| Democratic | Brett Wagner | 96,397 | 33.9 | |
| Green | Stuart A. Bechman | 9,321 | 3.2 | |
| Total votes | 284,378 | 100.0 | ||
| Voter turnout | % | |||
| Republican hold | ||||
2006
| Party | Candidate | Votes | % | |
|---|---|---|---|---|
| Republican | Elton Gallegly (incumbent) | 129,812 | 62.1 | |
| Democratic | Jill M. Martinez | 79,461 | 37.9 | |
| No party | Michael Kurt Stettler (write-in) | 16 | 0.0% | |
| No party | Henry Nicolle (write-in) | 3 | 0.0% | |
| Total votes | 209,292 | 100.0 | ||
| Voter turnout | % | |||
| Republican hold | ||||
2008
[43]| Party | Candidate | Votes | % | |
|---|---|---|---|---|
| Republican | Elton Gallegly (incumbent) | 174,492 | 58.20 | |
| Democratic | Marta Ann Jorgensen | 125,560 | 41.80 | |
| Voter turnout | % | |||
| Republican hold | ||||
2010
[45]| Party | Candidate | Votes | % | |
|---|---|---|---|---|
| Republican | Elton Gallegly (incumbent) | 144,055 | 59.94 | |
| Democratic | Timothy J. Allison | 96,279 | 40.06 | |
| Voter turnout | % | |||
| Republican hold | ||||
2012
| California's 24th congressional district election, 2012 | ||||
|---|---|---|---|---|
| Primary election | ||||
| Party | Candidate | Votes | % | |
| Democratic | Lois Capps (incumbent) | 72,356 | 46.4 | |
| Republican | Abel Maldonado | 46,295 | 29.7 | |
| Republican | Chris Mitchum | 33,604 | 21.5 | |
| No party preference | Matt Boutté | 3,832 | 2.5 | |
| Total votes | 156,087 | 100.0 | ||
| General election | ||||
| Democratic | Lois Capps (incumbent) | 156,749 | 55.1 | |
| Republican | Abel Maldonado | 127,746 | 44.9 | |
| Total votes | 284,495 | 100.0 | ||
| Democratic hold | ||||
2014
| California's 24th congressional district election, 2014[48] | ||||
|---|---|---|---|---|
| Primary election | ||||
| Party | Candidate | Votes | % | |
| Democratic | Lois Capps (incumbent) | 45,482 | 44.5 | |
| Republican | Christopher Mitchum | 15,927 | 15.6 | |
| Republican | Justin Donald Fareed | 15,013 | 14.7 | |
| Republican | Dale Francisco | 12,256 | 12.0 | |
| Republican | Bradley Allen | 6,573 | 6.4 | |
| Democratic | Sandra J. Marshall-Eminger | 3,675 | 3.6 | |
| Democratic | Paul H. Coyne, Jr. | 1,753 | 1.7 | |
| No party preference | Steve Isakson | 947 | 0.9 | |
| Republican | Alexis Stuart | 527 | 0.5 | |
| Total votes | 102,153 | 100.00 | ||
| General election | ||||
| Democratic | Lois Capps (incumbent) | 103,228 | 52% | |
| Republican | Christopher Mitchum | 95,566 | 48% | |
| Total votes | 198,794 | 100% | ||
| Democratic hold | ||||
Living former Members
As of April 2015, there are four former members of the U.S. House of Representatives from California's 24th congressional district that are currently living.
| Representative | Term in office | Date of birth (and age) |
|---|---|---|
| Henry Waxman | 1975 - 1993 | September 12, 1939 |
| Anthony C. Beilenson | 1993 - 1997 | October 26, 1932 |
| Brad Sherman | 1997 - 2003 | October 24, 1954 |
| Elton Gallegly | 2003 - 2013 | March 7, 1944 |
Historical district boundaries
See also
References
- ↑ http://www.latimes.com/la-redistricting-map-july-2011,0,5339409.htmlstory#39.71057374407184,-118.14590136718749,5,usCongress,,,current
- ↑
- ↑ (2008 Presidential election) Archived June 12, 2009, at the Wayback Machine.
- ↑ Statement of Vote (2006 Governor)
- ↑ Statement of Vote (2006 Senator)
- ↑ Statement of Vote (2004 President)
- ↑ Statement of Vote (2004 Senator)
- ↑ Statement of Vote (2003 Recall Question)
- ↑ Statement of Vote (2003 Governor)
- ↑ Statement of Vote (2002 Governor)
- ↑ Statement of Vote (2000 President)
- ↑ Statement of Vote (2000 Senator)
- ↑ 1952 election results
- ↑ 1953 special election results
- ↑ 1954 election results
- ↑ 1956 election results
- ↑ 1958 election results
- ↑ 1960 election results
- ↑ 1962 election results
- ↑ 1964 election results
- ↑ 1966 election results
- ↑ 1968 election results
- ↑ 1970 special election results
- ↑ 1970 election results
- ↑ 1972 election results
- ↑ 1974 election results
- ↑ 1976 election results
- ↑ 1978 election results
- ↑ 1980 election results
- ↑ 1982 election results
- ↑ 1984 election results
- ↑ 1986 election results
- ↑ 1988 election results
- ↑ 1990 election results
- ↑ 1992 election results
- ↑ 1994 election results
- ↑ 1996 election results
- ↑ 1998 election results
- ↑ 2000 election results
- ↑ 2002 general election results Archived February 3, 2009, at the Wayback Machine.
- ↑ 2004 general election results
- ↑ 2006 general election results Archived November 27, 2008, at the Wayback Machine.
- ↑ Statement of Vote November 4, 2008, General Election
- ↑ STATISTICS OF THE PRESIDENTIAL AND CONGRESSIONAL ELECTION OF NOVEMBER 4, 2008
- ↑ Statement of Vote November 2, 2010, General Election
- ↑ STATISTICS OF THE PRESIDENTIAL AND CONGRESSIONAL ELECTION OF NOVEMBER 2, 2010
- ↑ U.S. House of Representatives District 24 - Districtwide Results
- ↑ http://vote.sos.ca.gov/returns/us-rep/district/24/
External links
- GovTrack.us: California's 24th congressional district
- RAND California Election Returns: District Definitions
- California Voter Foundation map - CD24
Coordinates: 34°36′N 119°42′W / 34.6°N 119.7°W