California's 36th congressional district
| California's 36th congressional district | ||
|---|---|---|
.tif.png) | ||
| Current Representative | Raul Ruiz (D–Palm Desert) | |
| Population (2015) | 750,645[1] | |
| Median income | $46,471 | |
| Ethnicity | 69.4% White, 4.8% Black, 3.2% Asian, 49.8% Hispanic, 1.2% Native American, 18.2% other | |
| Cook PVI | R+1 | |
California's 36th congressional district is a congressional district in the U.S. state of California based in eastern Riverside County. The district covers most of the desert communities of Palm Springs, Palm Desert, Indio, Coachella, Rancho Mirage, Desert Hot Springs, Indian Wells, and Cathedral City in the Inland Empire.
The district is represented by Democrat Raul Ruiz, who won California's 36th congressional district election against redistricted Mary Bono Mack in 2012. Ruiz has represented the district since January 3, 2013.
Voting
| Year | Office | Winner in this district | Winner overall |
|---|---|---|---|
| 1992 | President | Clinton 41.3 - 35.5% | Clinton |
| U.S. Senator: Class 3 | Herschensohn 47.9 - 44.4% | Boxer | |
| U.S. Senator: Class 1 (Special) | Feinstein 50.3 - 42.3% | Feinstein | |
| 1994 | Governor | [Data unknown/missing. You can help!] | Wilson |
| U.S. Senator: Class 1 | [Data unknown/missing. You can help!] | Feinstein | |
| 1996 | President[2] | Clinton 46.7 - 41.4% | Clinton |
| 1998 | Governor[3] | Davis 54.4 - 42.4% | Davis |
| U.S. Senator:[4] Class 3 | Boxer 48.8 - 48% | Boxer | |
| 2000 | President[5] | Gore 50.7 - 44.3% | Bush |
| U.S. Senator:[6] Class 1 | Feinstein 53.4 - 39.4% | Feinstein | |
| 2002 | Governor[7] | Davis 49.5 - 39.8% | Davis |
| 2003 | Recall[8][9] | |
|
| Schwarzenegger 48.4 - 32.2% | Schwarzenegger | ||
| 2004 | President[10] | Kerry 59.0 - 39.6% | Bush |
| U.S. Senator:[11] Class 3 | Boxer 61.9 - 32.8% | Boxer | |
| 2006 | Governor[12] | Schwarzenegger 52.5 - 42.6% | Schwarzenegger |
| U.S. Senator:[13] Class 1 | Feinstein 63.4 - 31.1% | Feinstein | |
| 2008 | President[14] | Obama 64.4 - 33.5% | Obama |
| 2010 | Governor[15] | Brown 56.3 - 38.8% | Brown |
| U.S. Senator:[16] Class 3 | Boxer 56.1 - 38.9% | Boxer | |
| 2012 | President[17] | Obama 50.7 - 47.5% | Obama |
List of representatives
| Representative | Party | Dates | Notes | Counties |
|---|---|---|---|---|
| District created | January 3, 1963 | |||
.jpg) Bob Wilson Bob Wilson |
Republican | January 3, 1963 – January 3, 1973 |
Redistricted from the 30th district Redistricted to the 40th district |
San Diego (City of San Diego) |
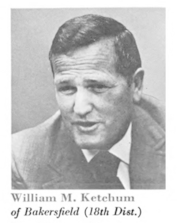 William M. Ketchum William M. Ketchum |
Republican | January 3, 1973 – January 3, 1975 |
Redistricted to the 18th district | Kern, Kings, inland San Luis Obispo, coastal Santa Barbara |
 George Brown, Jr. George Brown, Jr. |
Democratic | January 3, 1975 – January 3, 1993 |
Redistricted from the 38th district Redistricted to the 42nd district |
Riverside, San Bernardino (Inland Empire) |
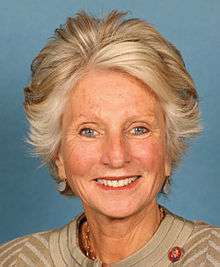 Jane Harman Jane Harman |
Democratic | January 3, 1993 – January 3, 1999 |
Retired to run for governor | Southwestern Los Angeles |
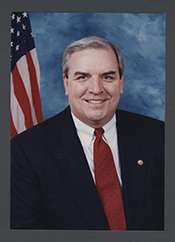 Steven T. Kuykendall Steven T. Kuykendall |
Republican | January 3, 1999 – January 3, 2001 |
Lost re-election | |
| Jane Harman |
Democratic | January 3, 2001 – February 28, 2011 |
Resigned to become head of the Woodrow Wilson International Center for Scholars | |
 Janice Hahn Janice Hahn |
Democratic | July 12, 2011 – January 3, 2013 |
Redistricted to the 44th district | |
 Raul Ruiz Raul Ruiz |
Democratic | January 3, 2013 – present |
eastern Riverside County (Palm Springs) | |
Election results
|
1962 • 1964 • 1966 • 1968 • 1970 • 1972 • 1974 • 1976 • 1978 • 1980 • 1982 • 1984 • 1986 • 1988 • 1990 • 1992 • 1994 • 1996 • 1998 • 2000 • 2002 • 2004 • 2006 • 2008 • 2010 • 2011 (Special) • 2012 • 2014 |
1962
| Party | Candidate | Votes | % | |
|---|---|---|---|---|
| Republican | Bob Wilson (incumbent) | 91,626 | 61.8 | |
| Democratic | William C. Godfrey | 56,637 | 38.2 | |
| Total votes | 148,263 | 100.0 | ||
| Voter turnout | % | |||
| Republican hold | ||||
1964
| Party | Candidate | Votes | % | |
|---|---|---|---|---|
| Republican | Bob Wilson (incumbent) | 105,346 | 59.1 | |
| Democratic | Quintin Whelan | 73,034 | 40.9 | |
| Total votes | 178,380 | 100.0 | ||
| Voter turnout | % | |||
| Republican hold | ||||
1966
| Party | Candidate | Votes | % | |
|---|---|---|---|---|
| Republican | Bob Wilson (incumbent) | 119,274 | 72.9 | |
| Democratic | Don Lindgren | 44,365 | 27.1 | |
| Total votes | 163,639 | 100.0 | ||
| Voter turnout | % | |||
| Republican hold | ||||
1968
| Party | Candidate | Votes | % | |
|---|---|---|---|---|
| Republican | Bob Wilson (incumbent) | 147,772 | 71.6 | |
| Democratic | Don Lindgren | 58,578 | 28.4 | |
| Total votes | 206,350 | 100.0 | ||
| Voter turnout | % | |||
| Republican hold | ||||
1970
| Party | Candidate | Votes | % | |
|---|---|---|---|---|
| Republican | Bob Wilson (incumbent) | 132,446 | 71.5 | |
| Democratic | Daniel K. Hostetter | 44,841 | 24.2 | |
| Peace and Freedom | Walter H. Koppelman | 5,139 | 2.8 | |
| American Independent | Orville J. Davis | 2,723 | 1.5 | |
| Total votes | 185,149 | 100.0 | ||
| Voter turnout | % | |||
| Republican hold | ||||
1972
| Party | Candidate | Votes | % | ||
|---|---|---|---|---|---|
| Republican | William M. Ketchum | 87,984 | 52.7 | ||
| Democratic | Timothy Lemucchi | 72,516 | 43.5 | ||
| American Independent | William M. "Bill" Armour | 6,307 | 3.8 | ||
| Total votes | 166,807 | 100.0 | |||
| Voter turnout | % | ||||
| Republican win (new seat) | |||||
1974
| Party | Candidate | Votes | % | |
|---|---|---|---|---|
| Democratic | George Brown, Jr. (inc.) | 69,615 | 62.6 | |
| Republican | Jim Osgood | 35,858 | 32.3 | |
| American Independent | William E. Pasley | 5,701 | 5.1 | |
| Total votes | 111,174 | 100.0 | ||
| Voter turnout | % | |||
| Democratic hold | ||||
1976
| Party | Candidate | Votes | % | |
|---|---|---|---|---|
| Democratic | George Brown, Jr. (inc.) | 90,830 | 61.6 | |
| Republican | Grant Carner | 49,368 | 33.5 | |
| American Independent | William E. Pasley | 7,358 | 5.0 | |
| Total votes | 147,556 | 100.0 | ||
| Voter turnout | % | |||
| Democratic hold | ||||
1978
| Party | Candidate | Votes | % | |
|---|---|---|---|---|
| Democratic | George Brown, Jr. (inc.) | 80,448 | 62.9 | |
| Republican | Dana Warren Carmody | 47,417 | 37.1 | |
| Total votes | 127,865 | 100.0 | ||
| Voter turnout | % | |||
| Democratic hold | ||||
1980
| Party | Candidate | Votes | % | |
|---|---|---|---|---|
| Democratic | George Brown, Jr. (inc.) | 88,628 | 52.5 | |
| Republican | John Paul Stark | 73,247 | 43.4 | |
| Libertarian | Harry J. Histen | 6,815 | 4.0 | |
| Total votes | 168,690 | 100.0 | ||
| Voter turnout | % | |||
| Democratic hold | ||||
1982
| Party | Candidate | Votes | % | |
|---|---|---|---|---|
| Democratic | George Brown, Jr. (inc.) | 76,546 | 54.3 | |
| Republican | John Paul Stark | 64,361 | 45.7 | |
| Total votes | 140,907 | 100.0 | ||
| Voter turnout | % | |||
| Democratic hold | ||||
1984
| Party | Candidate | Votes | % | |
|---|---|---|---|---|
| Democratic | George Brown, Jr. (inc.) | 104,438 | 56.6 | |
| Republican | John Paul Stark | 80,212 | 43.4 | |
| Total votes | 184,650 | 100.0 | ||
| Voter turnout | % | |||
| Democratic hold | ||||
1986
| Party | Candidate | Votes | % | |
|---|---|---|---|---|
| Democratic | George Brown, Jr. (inc.) | 78,118 | 57.1 | |
| Republican | Robert L. "Bob" Henley | 58,660 | 42.9 | |
| Total votes | 136,778 | 100.0 | ||
| Voter turnout | % | |||
| Democratic hold | ||||
1988
| Party | Candidate | Votes | % | |
|---|---|---|---|---|
| Democratic | George Brown, Jr. (inc.) | 103,493 | 54.0 | |
| Republican | John Paul Stark | 81,413 | 42.5 | |
| Libertarian | Kenneth E. Valentine | 3,382 | 1.8 | |
| American Independent | Fred L. Anderson | 3,360 | 1.8 | |
| Total votes | 191,648 | 100.0 | ||
| Voter turnout | % | |||
| Democratic hold | ||||
1990
| Party | Candidate | Votes | % | |
|---|---|---|---|---|
| Democratic | George Brown, Jr. (inc.) | 72,409 | 52.7 | |
| Republican | Bob Hammock | 64,961 | 47.3 | |
| Total votes | 137,370 | 100.0 | ||
| Voter turnout | % | |||
| Democratic hold | ||||
1992
| Party | Candidate | Votes | % | |
|---|---|---|---|---|
| Democratic | Jane Harman | 125,751 | 48.4 | |
| Republican | Joan Milke Flores | 109,684 | 42.2 | |
| Green | Richard Greene | 13,297 | 5.1 | |
| Peace and Freedom | Owen Stanley | 5,519 | 2.1 | |
| Libertarian | Marc F. Denny | 5,504 | 2.1 | |
| No party | Martz (write-in) | 2 | 0.0% | |
| Total votes | 259,757 | 100.0 | ||
| Voter turnout | % | |||
| Democratic hold | ||||
1994
| Party | Candidate | Votes | % | |
|---|---|---|---|---|
| Democratic | Jane Harman (incumbent) | 93,939 | 47.98 | |
| Republican | Susan Brooks | 93,127 | 47.56 | |
| Libertarian | Jack Tyler | 4,932 | 2.52 | |
| American Independent | Joseph J. "Joe" Fields | 3,810 | 1.95 | |
| Total votes | 195,808 | 100.0 | ||
| Voter turnout | % | |||
| Democratic hold | ||||
1996
| Party | Candidate | Votes | % | |
|---|---|---|---|---|
| Democratic | Jane Harman (incumbent) | 117,752 | 52.5 | |
| Republican | Susan Brooks | 98,538 | 44.0 | |
| Libertarian | Bruce Dovner | 4,933 | 2.1 | |
| Natural Law | Bradley McManus | 3,236 | 1.4 | |
| Total votes | 224,459 | 100.0 | ||
| Voter turnout | % | |||
| Democratic hold | ||||
1998
| Party | Candidate | Votes | % | |||
|---|---|---|---|---|---|---|
| Republican | Steven T. Kuykendall | 88,843 | 48.89 | |||
| Democratic | Janice Hahn | 84,624 | 46.57 | |||
| Green | Robin Barrett | 3,612 | 1.99 | |||
| Libertarian | Kerry Welsh | 3,066 | 1.69 | |||
| Reform | John R. Konopka | 1,561 | 0.86 | |||
| Total votes | 181,706 | 100.0 | ||||
| Voter turnout | % | |||||
| Republican gain from Democratic | ||||||
2000
| Party | Candidate | Votes | % | |||
|---|---|---|---|---|---|---|
| Democratic | Jane Harman | 115,651 | 48% | |||
| Republican | Steven T. Kuykendall (inc.) | 111,199 | 47% | |||
| Libertarian | Daniel R. Sherman | 6,073 | 3% | |||
| Reform | John R. Konopka | 3,549 | 1% | |||
| Natural Law | Matt Ornati | 2,264 | 1% | |||
| Republican | William D. Davies (write-in) | 395 | 0.1% | |||
| Total votes | 239,131 | 100% | ||||
| Voter turnout | % | |||||
| Democratic gain from Republican | ||||||
2002
| Party | Candidate | Votes | % | |
|---|---|---|---|---|
| Democratic | Jane Harman (incumbent) | 88,198 | 61% | |
| Republican | Stuart Johnson | 50,328 | 35% | |
| Libertarian | Mark McSpadden | 5,225 | 4% | |
| Total votes | 143,751 | 100% | ||
| Voter turnout | % | |||
| Democratic hold | ||||
2004
| Party | Candidate | Votes | % | |
|---|---|---|---|---|
| Democratic | Jane Harman (incumbent) | 151,208 | 62% | |
| Republican | Paul Whitehead | 81,666 | 34% | |
| Peace and Freedom | Alice Stek | 6,105 | 2% | |
| Libertarian | Mike Binkley | 5,065 | 2% | |
| Total votes | 244,144 | 100.0 | ||
| Voter turnout | % | |||
| Democratic hold | ||||
2006
| Party | Candidate | Votes | % | |
|---|---|---|---|---|
| Democratic | Jane Harman (incumbent) | 105,323 | 63% | |
| Republican | Brian Gibson | 53,068 | 32% | |
| Peace and Freedom | James R. Smith | 4,592 | 3% | |
| Libertarian | Mike Binkley | 3,170 | 2% | |
| Total votes | 166,153 | 100% | ||
| Voter turnout | % | |||
| Democratic hold | ||||
2008
| Party | Candidate | Votes | % | |
|---|---|---|---|---|
| Democratic | Jane Harman (incumbent) | 171,948 | 69% | |
| Republican | Brian Gibson | 78,543 | 31% | |
| Total votes | 250,491 | 100% | ||
| Voter turnout | % | |||
| Democratic hold | ||||
2010
| Party | Candidate | Votes | % | |
|---|---|---|---|---|
| Democratic | Jane Harman (incumbent) | 114,489 | 60% | |
| Republican | Mattie Fein | 66,706 | 35% | |
| Libertarian | Herb Peters | 10,840 | 5% | |
| Total votes | 192,035 | 100% | ||
| Voter turnout | % | |||
| Democratic hold | ||||
2011 (Special)
| Party | Candidate | Votes | % | |
|---|---|---|---|---|
| Democratic | Janice Hahn | 47,000 | 55% | |
| Republican | Craig Huey | 38,624 | 45% | |
| Total votes | 85,624 | 100% | ||
| Voter turnout | 25.00% | |||
| Democratic hold | ||||
2012
| Party | Candidate | Votes | % | |
|---|---|---|---|---|
| Democratic | Raul Ruiz | 110,189 | 53% | |
| Republican | Mary Bono Mack (incumbent) | 97,953 | 47% | |
| Total votes | 208,142 | 100% | ||
| Democratic hold | ||||
2014
| Party | Candidate | Votes | % | |
|---|---|---|---|---|
| Democratic | Raul Ruiz (incumbent) | 72,682 | 54% | |
| Republican | Brian Nestande | 61,457 | 46% | |
| Total votes | 134,139 | 100% | ||
| Democratic hold | ||||
Living former Members
As of April 2015, there are three former members of the U.S. House of Representatives from California's 36th congressional district that are currently living.
| Representative | Term in office | Date of birth (and age) |
|---|---|---|
| Jane Harman | 1993 - 1999 2001 - 2011 |
June 28, 1945 |
| Steven T. Kuykendall | 1999 - 2001 | January 26, 1947 |
| Janice Hahn | 2011 - 2013 | August 15, 1938 |
References
- ↑ https://www.census.gov/mycd/
- ↑ California Secretary of State. "Statement of Vote (1996 President)" (PDF). California Secretary of State. Retrieved 2011-07-12.
- ↑ California Secretary of State. "Statement of Vote (1998 Governor)" (PDF). California Secretary of State. Retrieved 2011-07-12.
- ↑ California Secretary of State. "Statement of Vote (1998 Senator)" (PDF). California Secretary of State. Retrieved 2011-07-12.
- ↑ "Statement of Vote (2000 President)" (PDF). Retrieved 2011-05-13.
- ↑ "Statement of Vote (2000 Senator)" (PDF). Retrieved 2011-05-13.
- ↑ "Statement of Vote (2002 Governor)" (PDF). Retrieved 2011-05-13.
- ↑ "Statement of Vote (2003 Recall Question)" (PDF). Retrieved 2011-05-13.
- ↑ "gov ssov alpha by cd formatted.xls" (PDF). Retrieved 2011-05-13.
- ↑ "Statement of Vote (2004 President)" (PDF). Retrieved 2011-05-13.
- ↑ "Statement of Vote (2004 Senator)" (PDF). Retrieved 2011-05-13.
- ↑ "Statement of Vote (2006 Governor)" (PDF). Retrieved 2011-05-13.
- ↑ "Statement of Vote (2006 Senator)" (PDF). Retrieved 2011-05-13.
- ↑ (2008 President)
- ↑ California Secretary of State. "Statement of Vote (2010 Governor)" (PDF). California Secretary of State. Retrieved 2011-07-12.
- ↑ California Secretary of State. "Statement of Vote (2010 Senator)" (PDF). California Secretary of State. Retrieved 2011-07-12.
- ↑
- ↑ http://clerk.house.gov/member_info/electionInfo/1962election.pdf
- ↑ http://clerk.house.gov/member_info/electionInfo/1964election.pdf
- ↑ http://clerk.house.gov/member_info/electionInfo/1966election.pdf
- ↑ http://clerk.house.gov/member_info/electionInfo/1968election.pdf
- ↑ http://clerk.house.gov/member_info/electionInfo/1970election.pdf
- ↑ http://clerk.house.gov/member_info/electionInfo/1972election.pdf
- ↑ http://clerk.house.gov/member_info/electionInfo/1974election.pdf
- ↑ http://clerk.house.gov/member_info/electionInfo/1976election.pdf
- ↑ http://clerk.house.gov/member_info/electionInfo/1978election.pdf
- ↑ http://clerk.house.gov/member_info/electionInfo/1980election.pdf
- ↑ http://clerk.house.gov/member_info/electionInfo/1982election.pdf
- ↑ 1984 election results
- ↑ 1986 election results
- ↑ 1988 election results
- ↑ 1990 election results
- ↑ 1992 election results
- ↑ 1994 election results
- ↑ 1996 election results
- ↑ 1998 election results
- ↑ 2000 election results
- ↑ 2002 general election results Archived February 3, 2009, at the Wayback Machine.
- ↑ 2004 general election results
- ↑ 2006 general election results Archived November 27, 2008, at the Wayback Machine.
- ↑ 2008 general election results Archived December 21, 2008, at the Wayback Machine.
- ↑ 2010 general election results
- ↑ 2011 special general election results
- ↑ 2012 general election results Archived October 19, 2013, at the Wayback Machine.
- ↑ 2014 general election results
External links
- GovTrack.us: California's 36th congressional district
- RAND California Election Returns: District Definitions
- California Voter Foundation map - CD36
Coordinates: 33°43′36″N 115°44′34″W / 33.72667°N 115.74278°W