Canadian federal election, 1935
| | |||||||||||||||||||||||||||||||||||||||||||||||||||||||||||||||||||||||||||||||||||||||||||||||||||
| |||||||||||||||||||||||||||||||||||||||||||||||||||||||||||||||||||||||||||||||||||||||||||||||||||
| |||||||||||||||||||||||||||||||||||||||||||||||||||||||||||||||||||||||||||||||||||||||||||||||||||
|
| |||||||||||||||||||||||||||||||||||||||||||||||||||||||||||||||||||||||||||||||||||||||||||||||||||
| |||||||||||||||||||||||||||||||||||||||||||||||||||||||||||||||||||||||||||||||||||||||||||||||||||
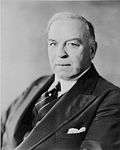

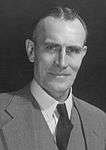

The Canadian federal election of 1935 was held on October 14, 1935 to elect members of the Canadian House of Commons of the 18th Parliament of Canada. The Liberal Party of William Lyon Mackenzie King won a majority government, defeating Prime Minister R.B. Bennett's Conservative Party.
The central issue was the economy, which was still in the depths of the Great Depression. Bennett, in office since the 1930 election, had done little to stimulate the economy during his first few years, believing that a policy of high tariffs and trade within the British Empire would correct the depression. In the last months of his time in office, he reversed his position, however, copying the popular New Deal of Franklin Roosevelt in the United States. Upset about high unemployment and inaction by the federal government, voters were unwilling to allow the Conservatives to continue to govern, despite their change of policy.
The Conservatives were also suffering severe internal divisions. During his first years in office, Bennett had alienated those in his party who supported intervention in the economy. His last minute conversion to interventionism alienated the rest of the party. Former cabinet minister H.H. Stevens left to form the Reconstruction Party. Senior minister Sir Joseph Flavelle announced he would be supporting the Liberals.
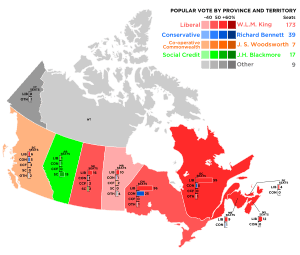
Voters opted for Mackenzie King's promise of mild reforms to restore economic health. The Liberals crushed the Tories, winning 171[1] seats to the Conservatives' 39, the worst ever performance by the Tories until their collapse in 1993. The Liberal Party would continue to hold power until 1957.
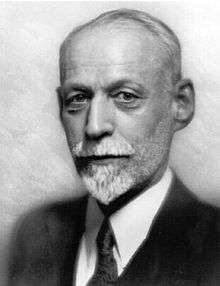
The 1935 election was also important in it saw the final demise of the Progressive Party and the United Farmers of Alberta. Two new movements rose out of the west, however. The new Co-operative Commonwealth Federation, a social democratic party, first competed in this election and won seven seats, promising social reform. The Social Credit Party of Canada was even more successful, capturing seventeen seats on its platform of monetary reform despite winning less of the popular vote than the former.

National results
| ↓ | ||||
| 173 | 39 | 17 | 7 | 9 |
| Liberal | Conservative | SC | CCF | O |
| Party | Party leader | # of candidates |
Seats | Popular vote | |||||
|---|---|---|---|---|---|---|---|---|---|
| 1930 | Elected | % Change | # | % | pp Change | ||||
| Liberal | W. L. Mackenzie King | 245 | 90 | 171 | +92.2% | 1,967,839 | 44.68% | +0.65 | |
| Conservative | R. B. Bennett | 228 | 134 | 39 | -70.9% | 1,290,671 | 29.84% | -18.48 | |
| Social Credit | J. H. Blackmore | 46 | * | 17 | * | 180,679 | 4.10% | * | |
| Co-operative Commonwealth | J. S. Woodsworth | 121 | * | 7 | * | 410,125 | 9.31% | * | |
| Liberal–Progressive | 5 | 3 | 4 | +33.3% | 29,569 | 0.67% | -0.48 | ||
| Reconstruction | H.H. Stevens | 172 | * | 1 | * | 384,462 | 8.73% | * | |
| Independent Liberal | 24 | - | 1 | 54,239 | 1.23% | +0.86 | |||
| Independent | 13 | 2 | 1 | -50.0% | 17,207 | 0.39% | -0.16 | ||
| United Farmers of Ontario-Labour | 1 | - | 1 | 7,210 | 0.39% | +0.16 | |||
| Independent Conservative | 4 | - | 1 | 1,078 | 0.02% | -0.24 | |||
| Communist | Tim Buck | 12 | - | - | - | 20,140 | 0.46% | +0.34 | |
| Labour | 5 | 2 | - | -100% | 14,423 | 0.33% | -0.35 | ||
| Progressive-Conservative | 2 | 1 | - | -100% | 12,220 | 0.28% | -0.13 | ||
| Verdun | 1 | * | - | * | 4,214 | 0.10% | * | ||
| Anti-Communist | 1 | * | - | * | 3,961 | 0.09% | * | ||
| Unknown | 3 | - | - | - | 3,407 | 0.08% | -0.11 | ||
| Independent Reconstructionist | 1 | * | 0 | * | 865 | 0.02% | * | ||
| Technocrat | 1 | * | 0 | * | 733 | 0.02% | * | ||
| Liberal-Labour | 3 | - | - | - | 708 | 0.02% | -0.17 | ||
| Socialist | 1 | * | - | * | 251 | 0.01% | * | ||
| Independent Labour | 1 | - | - | - | 221 | 0.01% | -0.41 | ||
| Veteran | 1 | * | - | * | 79 | x | * | ||
| Total | 891 | 245 | 245 | - | 4,404,301 | 100% | |||
| Sources: http://www.elections.ca -- History of Federal Ridings since 1867 | |||||||||
Notes:
* The party did not nominate candidates in the previous election.
x - less than 0.005% of the popular vote
Vote and seat summaries
Results by province
| Party name | BC | AB | SK | MB | ON | QC | NB | NS | PE | YK | Total | ||
|---|---|---|---|---|---|---|---|---|---|---|---|---|---|
| Liberal | Seats won by party: | 6 | 1 | 16 | 10 | 56 | 59 | 9 | 12 | 4 | - | 173 | |
| Popular Vote (%): | 31.8 | 21.6 | 40.8 | 31.7 | 42.2 | 56.0 | 57.2 | 52.7 | 58.3 | 44.4 | 44.7 | ||
| Conservative | Seats: | 5 | 1 | 1 | 1 | 25 | 5 | 1 | - | - | 39 | ||
| Vote: | 24.9 | 17.6 | 18.0 | 27.9 | 35.8 | 27.5 | 31.9 | 34.5 | 38.4 | 29.8 | |||
| Co-operative Commonwealth | Seats: | 3 | - | 2 | 2 | - | - | 7 | |||||
| Vote: | 32.7 | 12.0 | 21.3 | 19.4 | 8.0 | 0.6 | 8.8 | ||||||
| Social Credit | Seats: | - | 15 | 2 | - | 17 | |||||||
| Vote: | 0.6 | 46.6 | 17.8 | 2.0 | 4.1 | ||||||||
| Liberal-Progressive | Seats: | 4 | 4 | ||||||||||
| Vote: | 10.5 | 0.7 | |||||||||||
| Reconstruction | Seats: | 1 | - | - | - | - | - | - | - | - | 1 | ||
| Vote: | 7.3 | 0.7 | 1.3 | 5.9 | 11.4 | 9.3 | 9.7 | 12.7 | 3.4 | 8.7 | |||
| Independent Liberal | Seats: | - | - | 1 | - | - | 1 | ||||||
| Vote: | 0.2 | 0.6 | 3.8 | 0.4 | 3 | 1.2 | |||||||
| Independent | Seats: | 1 | - | - | - | - | 1 | ||||||
| Vote: | 1.8 | 0.1 | 0.2 | 0.7 | 0.8 | 0.4 | |||||||
| UFO-Labour | Seats: | 1 | 1 | ||||||||||
| Vote: | 0.5 | 0.2 | |||||||||||
| Independent Conservative | Seats: | - | 1 | 1 | |||||||||
| Vote: | xx | 55.6 | xx | ||||||||||
| Total Seats | 16 | 17 | 21 | 17 | 82 | 65 | 10 | 12 | 4 | 1 | 245 | ||
| Parties that won no seats: | |||||||||||||
| Communist | Vote: | 0.5 | 1.1 | 0.8 | 0.7 | 0.5 | 0.3 | 0.5 | |||||
| Farmer-Labour | Vote: | 0.3 | 0.5 | 0.5 | 0.3 | ||||||||
| Progressive-Conservative | Vote: | 0.5 | 0.7 | 0.1 | |||||||||
| Verdun | Vote: | 0.4 | 0.1 | ||||||||||
| Anti-Communist | Vote: | 0.2 | 0.1 | ||||||||||
| Unknown | Vote: | 0.x | 0.x | 0.1 | |||||||||
| Independent Reconstruction | Vote: | 0.1 | xx | ||||||||||
| Technocrat | Vote: | 0.3 | xx | ||||||||||
| Liberal-Labour | Vote: | 0.1 | xx | ||||||||||
| Socialist | Vote: | 0.1 | xx | ||||||||||
| Independent Labour | Vote: | 0.x | xx | ||||||||||
| Veteran | Vote: | 0.x | xx | ||||||||||
- xx - less than 0.05% of the popular vote
See also
- List of Canadian federal general elections
- List of political parties in Canada
- 18th Canadian Parliament
Further reading
- Canadian Annual Review 1935-1936 (1937)
- H. Blair Neatby, William Lyon Mackenzie King: 1932-1939 (1976)
- J. R. H. Wilbur (1968). The Bennett new deal: fraud or portent?. Copp Clark.