Canadian federal election, 1940
| | |||||||||||||||||||||||||||||||||||||||||||||||||||||||||||||||||||||||||||||||||||||||||||||||||||
| |||||||||||||||||||||||||||||||||||||||||||||||||||||||||||||||||||||||||||||||||||||||||||||||||||
| |||||||||||||||||||||||||||||||||||||||||||||||||||||||||||||||||||||||||||||||||||||||||||||||||||
|
| |||||||||||||||||||||||||||||||||||||||||||||||||||||||||||||||||||||||||||||||||||||||||||||||||||
| |||||||||||||||||||||||||||||||||||||||||||||||||||||||||||||||||||||||||||||||||||||||||||||||||||


The Canadian federal election of 1940 was the 19th general election in Canadian history. It was held March 26, 1940, to elect members of the Canadian House of Commons of the 19th Parliament of Canada. Prime Minister William Lyon Mackenzie King's Liberal Party was re-elected to their second consecutive majority government.
The election was overshadowed by the Second World War, which caused many Canadians to rally around the government. In response to this, the Conservative Party of Robert Manion ran on a platform advocating the creation of an all-party national unity government and ran under the name "National Government" in this election. Though Manion was personally opposed to conscription, the Liberals faced intense pressure in Quebec on the question and promised not to institute the measure. This promise was to haunt the Liberals as they faced increasing pressure from the military and especially from English Canada to bring in the measure. To release him from his 1940 promise, King called a plebiscite in 1942 on the question. See also Conscription Crisis of 1944. It was the most successful election for the Liberal Party in its history, in which it captured 73% of seats in the House of Commons.
Social Credit ran jointly with the New Democracy movement of William Duncan Herridge.
Some candidates of the Conservative and Social Credit parties insisted on running under the traditional names, however.
The Co-operative Commonwealth Federation (CCF) gained its first seat east of Manitoba, with the election of Clarence Gillis from Cape Breton Island. This election was the last one for its ailing leader, J.S. Woodsworth.

Voter turn-out: 69.9%
National results
| ↓ | |||||
| 179 | 39 | 8 | 7 | 3 | 9 |
| Liberal | NG/C | CCF | SC | ND | O |
| Party | Party leader | # of candidates |
Seats | Popular vote | |||||
|---|---|---|---|---|---|---|---|---|---|
| 1935 | Elected | % Change | # | % | pp Change | ||||
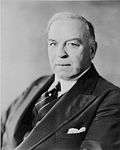
| Liberal | W. L. Mackenzie King | 242 | 173 | 179 | +2.3% | 2,365,979 | 51.32% | +6.64 | |
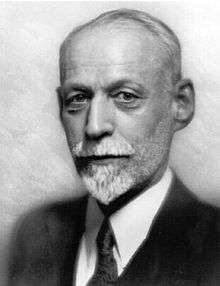
| National Government 1 | Robert Manion | 199 | * | 36 | - | 1,348,260 | 29.24% | +0.57 | |
| Conservative 1 | 8 | 39 | 3 | 53,799 | 1.17% | ||||
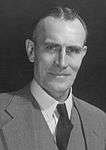
| Co-operative Commonwealth | J. S. Woodsworth | 93 | 7 | 8 | +14.3% | 388,103 | 8.42% | -1.07 | |
| Social Credit2 | J.H. Blackmore | 9 | 17 | 7 | -41.17% | 46,271 | 1.00% | -1.51 | |
| New Democracy2 | W.D. Herridge | 17 | * | 3 | 73,083 | 1.59% | |||
| Liberal–Progressive | 4 | 4 | 3 | -25.0% | 27,815 | 0.60% | -0.07 | ||
| Independent Liberal | 32 | 1 | 2 | +100% | 147,216 | 3.19% | +1.96 | ||
| Independent | 19 | 1 | 1 | - | 57,247 | 1.24% | +0.85 | ||
| Independent Conservative | 5 | 1 | 1 | - | 10,431 | 0.23% | +0.21 | ||
| Unity | 2 | * | 1 | * | 12,337 | 0.27% | * | ||
| United Reform Movement | 1 | * | 1 | * | 13,868 | 0.30% | * | ||
| Independent National | 2 | * | - | * | 12,710 | 0.28% | * | ||
| Unknown | 2 | - | - | - | 4,622 | 0.10% | +0.02 | ||
| Communist | Tim Buck | 8 | - | - | - | 8,699 | 0.19% | -0.27 | |
| Farmer-Labour | 2 | * | - | * | 8,126 | 0.18% | * | ||
| National Unity | 1 | * | - | * | 7,534 | 0.16% | * | ||
| NDP 3 | 2 | * | - | * | 6,761 | 0.15% | * | ||
| United Farmers of Ont.-Labour | 1 | - | - | - | 4,761 | 0.10% | -0.06 | ||
| Labour | 1 | - | - | - | 3,916 | 0.08% | -0.25 | ||
| United Progressive | 1 | * | - | * | 2,727 | 0.06% | * | ||
| National Liberal Progressive | 1 | * | - | * | 2,434 | 0.05% | * | ||
| National Labour | 1 | * | - | * | 2,354 | 0.05% | * | ||
| Anti-Conscriptionist | 1 | * | - | * | 642 | 0.01% | * | ||
| Canadian Labour | 1 | * | - | * | 398 | 0.01% | * | ||
| United Reform | 1 | * | - | * | 269 | 0.01% | * | ||
| Social Credit-National Unity | 1 | * | - | * | 241 | 0.01% | * | ||
| Total | 657 | 245 | 245 | -0.8% | 4,610,603 | 100% | |||
| Sources: http://www.elections.ca -- History of Federal Ridings since 1867 | |||||||||
Notes:
* The party did not nominate candidates in the previous election.
x - less than 0.005% of the popular vote
1 "Change" and "% Change% figures compare total of "National Government" and "Conservative" to 1935 Conservative vote.
2 New Democracy and Social Credit ran jointly under the New Democracy banner under the leadership of former Conservative William Duncan Herridge who had founded New Democracy in 1939 to promote his ideas monetary and economic reform, though several candidates continued to run under the old Social Credit name. The 3 New Democracy MPs elected were all Social Credit incumbents, including Social Credit parliamentary leader John Horne Blackmore while Herridge himself failed to win his seat. The party sat in the House of Commons under the New Democracy name until 1944 when its national convention voted to revert to the Social Credit name.
3Two candidates appear to have run under the "New Democratic Party" banner. It is unlikely that this was related in any way to the Cooperative Commonwealth Federation's adoption of this name in 1960. This may be a mis-reporting of party label - these candidates may have been "New Democracy" candidates.
Vote and seat summaries
Results by province
| Party name | BC | AB | SK | MB | ON | QC | NB | NS | PE | YK | Total | ||
|---|---|---|---|---|---|---|---|---|---|---|---|---|---|
| Liberal | Seats: | 10 | 7 | 12 | 13 | 56 | 62 | 5 | 10 | 4 | - | 179 | |
| Popular Vote: | 37.4 | 37.9 | 43.0 | 43.5 | 50.3 | 64.4 | 54.6 | 50.4 | 55.3 | 46.4 | 51.3 | ||
| National Government | Seats: | 4 | - | 2 | 1 | 22 | - | 5 | 1 | - | 1 | 36 | |
| Vote: | 28.8 | 13.0 | 14.1 | 26.2 | 40.2 | 18.0 | 43.4 | 40.1 | 44.7 | 53.6 | 30.0 | ||
| Conservative | Seats: | - | - | 3 | - | 3 | |||||||
| Vote: | 0.2 | 1.7 | 2.2 | 1.1 | 1.2 | ||||||||
| Co-operative Commonwealth | Seats: | 1 | - | 5 | 1 | - | - | - | 1 | 8 | |||
| Vote: | 28.4 | 13.0 | 27.5 | 19.6 | 3.8 | 0.7 | 0.4 | 6.0 | 8.6 | ||||
| Social Credit | Seats: | 7 | - | 7 | |||||||||
| Vote: | 16.5 | 0.6 | 1.0 | ||||||||||
| New Democracy | Seats: | - | 3 | - | - | - | 3 | ||||||
| Vote: | 0.1 | 18.0 | 3.3 | 0.4 | 0.9 | 1.6 | |||||||
| Liberal-Progressive | Seats: | 2 | 1 | 3 | |||||||||
| Vote: | 4.7 | 0.8 | 0.6 | ||||||||||
| Independent Liberal | Seats: | - | - | 2 | - | - | 2 | ||||||
| Vote: | xx | 1.0 | 10.2 | 1.6 | 3.3 | 3.3 | |||||||
| Independent | Seats: | 1 | - | - | - | - | - | - | 1 | ||||
| Vote: | 3.0 | 0.2 | 1.0 | 3.4 | 0.4 | 2.1 | 0.2 | 1.3 | |||||
| United Reform Movement | Seats: | 1 | 1 | ||||||||||
| Vote: | 3.7 | 0.3 | |||||||||||
| Unity | Seats: | 1 | 1 | ||||||||||
| Vote: | 3.3 | 0.3 | |||||||||||
| Independent Conservative | Seats: | 1 | 1 | ||||||||||
| Vote: | 0.9 | 0.2 | |||||||||||
| Total Seats | 16 | 17 | 21 | 17 | 82 | 65 | 10 | 12 | 4 | 1 | 245 | ||
| Parties that won no seats: | |||||||||||||
| Independent Nat. Gov. | Vote: | 0.1 | 1.1 | 0.3 | |||||||||
| Communist | Vote: | 0.4 | 0.3 | 0.6 | xx | 0.2 | 0.1 | 0.2 | |||||
| Farmer-Labour | Vote: | 0.5 | 0.2 | ||||||||||
| National Unity | Vote: | 2.0 | 0.2 | ||||||||||
| NDP (?) | Vote: | 1.6 | xx | 0.2 | |||||||||
| UFO-Labour | Vote: | 0.3 | 0.1 | ||||||||||
| Unknown | Vote: | 1.2 | xx | 0.1 | |||||||||
| Labour | Vote: | 0.3 | 0.1 | ||||||||||
| United Progressive | Vote: | 1.0 | 0.1 | ||||||||||
| National Liberal Progressive | Vote: | 0.2 | 0.1 | ||||||||||
| National Labour | Vote: | 0.2 | 0.1 | ||||||||||
| Anti-Conscriptionist | Vote: | 0.1 | xx | ||||||||||
| Canadian Labour | Vote: | xx | xx | ||||||||||
| United Reform | Vote: | 0.1 | xx | ||||||||||
- xx - less than 0.05% of the popular vote
See also
- List of Canadian federal general elections
- List of political parties in Canada
- 19th Canadian Parliament