Canadian federal election, 1945
| | |||||||||||||||||||||||||||||||||||||||||||||||||||||||||||||||||||||||||||||||||||||||
| |||||||||||||||||||||||||||||||||||||||||||||||||||||||||||||||||||||||||||||||||||||||
| |||||||||||||||||||||||||||||||||||||||||||||||||||||||||||||||||||||||||||||||||||||||
|
| |||||||||||||||||||||||||||||||||||||||||||||||||||||||||||||||||||||||||||||||||||||||
| |||||||||||||||||||||||||||||||||||||||||||||||||||||||||||||||||||||||||||||||||||||||


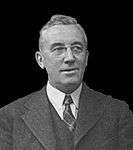
The Canadian federal election of 1945 was the 20th general election in Canadian history. It was held June 11, 1945 to elect members of the Canadian House of Commons of the 20th Parliament of Canada. Prime Minister William Lyon Mackenzie King's Liberal government was re-elected to its third consecutive government, although this time with a minority government as the Liberals fell 5 seats short of a majority.
Although the election officially resulted in a minority government, the election of eight "Independent Liberal" MPs, most of whom did not run as official Liberals because of their opposition to conscription (see Conscription Crisis of 1944), gave the King government an effective working majority in parliament. Most of the Independent Liberal MPs joined (or re-joined) the Liberal caucus following World War II when the conscription issue became moot. As King was defeated in his own riding of Prince Albert, fellow Liberal William MacDiarmid, who was re-elected in the safe seat of Glengarry, resigned so that a by-election could be held, which was subsequently won by King.
The federal election was the first since the victory of the Co-operative Commonwealth Federation in the Saskatchewan provincial election, and many predicted a major breakthrough for the CCF nationally. A Gallup poll from September 1943 showed the CCF with a one-point lead over both the Liberals and Conservatives. The party was expected to win 70 to 100 seats, possibly even enough to form a minority government. Despite the expectations, the party only won 28 seats.
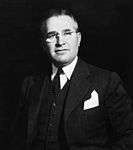
1945 was also the first test of the newly named Progressive Conservatives. The Conservative Party had changed its name in 1942 when former Progressive Party Premier of Manitoba John Bracken became its leader. The party improved its standing in terms of number of seats compared to the old Conservative Party, but also recorded a reduced share of the popular vote (indeed, the lowest in any election prior to 1993) and fell far short of challenging Liberal hegemony.
A key issue in this election seems to have been electing a stable government. The Liberals urged voters to "Return the Mackenzie King Government", and argued that only the Liberal Party had a "preponderance of members in all nine provinces". Mackenzie King threatened to call a new election if he was not given a majority: "We would have confusion to deal with at a time when the world will be in a very disturbed situation. The war in Europe is over, but unrest in the east is not over."
The Progressive Conservatives tried to capitalize on the massive mid-campaign victory by the Ontario Progressive Conservative Party in the 1945 Ontario provincial election. PC campaign ads exhorted voters to rally behind their party: "Ontario shows! Only Bracken can win!", and suggesting that it would be impossible to form a majority government in the country without a plurality of seats in Ontario, which only the Tories could win. In the event, the Liberals fell just short of a majority even though they won only 34 seats in Ontario to the PCs' 48 seats. Eight "Independent Liberal" MPs could be expected to support the government.
Social welfare programs were also an issue in the campaign. Another Liberal slogan encouraged voters to "Build a New Social Order" by endorsing the Liberal platform, which included
- $750 million to provide land, jobs and business support for veterans;
- $400 million of public spending to build housing;
- $250 million for family allowances;
- establishing an Industrial development Bank;
- loans to farmers, floor prices for agricultural products;
- tax reductions.
Campaigning under the slogan, "Work, Security, and Freedom for All -- with the CCF", the CCF promised to retain war-time taxes on high incomes and excess profits in order to fund social services, and to abolish the Canadian Senate. The CCF fought hard to prevent the support of labour from going to the Labor-Progressive Party (i.e., the Communist Party of Canada).
The LPP, for its part, pointed out that the CCF's refusal to enter into an electoral pact with the LPP had cost the CCF 100,000 votes in the Ontario election, and had given victory to the Ontario PCs. It urged voters to "Make Labour a Partner in Government."
The Social Credit Party of Canada tried, with modest success, to capitalize on the positive image of the Alberta Socred government of William Aberhart, asking voters, "Good Government in Alberta -- Why Not at Ottawa?". Referring to social credit monetary theories, the party encouraged voters to "Vote for the National Dividend".
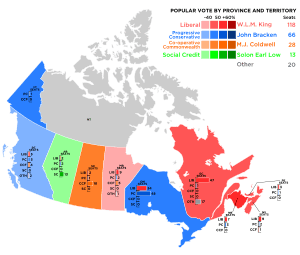
National results
| ↓ | ||||
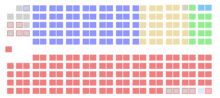
| 118 | 66 | 28 | 13 | 20 |
| Liberal | PC | CCF | SC | O |
| Party | Party leader | # of candidates |
Seats | Popular vote | |||||
|---|---|---|---|---|---|---|---|---|---|
| 1940 | Elected | % Change | # | % | pp Change | ||||
| Liberal | W. L. Mackenzie King | 236 | 177 | 118 | -33.9% | 2,086,545 | 39.78% | -11.54 | |
| Progressive Conservative1 | John Bracken | 203 | 39 | 66 | +66.7% | 1,448,744 | 27.62% | -2.79 | |
| Co-operative Commonwealth | M. J. Coldwell | 205 | 8 | 28 | +250% | 815,720 | 15.55% | +7.31 | |
| Social Credit2 | Solon Earl Low | 93 | 10 | 13 | +30.0% | 212,220 | 4.05% | +1.46 | |
| Independent Liberal | 20 | 2 | 8 | +300% | 93,791 | 1.79% | -1.40 | ||
| Independent | 64 | 1 | 6 | +500% | 256,381 | 4.89% | +3.65 | ||
| Bloc populaire | Maxime Raymond | 35 | * | 2 | * | 172,765 | 3.29% | * | |
| Labor–Progressive3 | Tim Buck | 68 | - | 1 | 111,892 | 2.13% | +1.94 | ||
| Independent PC | 8 | * | 1 | * | 14,541 | 0.28% | * | ||
| Independent CCF4 | 2 | * | 1 | * | 6,402 | 0.12% | * | ||
| Liberal–Progressive | 1 | 3 | 1 | -66.7% | 6,147 | 0.12% | -0.48 | ||
| National Government5 | 1 | - | 4,872 | 0.09% | |||||
| Trades Union | 1 | * | - | * | 4,679 | 0.09% | * | ||
| Farmer-Labour | 2 | - | - | - | 3,620 | 0.07% | -0.11 | ||
| Independent Conservative | 1 | - | - | -100% | 2,653 | 0.05% | -0.18 | ||
| Democratic | W.R.N. Smith | 5 | * | - | * | 2,603 | 0.05% | * | |
| Union of Electors | 1 | * | - | * | 596 | 0.01% | * | ||
| Socialist Labour | 2 | * | - | * | 459 | 0.01% | * | ||
| Labour | 1 | - | - | - | 423 | 0.01% | -0.07 | ||
| Liberal-Labour | 1 | * | - | * | 345 | 0.01% | * | ||
| Independent Labour | 1 | * | - | * | 241 | x | * | ||
| Unknown | 1 | - | - | - | 70 | x | x | ||
| Total | 952 | 245 | 245 | - | 5,245,709 | 100% | |||
| Sources: http://www.elections.ca -- History of Federal Ridings since 1867 | |||||||||
Notes:
* The party did not nominate candidates in the previous election.
x - less than 0.005% of the popular vote.
1 1945 Progressive Conservative vote compared to 1940 National Government + Conservative vote.
2 1945 Social Credit vote compared to 1940 New Democracy + Social Credit vote.
3 1945 Labor-Progressive vote compared to 1940 Communist vote.
4 The successful "Independent CCF" candidate ran as a People's Co-operative Commonwealth Federation candidate.
5 One Progressive Conservative candidate ran under the "National Government" label that the party had used in the 1940 election.
Vote and seat summaries
Results by province
| Party name | BC | AB | SK | MB | ON | QC | NB | NS | PE | YK | Total | ||
|---|---|---|---|---|---|---|---|---|---|---|---|---|---|
| Liberal | Seats: | 5 | 2 | 2 | 9 | 34 | 47 | 7 | 9 | 3 | 118 | ||
| Popular Vote: | 27.5 | 21.8 | 33.0 | 32.7 | 40.8 | 46.5 | 50.0 | 45.7 | 48.4 | 39.8 | |||
| Progressive Conservative | Seats: | 5 | 2 | 1 | 2 | 48 | 1 | 3 | 2 | 1 | 1 | 66 | |
| Vote: | 30.0 | 18.7 | 18.8 | 24.9 | 41.4 | 9.7 | 38.3 | 36.8 | 47.4 | 40.0 | 27.6 | ||
| Co-operative Commonwealth | Seats: | 4 | - | 18 | 5 | - | - | - | 1 | - | - | 28 | |
| Vote: | 29.4 | 18.4 | 44.4 | 31.6 | 14.3 | 2.4 | 7.4 | 16.7 | 4.2 | 27.5 | 15.6 | ||
| Social Credit | Seats: | - | 13 | - | - | - | - | 13 | |||||
| Vote: | 2.3 | 36.6 | 3.0 | 3.2 | 0.2 | 4.4 | 4.0 | ||||||
| Independent Liberal | Seats: | 1 | 7 | - | 8 | ||||||||
| Vote: | 1.7 | 5.9 | 1.1 | 1.8 | |||||||||
| Independent | Seats: | - | - | 6 | - | - | 6 | ||||||
| Vote: | 0.8 | 0.4 | 16.9 | 3.2 | 0.2 | 4.9 | |||||||
| Bloc populaire | Seats: | - | 2 | 2 | |||||||||
| Vote: | 0.3 | 11.9 | 3.3 | ||||||||||
| Labor–Progressive | Seats: | - | - | - | - | - | 1 | - | - | 1 | |||
| Vote: | 5.9 | 4.5 | 0.8 | 5.0 | 2.0 | 1.0 | 0.6 | 32.4 | 2.1 | ||||
| Independent PC | Seats: | - | 1 | 1 | |||||||||
| Vote: | xx | 1.0 | 0.3 | ||||||||||
| Independent CCF | Seats: | 1 | - | 1 | |||||||||
| Vote: | 1.4 | xx | 0.1 | ||||||||||
| Liberal-Progressive | Seats: | 1 | 1 | ||||||||||
| Vote: | 1.9 | 0.1 | |||||||||||
| Total Seats | 16 | 17 | 21 | 17 | 82 | 65 | 10 | 12 | 4 | 1 | 245 | ||
| Parties that won no seats: | |||||||||||||
| National Government | Vote: | 0.3 | 0.1 | ||||||||||
| Trades Union | Vote: | 1.1 | 0.1 | ||||||||||
| Farmer-Labour | Vote: | 0.2 | 0.1 | ||||||||||
| Independent Conservative | Vote: | 0.2 | 0.1 | ||||||||||
| Democratic | Vote: | 0.6 | xx | ||||||||||
| Union of Electors | Vote: | xx | xx | ||||||||||
| Socialist Labour | Vote: | 0.1 | xx | ||||||||||
| Labour | Vote: | xx | xx | ||||||||||
| Liberal-Labour | Vote: | xx | xx | ||||||||||
| Independent Labour | Vote: | 0.1 | xx | ||||||||||
| Unknown | Vote: | xx | xx | ||||||||||
xx - less than 0.05% of the popular vote.
Further reading
- Argyle, Ray. Turning Points: The Campaigns That Changed Canada - 2011 and Before (2011) excerpt and text search ch 9
See also
- List of Canadian federal general elections
- List of political parties in Canada
- 20th Canadian Parliament