Canadian federal election, 1926
| | ||||||||||||||||||||||||||||||||||||||||||||||||||||||||||||||||||||||||||||||
| ||||||||||||||||||||||||||||||||||||||||||||||||||||||||||||||||||||||||||||||
| ||||||||||||||||||||||||||||||||||||||||||||||||||||||||||||||||||||||||||||||
|
| ||||||||||||||||||||||||||||||||||||||||||||||||||||||||||||||||||||||||||||||
| ||||||||||||||||||||||||||||||||||||||||||||||||||||||||||||||||||||||||||||||


The Canadian federal election of 1926 was held on September 14 to elect members of the Canadian House of Commons of the 16th Parliament of Canada. The election was called following an event known as the King-Byng Affair. In the 1925 federal election, Prime Minister William Lyon Mackenzie King's Liberal Party of Canada won fewer seats in the Canadian House of Commons than the Conservative Party of Arthur Meighen. Mackenzie King, however, was determined to continue to govern with the support of the Progressive Party. The combined Liberal and Progressive caucuses gave Mackenzie King a plurality of seats in the House of Commons, and the ability to form a minority government. The agreement collapsed, however, following a scandal, and Mackenzie King approached the Governor-General, Baron Byng of Vimy, to seek dissolution of the Parliament. Byng refused on the basis that the Conservatives had won the largest number of seats in the prior election, and called upon Meighen to form a government.
Prime Minister Meighen's government was soon defeated in a vote of non-confidence, and Byng agreed to dissolve Parliament and call new elections. Mackenzie King effectively campaigned against Byng in the election instead of against Meighen, and won the largest number of seats in the House of Commons despite receiving a smaller proportion of the popular vote than the Tories. The Liberals did not run candidates in all ridings, having an informal electoral pact with the Progressives and Liberal-Progressives. Note in particular the election results in Manitoba, where Meighen's party captured almost 40 percent of the vote, twice the vote share of any other party, but no seats. Thus, Mackenzie King's Liberals were able to govern with the support of Liberal-Progressive Members of Parliament.
Byng returned to Britain at the end of the year and was raised to the rank of Viscount as an expression of confidence in him.
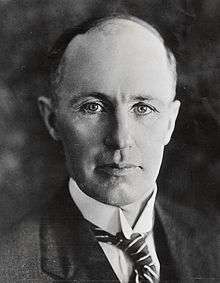
After his party's defeat and the loss of his own seat, Meighen resigned as Conservative leader.

National results
| ↓ | ||||
| 116 | 91 | 11 | 11 | 16 |
| Liberal | Conservative | P | UFA | O |
| Party | Party leader | # of candidates |
Seats | Popular vote | |||||
|---|---|---|---|---|---|---|---|---|---|
| 1925 | Elected | % Change | # | % | pp Change | ||||
| Liberal | W. L. Mackenzie King | 203 | 100 | 116 | +16.0% | 1,397,031 | 42.90% | +3.06 | |
| Conservative | Arthur Meighen | 232 | 115 | 91 | -20.2% | 1,476,834 | 45.35% | -0.78 | |
| Progressive | 28 | 22 | 11 | -50.0% | 128,060 | 3.93% | -4.52 | ||
| United Farmers of Alberta | 12 | 2 | 11 | +450% | 60,740 | 1.87% | +1.61 | ||
| Liberal–Progressive | Robert Forke | 12 | - | 8 | 63,144 | 1.94% | +1.83 | ||
| Labour | 18 | 2 | 4 | +100% | 55,661 | 1.71% | -0.10 | ||
| Independent | 10 | 2 | 2 | - | 25,821 | 0.79% | +0.28 | ||
| Independent Liberal | 5 | 1 | 1 | - | 18,627 | 0.57% | -0.42 | ||
| United Farmers of Ontario | 1 | * | 1 | * | 6,909 | 0.21% | * | ||
| Independent Conservative | 3 | 1 | - | -100% | 10,164 | 0.31% | -0.23 | ||
| Progressive-Conservative | 2 | - | - | - | 7,088 | 0.22% | +0.18 | ||
| Liberal-Labour | 1 | * | - | * | 4,187 | 0.13% | * | ||
| Labour-Farmer | 1 | - | - | - | 1,441 | 0.04% | -0.11 | ||
| Socialist | 1 | - | - | - | 672 | 0.02% | -0.04 | ||
| Protectionist | 1 | * | - | * | 129 | x | * | ||
| Total | 530 | 245 | 245 | - | 3,256,508 | 100% | |||
| Sources: http://www.elections.ca -- History of Federal Ridings since 1867 | |||||||||
Notes:
* not applicable - the party was not recognized in the previous election
x - less than 0.005% of the popular vote
Vote and seat summaries
Results by province
The results in the province of Manitoba are used by supporters of electoral reform as a reason to abolish the "First Past the Post" electoral system. Note that with 40% of the vote, the Conservatives did not win a single seat in the province. The explanation for this bizarre occurrence is that only three ridings in Manitoba were three-way races - Springfield, St. Boniface, and Winnipeg North - and one acclamation - Provencher. The other 13 ridings were two-way races between the Conservatives and either the Liberals, Progressives, Liberal-Progressives, or Labour Party. Thus, the main reason for the disproportionality is that parties other than the Conservatives simply chose not to field candidates in ridings where a non-conservative candidate was already running - thus uniting the vote against the Conservatives in those thirteen Manitoba ridings.
| Party name | BC | AB | SK | MB | ON | QC | NB | NS | PE | YK | Total | ||
|---|---|---|---|---|---|---|---|---|---|---|---|---|---|
| Liberal | Seats: | 1 | 3 | 16 | 4 | 24 | 59 | 4 | 2 | 3 | - | 116 | |
| Popular Vote (%): | 37.0 | 24.5 | 51.3 | 18.4 | 35.3 | 61.3 | 46.1 | 43.5 | 52.7 | 44.1 | 42.8 | ||
| Conservative | Seats: | 12 | 1 | - | - | 53 | 4 | 7 | 12 | 1 | 1 | 91 | |
| Vote: | 54.2 | 31.5 | 27.5 | 39.7 | 54.9 | 34.0 | 53.9 | 53.7 | 47.3 | 55.9 | 45.4 | ||
| Progressive | Seats: | 4 | 4 | 3 | 11 | ||||||||
| Vote: | 17.9 | 11.2 | 5.1 | 3.9 | |||||||||
| United Farmers of Alberta | Seats: | 11 | 11 | ||||||||||
| Vote: | 38.7 | 1.9 | |||||||||||
| Liberal-Progressive | Seats: | 1 | 7 | - | 8 | ||||||||
| Vote: | 3.2 | 19.5 | 1.4 | 1.9 | |||||||||
| Labour | Seats: | - | 1 | 2 | 1 | - | 4 | ||||||
| Vote: | 6.4 | 4.3 | 8.7 | 1.1 | 2.8 | 1.7 | |||||||
| Independent | Seats: | 1 | - | - | 1 | 2 | |||||||
| Vote: | 2.3 | 0.1 | 0.5 | 1.9 | 0.8 | ||||||||
| Independent Liberal | Seats: | 1 | 1 | ||||||||||
| Vote: | 2.3 | 0.6 | |||||||||||
| United Farmers of Ontario | Seats: | 1 | 1 | ||||||||||
| Vote: | 0.6 | 0.2 | |||||||||||
| Total seats | 14 | 16 | 21 | 17 | 82 | 65 | 11 | 14 | 4 | 1 | 245 | ||
| Parties that won no seats: | |||||||||||||
| Independent Conservative | Vote: | 0.8 | 0.1 | 0.3 | |||||||||
| Progressive-Conservative | Vote: | 2.5 | 0.3 | 0.2 | |||||||||
| Liberal-Labour | Vote: | 0.3 | 0.1 | ||||||||||
| Labour-Farmer | Vote: | 0.9 | xx | ||||||||||
| Socialist | Vote: | 0.1 | xx | ||||||||||
| Protectionist | Vote: | xx | xx | ||||||||||
xx - less than 0.05% of the popular vote
See also
- List of Canadian federal general elections
- List of political parties in Canada
- 16th Canadian Parliament
References
Further reading
- Argyle, Ray. Turning Points: The Campaigns That Changed Canada - 2011 and Before (2011) excerpt and text search ch 7