Dumfriesshire (UK Parliament constituency)
| Dumfriesshire | |
|---|---|
|
Former County constituency for the House of Commons | |
| 1708–2005 | |
| Number of members | one |
| Replaced by |
Dumfriesshire, Clydesdale & Tweeddale Dumfries & Galloway |
| Created from | Dumfriesshire |
Dumfriesshire was a county constituency represented in the House of Commons of Great Britain (at Westminster) from 1708 to 1801 and in the House of Commons of the Parliament of the United Kingdom (also at Westminster) from 1801 until 2005. It was known as Dumfries from 1950. It was redistributed to Dumfriesshire, Clydesdale and Tweeddale and Dumfries and Galloway as part of a major reorganisation of Scottish constituencies.
It elected one Member of Parliament (MP) using the first-past-the-post voting system.
Members of Parliament
MPs 1708–1832
| Year | Member | Party | |
|---|---|---|---|
| 1708 | Lord Johnstone | ||
| 1709 | William Grierson | ||
| 1711 | James Murray | Tory | |
| 1713 | Sir William Johnstone | ||
| 1722 | Charles Erskine | ||
| 1741 | Sir John Douglas | ||
| 1747 | Lord Charles Douglas | ||
| 1755 | James Veitch | ||
| 1761 | Lt Gen Archibald Douglas of Kirkton | ||
| 1774 | Sir Robert Laurie | ||
| 1804 | Sir William Johnstone Hope | ||
| 1830 | John James Hope Johnstone (1) | Tory | |
| 1832 | Reform Act 1832: franchise expanded | ||
MPs 1832–2005
1 Dr Hunter was elected in 1929 as a Liberal candidate, but in the split after the 1931 general election, he joined the National Liberals.
Election results
Elections of the 1880s
| Party | Candidate | Votes | % | ± | |
|---|---|---|---|---|---|
| Liberal | Sir Robert Jardine | 4,857 | 57.7 | ||
| Conservative | Walter Henry Scott, Earl of Dalkeith | 3,566 | 42.3 | ||
| Majority | 1,291 | 15.4 | |||
| Turnout | |||||
| Liberal hold | Swing | ||||
| Party | Candidate | Votes | % | ± | |
|---|---|---|---|---|---|
| Liberal Unionist | Sir Robert Jardine | 4,106 | 55.8 | +13.5 | |
| Liberal | Thomas McKie | 3,252 | 44.2 | -13.5 | |
| Majority | 854 | 11.6 | 27.0 | ||
| Turnout | 77.5 | ||||
| Liberal Unionist gain from Liberal | Swing | +13.5 | |||
Elections of the 1890s
| Party | Candidate | Votes | % | ± | |
|---|---|---|---|---|---|
| Liberal Unionist | William Jardine Herries Maxwell | 4,123 | 51.7 | ||
| Liberal | Thomas McKie | 3,849 | 48.3 | ||
| Majority | 274 | 3.4 | |||
| Turnout | 86.4 | ||||
| Liberal Unionist hold | Swing | ||||

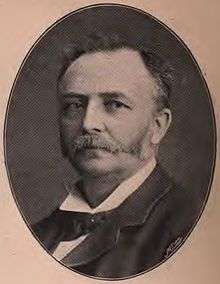
Robinson Souttar
| Party | Candidate | Votes | % | ± | |
|---|---|---|---|---|---|
| Liberal | Robinson Souttar | 3,965 | 51.1 | +1.8 | |
| Liberal Unionist | William Jardine Herries Maxwell | 3,952 | 49.9 | -1.8 | |
| Majority | 13 | 0.2 | 3.6 | ||
| Turnout | 86.7 | ||||
| Liberal gain from Liberal Unionist | Swing | +1.8 | |||
Elections of the 1900s
| Party | Candidate | Votes | % | ± | |
|---|---|---|---|---|---|
| Liberal Unionist | William Jardine Herries Maxwell | 4,124 | 52.9 | ||
| Liberal | Robinson Souttar | 3,675 | 47.1 | ||
| Majority | 449 | 5.8 | |||
| Turnout | 85.0 | ||||
| Liberal Unionist gain from Liberal | Swing | ||||

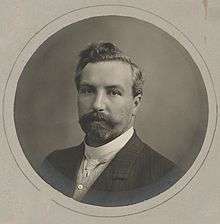
Percy Molteno
| Party | Candidate | Votes | % | ± | |
|---|---|---|---|---|---|
| Liberal | Percy Alport Molteno | 4,814 | 58.4 | +11.3 | |
| Conservative | J.H. Balfour-Browne | 3,431 | 41.6 | -11.3 | |
| Majority | 1,383 | 16.8 | 22.6 | ||
| Turnout | 87.8 | ||||
| Liberal gain from Liberal Unionist | Swing | +11.3 | |||
Elections of the 1910s
| Party | Candidate | Votes | % | ± | |
|---|---|---|---|---|---|
| Liberal | Percy Alport Molteno | 4,666 | 53.3 | ||
| Liberal Unionist | William Murray | 4,091 | 46.7 | ||
| Majority | 575 | 6.6 | |||
| Turnout | 90.7 | ||||
| Liberal hold | Swing | ||||
| Party | Candidate | Votes | % | ± | |
|---|---|---|---|---|---|
| Liberal | Percy Alport Molteno | 4,708 | 53.2 | -0.1 | |
| Liberal Unionist | William Murray | 4,146 | 46.8 | +0.1 | |
| Majority | 562 | 6.4 | -0.2 | ||
| Turnout | 90.7 | +0.0 | |||
| Liberal hold | Swing | +0.0 | |||
| Party | Candidate | Votes | % | ± | |
|---|---|---|---|---|---|
| Unionist | Maj. William Murray | 13,345 | |||
| Liberal | Rt Hon. John William Gulland | 7,562 | |||
| Majority | |||||
| Turnout | |||||
| Unionist gain from Liberal | Swing | ||||
Elections of the 1920s

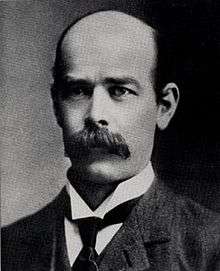
Henry Keswick
| Party | Candidate | Votes | % | ± | |
|---|---|---|---|---|---|
| Liberal | William Allan Chapple | 13,296 | 54.6 | ||
| Unionist | Henry Keswick | 11,055 | 45.4 | ||
| Majority | 2,241 | 9.2 | |||
| Turnout | 24,351 | ||||
| Liberal gain from Unionist | Swing | ||||

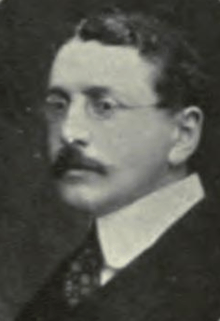
William Chapple
| Party | Candidate | Votes | % | ± | |
|---|---|---|---|---|---|
| Liberal | William Allan Chapple | 13,107 | 53.5 | -1.1 | |
| Unionist | John Charteris | 11,380 | 46.5 | +1.1 | |
| Majority | 1,727 | 7.0 | -2.2 | ||
| Turnout | 24,487 | ||||
| Liberal hold | Swing | -1.1 | |||
| Party | Candidate | Votes | % | ± | |
|---|---|---|---|---|---|
| Unionist | John Charteris | 12,718 | 46.2 | -0.3 | |
| Liberal | William Allan Chapple | 8,472 | 30.8 | -22.7 | |
| Labour | Mrs Agnes Dollan | 6,342 | 23.0 | n/a | |
| Majority | 15.4 | 22.4 | |||
| Turnout | 27,532 | ||||
| Unionist gain from Liberal | Swing | +11.2 | |||
| Party | Candidate | Votes | % | ± | |
|---|---|---|---|---|---|
| Liberal | Dr Joseph Hunter | 16,174 | 45.1 | +14.3 | |
| Unionist | John Charteris | 12,984 | 36.2 | -10.0 | |
| Labour | W.H. Marwick | 6,687 | 18.7 | -4.3 | |
| Majority | 3,190 | 8.9 | 24.3 | ||
| Turnout | 35,845 | ||||
| Liberal gain from Unionist | Swing | +12.2 | |||
Elections of the 1930s
| Party | Candidate | Votes | % | ± | |
|---|---|---|---|---|---|
| Liberal National | Joseph Hunter | 26,873 | 77.7 | +32.6 | |
| Labour | J. S. Paterson | 7,693 | 22.3 | +3.6 | |
| Majority | 19,180 | 55.4 | 46.5 | ||
| Turnout | 34,566 | 77.6 | −3.8 | ||
| Liberal National hold | Swing | ||||
| Party | Candidate | Votes | % | ± | |
|---|---|---|---|---|---|
| Liberal National | Sir Henry Fildes | 16,271 | 60.3 | −17.4 | |
| Labour Co-op | John Downie | 10,697 | 39.7 | +17.4 | |
| Majority | 5,574 | 20.6 | −34.8 | ||
| Turnout | 26,968 | 58.7 | −18.9 | ||
| Liberal National hold | Swing | −17.4 | |||
| Party | Candidate | Votes | % | ± | |
|---|---|---|---|---|---|
| Liberal National | Sir Henry Fildes | 22,053 | 65.4 | +5.1 | |
| Labour | John Downie | 11,685 | 34.6 | −5.1 | |
| Majority | 10,368 | 30.8 | +10.2 | ||
| Turnout | 33,738 | 73.6 | +14.9 | ||
| Liberal National hold | Swing | +5.1 | |||
Elections of the 1940s
| Party | Candidate | Votes | % | ± | |
|---|---|---|---|---|---|
| Liberal National | Niall Malcolm Stewart Macpherson | 16,465 | 47.4 | ||
| Labour | D Dunwoodie | 12,388 | 35.7 | ||
| Liberal | Fl-Off. Ian McColl | 5,850 | 16.9 | ||
| Majority | 4,077 | 11.7 | |||
| Turnout | 72.3 | ||||
| Liberal National hold | Swing | ||||
Elections of the 1950s
| Party | Candidate | Votes | % | ± | |
|---|---|---|---|---|---|
| National Liberal | Niall Malcolm Stewart Macpherson | 26,268 | 59.31 | ||
| Labour | Harry S Wilson | 18,025 | 40.69 | ||
| Majority | 8,243 | 18.61 | |||
| Turnout | 78.60 | ||||
| National Liberal hold | Swing | ||||
| Party | Candidate | Votes | % | ± | |
|---|---|---|---|---|---|
| National Liberal | Niall Malcolm Stewart Macpherson | 26,386 | 61.28 | ||
| Labour | George BA Douglas | 16,669 | 38.72 | ||
| Majority | 9,717 | 22.57 | |||
| Turnout | 80.17 | ||||
| National Liberal hold | Swing | ||||
| Party | Candidate | Votes | % | ± | |
|---|---|---|---|---|---|
| National Liberal | Niall Malcolm Stewart Macpherson | 24,550 | 61.34 | ||
| Labour | Harry S Wilson | 15,427 | 38.66 | ||
| Majority | 9,078 | 22.68 | |||
| Turnout | 73.73 | ||||
| National Liberal hold | Swing | ||||
| Party | Candidate | Votes | % | ± | |
|---|---|---|---|---|---|
| National Liberal | Niall Malcolm Stewart Macpherson | 25,867 | 58.39 | ||
| Labour | Graeme C. Moodie | 18,437 | 41.61 | ||
| Majority | 7,430 | 16.77 | |||
| Turnout | 77.44 | ||||
| National Liberal hold | Swing | ||||
Elections of the 1960s
| Party | Candidate | Votes | % | ± | |
|---|---|---|---|---|---|
| Conservative | David Colville Anderson | 16,762 | 40.84 | ||
| Labour | Iain Jordan | 15,791 | 38.47 | ||
| Liberal | Charles Abernethy | 4,491 | 10.94 | ||
| SNP | John HD Gair | 4,001 | 9.75 | ||
| Majority | 971 | 2.37 | |||
| Turnout | 41,045 | ||||
| Conservative hold | Swing | ||||
| Party | Candidate | Votes | % | ± | |
|---|---|---|---|---|---|
| Conservative | Hector Seymour Peter Monro | 22,816 | 48.65 | ||
| Labour | Iain Jordan | 18,360 | 39.15 | ||
| SNP | John HD Gair | 5,726 | 12.21 | ||
| Majority | 4,456 | 9.50 | |||
| Turnout | 81.57 | ||||
| Conservative hold | Swing | ||||
| Party | Candidate | Votes | % | ± | |
|---|---|---|---|---|---|
| Conservative | Hector Seymour Peter Monro | 20,779 | 45.63 | ||
| Labour | TC Boyd | 16,358 | 35.92 | ||
| SNP | John HD Gair | 5,727 | 12.57 | ||
| Liberal | Roy Semple | 2,679 | 5.88 | ||
| Majority | 4,421 | 9.71 | |||
| Turnout | 80.19 | ||||
| Conservative hold | Swing | ||||
Elections of the 1970s
| Party | Candidate | Votes | % | ± | |
|---|---|---|---|---|---|
| Conservative | Hector Seymour Peter Monro | 24,661 | 53.12 | ||
| Labour | Raymond D Donnelly | 15,555 | 33.50 | ||
| SNP | John HD Gair | 6,211 | 13.38 | ||
| Majority | 9,106 | 19.61 | |||
| Turnout | 76.13 | ||||
| Conservative hold | Swing | ||||
| Party | Candidate | Votes | % | ± | |
|---|---|---|---|---|---|
| Conservative | Hector Seymour Peter Monro | 21,707 | 44.05 | ||
| Labour | John Wheatley | 12,739 | 25.85 | ||
| SNP | LAB Whitley | 9,186 | 18.64 | ||
| Liberal | DH Reive | 5,642 | 11.45 | ||
| Majority | 8,968 | 18.20 | |||
| Turnout | 80.38 | ||||
| Conservative hold | Swing | ||||
| Party | Candidate | Votes | % | ± | |
|---|---|---|---|---|---|
| Conservative | Hector Seymour Peter Monro | 18,386 | 38.75 | ||
| Labour | John Wheatley | 12,558 | 26.47 | ||
| SNP | LAB Whitley | 12,542 | 26.43 | ||
| Liberal | A Sinclair | 3,961 | 8.35 | ||
| Majority | 5,828 | 12.28 | |||
| Turnout | 76.71 | ||||
| Conservative hold | Swing | ||||
| Party | Candidate | Votes | % | ± | |
|---|---|---|---|---|---|
| Conservative | Hector Seymour Peter Monro | 22,704 | 45.21 | ||
| Labour | A Wood | 13,700 | 27.28 | ||
| Liberal | James Robert Wallace | 7,169 | 14.28 | ||
| SNP | E Gibson | 6,647 | 13.24 | ||
| Majority | 9,004 | 17.93 | |||
| Turnout | 78.09 | ||||
| Conservative hold | Swing | ||||
Elections of the 1980s
| Party | Candidate | Votes | % | ± | |
|---|---|---|---|---|---|
| Conservative | Hector Seymour Peter Monro | 18,730 | 44.53 | ||
| Social Democratic | J McCall | 10,036 | 23.86 | ||
| Labour | T McAughtrie | 8,764 | 20.84 | ||
| SNP | E Gibson | 4,527 | 10.76 | ||
| Majority | 8,694 | 20.67 | |||
| Turnout | 73.02 | ||||
| Conservative hold | Swing | ||||
| Party | Candidate | Votes | % | ± | |
|---|---|---|---|---|---|
| Conservative | Hector Seymour Peter Monro | 18,785 | 41.9 | ||
| Labour | Catherine Winifred Phillips | 11,292 | 25.2 | ||
| Social Democratic | James Robertson McCall | 8,064 | 18.0 | ||
| SNP | Thomas McAlpine | 6,391 | 14.2 | ||
| Green | Paul Meynall Thomas | 349 | 0.8 | ||
| Majority | 7,493 | 16.70 | |||
| Turnout | 75.62 | ||||
| Conservative hold | Swing | ||||
Elections of the 1990s
| Party | Candidate | Votes | % | ± | |
|---|---|---|---|---|---|
| Conservative | Hector Seymour Peter Monro | 21,089 | 43.13 | ||
| Labour | Peter R. Rennie | 14,674 | 30.01 | ||
| SNP | Alasdair Morgan | 6,971 | 14.26 | ||
| Liberal Democrat | Neil C. Wallace | 4,749 | 11.76 | ||
| Independent | Graham McLeod | 312 | 0.64 | ||
| Natural Law | Thomas Barlow | 107 | 0.22 | ||
| Majority | 6,415 | 13.12 | |||
| Turnout | 79.98 | ||||
| Conservative hold | Swing | ||||
| Party | Candidate | Votes | % | ± | |
|---|---|---|---|---|---|
| Labour | Russell Brown | 23,528 | 47.51 | ||
| Conservative | Struan Stevenson | 13,885 | 28.04 | ||
| SNP | Robert J. Higgins | 5,977 | 12.07 | ||
| Liberal Democrat | Neil C. Wallace | 5,487 | 11.08 | ||
| Referendum | David F. Parker | 533 | 1.08 | ||
| Natural Law | Miss Elizabeth Hunter | 117 | 0.24 | ||
| Majority | 9,643 | 19.47 | |||
| Turnout | 78.17 | ||||
| Labour gain from Conservative | Swing | ||||
Elections of the 2000s
| Party | Candidate | Votes | % | ± | |
|---|---|---|---|---|---|
| Labour | Russell Brown | 20,830 | 48.9 | +1.4 | |
| Conservative | John Anthony Charteris | 11,996 | 28.2 | +0.1 | |
| Liberal Democrat | John Andrew Ross Scott | 4,955 | 11.6 | +0.6 | |
| SNP | Gerard Alexander Fisher | 4,103 | 9.6 | −2.4 | |
| Scottish Socialist | John Dennis | 702 | 1.6 | N/A | |
| Majority | 8,834 | 20.7 | |||
| Turnout | 42,586 | 67.0 | −11.9 | ||
| Labour hold | Swing | ||||
References
- ↑ British parliamentary election results, 1885-1918
- ↑ Debrett's House of Commons and the Judicial Bench, 1889
- ↑ British parliamentary election results, 1885-1918
- ↑ British parliamentary election results, 1885-1918
- ↑ British parliamentary election results, 1885-1918
- ↑ British parliamentary election results, 1885-1918
- ↑ British parliamentary election results, 1885-1918
- ↑ British parliamentary election results, 1885-1918
- ↑ Whitaker's Almanack, 1920
- ↑ The Times, 17 November 1922
- ↑ The Times, 8 December 1923
- ↑ The Times House of Commons 1929
- ↑ The Times House of Commons 1929
- ↑ Whitaker's Almanack, 1934
- ↑ Whitaker's Almanack, 1939
- ↑ Whitaker's Almanack, 1963
- ↑ The Times, 13 Dec 1963
- ↑ Whitaker's Almanack, 1977
- Craig, F. W. S. (1983) [1969]. British parliamentary election results 1918-1949 (3rd ed.). Chichester: Parliamentary Research Services. ISBN 0-900178-06-X.
- Leigh Rayment's Historical List of MPs – Constituencies beginning with "D" (part 4)
This article is issued from Wikipedia - version of the 5/29/2016. The text is available under the Creative Commons Attribution/Share Alike but additional terms may apply for the media files.