European Parliament election, 1989
| | |||||||||||||||||||||||||||||||||||||||||||||||
| |||||||||||||||||||||||||||||||||||||||||||||||
| |||||||||||||||||||||||||||||||||||||||||||||||
|
| |||||||||||||||||||||||||||||||||||||||||||||||
| * The number of seats was increased from 434 to 518 – so this is a nominal figure | |||||||||||||||||||||||||||||||||||||||||||||||
| |||||||||||||||||||||||||||||||||||||||||||||||

.jpg)
.jpg)
| European Union |
 This article is part of a series on the |
Policies and issues
|

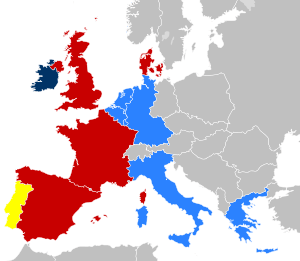
The 1989 European Parliamentary Election was a European election held across the 12 European Community member states in June 1989. It was third European election but the first time that Spain and Portugal voted at the same time as the other members (they joined in 1986). Overall turnout dropped to 59%
Results
| European Parliament election, 1989 - Final results at 25 July 1989 | ||||||
|---|---|---|---|---|---|---|
| Group | Description | Chaired by | MEPs | |||
| SOC | Social Democrats | Jean-Pierre Cot | 180 | 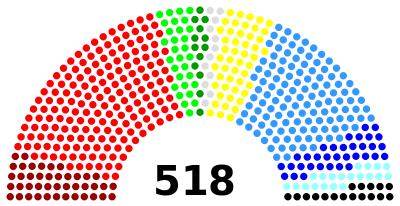 | ||
| EPP | Christian Democrats | Egon Klepsch | 121 | |||
| LDR | Liberals and Liberal Democrats | Valéry Giscard d'Estaing | 49 | |||
| EUL | Communists and the Far Left | Luigi Alberto Colajanni | 42 | |||
| LU | René-Emile Piquet | |||||
| ED | Conservatives | Christopher Prout | 34 | |||
| G | Greens | Maria Amélia Santos | 30 | |||
| EDA | National Conservatives | Christian de La Malène | 20 | |||
| DR | Far-Right Nationalists | Jean-Marie Le Pen | 17 | |||
| RBW | Regionalists | Jaak Vandemeulebroucke | 13 | |||
| NI | Independents | none | 12 | Total: 518 | Sources: | |
The Socialists held their third consecutive victory, rising to 180 seats (166 pre-election), with the People's Party managing to win only 8 extra seats. However, the European Democrats had a massive loss of 32 of the 66 seats, knocking them from third to sixth largest party. The liberals, who had already risen one place with the byelections in Spain and Portugal earlier, gained an extra seat, holding their new-found third place with both the Rainbow and Communist groups splitting post-election.
Statistics
| European Parliament election, 1989 - Statistics | ||||||||
|---|---|---|---|---|---|---|---|---|
| Area | Dates | Seats | Electorate | Turnout | Previous | Next | Election methods | Sources |
| European Community (EC-12) |
15-18 June 1989 |
518 | 244,951,379 | 58.5% | 1984 | 1994 | All PR, except UK (not NI) which used FPTP |
|
| European Parliament election, 1989 - Delegation at 25 July 1989 | |||||
|---|---|---|---|---|---|
| Group | Description | Details | % | MEPs | |
| SOC | Social Democrats | West Germany 31, Belgium 8, Denmark 4, France 22, Ireland 1, Italy 14, Luxembourg 2, Netherlands 8, UK 46, Greece 9, Spain 27, Portugal 8 | 35% | 180 | |
| EPP | Christian Democrats | West Germany 32, Belgium 7, Denmark 2, France 6, Ireland 4, Italy 27, Luxembourg 3, Netherlands 10, UK 1, Greece 10, Spain 16, Portugal 3 | 23% | 121 | |
| LDR | Liberals and Liberal Democrats | West Germany 4, Belgium 4, Denmark 3, France 13, Ireland 2, Italy 3, Luxembourg 1, Netherlands 4, Spain 6, Portugal 9 | 9% | 49 | |
| EUL & LU | Communists and the Far Left | Denmark 1, France 7, Ireland 1, Italy 22, Greece 4, Spain 4, Portugal 3 | 8% | 42 (28+14) | |
| ED | Conservatives | Denmark 2, UK 32 | 7% | 34 | |
| G | Greens | West Germany 8, Belgium 3, France 8, Italy 7, Netherlands 2, Spain 1, Portugal 1 | 6% | 30 | |
| EDA | National Conservatives | France 13, Ireland 6, Greece 1 | 4% | 20 | |
| DR | Far-Right Nationalists | West Germany 6, Belgium 1, France 10 | 3% | 17 | |
| RBW | Regionalists | Belgium 1, Denmark 4, France 1, Ireland 1, Italy 3, UK 1, Spain 2 | 3% | 13 | |
| NI | Independents | France 1, Italy 5, Netherlands 1, UK 1, Spain 4 | 2% | 12 | |
| Sources: | 100% | 518 | |||
Seat changes
| ||||||||||||||||||||||||||||||||||
These were the first elections Portugal and Spain took part in with the other states. Spain was allocated 60 seats and Portugal was allocated 24; the number of seats for the other states remained the same, raising the total number of seats from 434 to 518.
External links
- The election of the Members of the European Parliament European Navigator
- Full Election Details Elections Online (In French)
| 1979 | |
|---|---|
| 1984 | |
| 1989 | |
| 1994 | |
| 1999 | |
| 2004 | |
| 2009 | |
| 2014 | |
| 2019 |
|
| Off-year | |