Grafenried, Switzerland
| Grafenried | ||
|---|---|---|
| Former municipality of Switzerland | ||
|
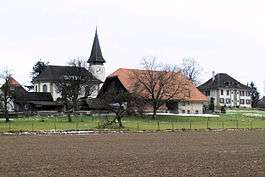
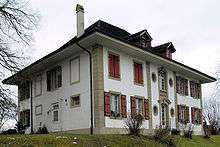
Grafenried village and church | ||
| ||
 Grafenried | ||
|
Location of Grafenried 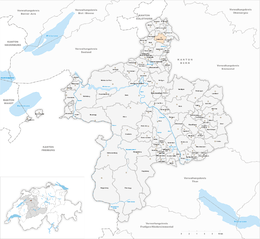 | ||
| Coordinates: 47°5′N 7°31′E / 47.083°N 7.517°ECoordinates: 47°5′N 7°31′E / 47.083°N 7.517°E | ||
| Country | Switzerland | |
| Canton | Bern | |
| District | Bern-Mittelland | |
| Area | ||
| • Total | 4.7 km2 (1.8 sq mi) | |
| Elevation | 520 m (1,710 ft) | |
| Population (Dec 2011) | ||
| • Total | 980 | |
| • Density | 210/km2 (540/sq mi) | |
| Postal code | 3308 | |
| SFOS number | 0539 | |
| Surrounded by | Etzelkofen, Fraubrunnen, Iffwil, Jegenstorf, Zauggenried | |
| Website |
www SFSO statistics | |

Grafenried is a former municipality in the Bern-Mittelland administrative district in the canton of Bern in Switzerland. On 1 January 2014 the former municipalities of Grafenried, Büren zum Hof, Etzelkofen, Limpach, Mülchi, Schalunen and Zauggenried merged into the municipality of Fraubrunnen.[1]
History
Grafenried is first mentioned in 1258 as Gravenriet. In 1262 it was mentioned as Riede.[2]
The oldest trace of a settlement is a Hallstatt era grave mound at Eichberg. The remains of what may have been a Roman era farm as well as a late medieval abandoned village were discovered at Wille/Wittenberg. During the Middle Ages the village, court and church were owned by the Counts of Thierstein. In the 13th century Fraubrunnen Abbey acquired the entire village. It remained under the Abbey's control until Bern adopted the Protestant Reformation, secularized the Abbey and took all the Abbey's lands in 1528. Under Bernese control, Grafenried became part of the bailiwick of Fraubrunnen, which was part of the court of Zollikofen.
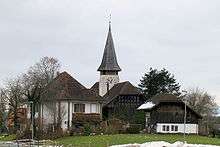
The first church in the village was built in the 7th or 8th century. The aisleless church was built above a post-Roman tomb outside the village on the road to Fraubrunnen. The village bought the patronage rights to the church from the Abbey in 1258. In 1535 it became the parish church for the municipality. The current church was built in 1748.
During the 19th century many of the local farmers switched from growing grain to raising dairy cattle. The village dairy opened in 1848. In 1916 a station on the Bern-Solothurn-Zollikofen Railway (now Regional Bern-Solothurn) was built in the village. However, it remained mostly agricultural and rural with only a few small businesses. A few industrial businesses (auto recycling, steel engineering and a wood products factory) moved into the village in the 1970s. The new neighborhoods Bachtelen and Sinfonia were built in 1976 to provide housing for the growing population.
Geography
Before the merger, Grafenried had a total area of 4.8 km2 (1.9 sq mi).[3] Of this area, 2.61 km2 (1.01 sq mi) or 55.3% is used for agricultural purposes, while 1.65 km2 (0.64 sq mi) or 35.0% is forested. Of the rest of the land, 0.48 km2 (0.19 sq mi) or 10.2% is settled (buildings or roads), 0.01 km2 (2.5 acres) or 0.2% is either rivers or lakes.[4]
Of the built up area, housing and buildings made up 5.5% and transportation infrastructure made up 3.4%. while parks, green belts and sports fields made up 1.1%. Out of the forested land, all of the forested land area is covered with heavy forests. Of the agricultural land, 43.9% is used for growing crops and 9.3% is pastures, while 2.1% is used for orchards or vine crops. All the water in the municipality is flowing water.[4]
It is located on the eastern Rapperswil plateau. It includes the village of Grafenried as well as the two hamlets that were founded in the 16th Century, Buchhof and Binel.
On 31 December 2009 Amtsbezirk Fraubrunnen, the municipality's former district, was dissolved. On the following day, 1 January 2010, it joined the newly created Verwaltungskreis Bern-Mittelland.[1]
Coat of arms
The blazon of the municipal coat of arms is Argent on a Base Vert a Hind stantant Gules.[5]
Demographics
Grafenried had a population (as of 2011) of 980.[3] As of 2010, 3.8% of the population are resident foreign nationals.[6] Over the last 10 years (2000-2010) the population has changed at a rate of 6.8%. Migration accounted for 5.3%, while births and deaths accounted for 2.4%.[3]
Most of the population (as of 2000) speaks German (862 or 95.9%) as their first language, French is the second most common (15 or 1.7%) and Italian is the third (3 or 0.3%).[7]
As of 2008, the population was 48.2% male and 51.8% female. The population was made up of 448 Swiss men (45.8% of the population) and 23 (2.4%) non-Swiss men. There were 493 Swiss women (50.4%) and 14 (1.4%) non-Swiss women.[6] Of the population in the municipality, 278 or about 30.9% were born in Grafenried and lived there in 2000. There were 395 or 43.9% who were born in the same canton, while 155 or 17.2% were born somewhere else in Switzerland, and 54 or 6.0% were born outside of Switzerland.[7]
As of 2010, children and teenagers (0-19 years old) make up 23.3% of the population, while adults (20-64 years old) make up 62% and seniors (over 64 years old) make up 14.7%.[3]
As of 2000, there were 378 people who were single and never married in the municipality. There were 454 married individuals, 36 widows or widowers and 31 individuals who are divorced.[7]
As of 2000, there were 91 households that consist of only one person and 33 households with five or more people. In 2000, a total of 332 apartments (91.2% of the total) were permanently occupied, while 20 apartments (5.5%) were seasonally occupied and 12 apartments (3.3%) were empty.[8] As of 2010, the construction rate of new housing units was 4.1 new units per 1000 residents.[3] The vacancy rate for the municipality, in 2011, was 1.16%.
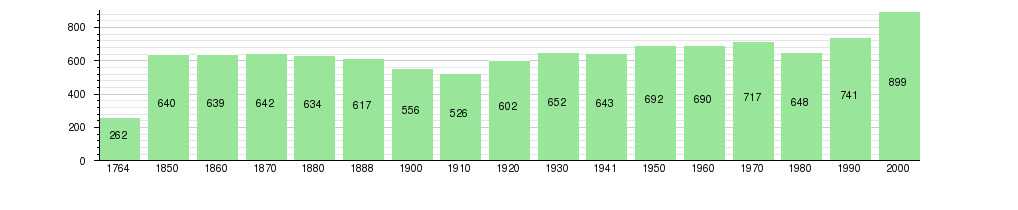
The historical population is given in the following chart:[2][9]
Politics
In the 2011 federal election the most popular party was the Conservative Democratic Party (BDP) which received 25% of the vote. The next three most popular parties were the Swiss People's Party (SVP) (20.2%), the Social Democratic Party (SP) (15.4%) and the Green Party (8.4%). In the federal election, a total of 460 votes were cast, and the voter turnout was 58.3%.[10]
Economy
As of 2011, Grafenried had an unemployment rate of 0.97%. As of 2008, there were a total of 164 people employed in the municipality. Of these, there were 42 people employed in the primary economic sector and about 16 businesses involved in this sector. 24 people were employed in the secondary sector and there were 8 businesses in this sector. 98 people were employed in the tertiary sector, with 23 businesses in this sector.[3] There were 491 residents of the municipality who were employed in some capacity, of which females made up 43.4% of the workforce.
In 2008 there were a total of 120 full-time equivalent jobs. The number of jobs in the primary sector was 23, all of which were in agriculture. The number of jobs in the secondary sector was 23 of which 13 or (56.5%) were in manufacturing and 10 (43.5%) were in construction. The number of jobs in the tertiary sector was 74. In the tertiary sector; 29 or 39.2% were in wholesale or retail sales or the repair of motor vehicles, 11 or 14.9% were in the movement and storage of goods, 14 or 18.9% were in a hotel or restaurant, 3 or 4.1% were in the information industry, 3 or 4.1% were technical professionals or scientists, 6 or 8.1% were in education.[11]
In 2000, there were 60 workers who commuted into the municipality and 402 workers who commuted away. The municipality is a net exporter of workers, with about 6.7 workers leaving the municipality for every one entering.[12] Of the working population, 32.8% used public transportation to get to work, and 46.6% used a private car.[3]
Religion
From the 2000 census, 86 or 9.6% were Roman Catholic, while 703 or 78.2% belonged to the Swiss Reformed Church. Of the rest of the population, there were 4 members of an Orthodox church (or about 0.44% of the population), there were 2 individuals (or about 0.22% of the population) who belonged to the Christian Catholic Church, and there were 54 individuals (or about 6.01% of the population) who belonged to another Christian church. There were 5 (or about 0.56% of the population) who were Islamic. There were 2 individuals who were Buddhist and 6 individuals who were Hindu. 42 (or about 4.67% of the population) belonged to no church, are agnostic or atheist, and 22 individuals (or about 2.45% of the population) did not answer the question.[7]
Education
In Grafenried about 370 or (41.2%) of the population have completed non-mandatory upper secondary education, and 145 or (16.1%) have completed additional higher education (either university or a Fachhochschule). Of the 145 who completed tertiary schooling, 77.2% were Swiss men, 20.7% were Swiss women.[7]
The Canton of Bern school system provides one year of non-obligatory Kindergarten, followed by six years of Primary school. This is followed by three years of obligatory lower Secondary school where the students are separated according to ability and aptitude. Following the lower Secondary students may attend additional schooling or they may enter an apprenticeship.[13]
During the 2010-11 school year, there were a total of 82 students attending classes in Grafenried. There was one kindergarten class with a total of 19 students in the municipality. Of the kindergarten students, and 10.5% have a different mother language than the classroom language. The municipality had 3 primary classes and 63 students. Of the primary students 6.3% have a different mother language than the classroom language.[14]
As of 2000, there were 3 students in Grafenried who came from another municipality, while 64 residents attended schools outside the municipality.[12]
References
- 1 2 Nomenklaturen – Amtliches Gemeindeverzeichnis der Schweiz (German) accessed 13 December 2014
- 1 2 Grafenried in German, French and Italian in the online Historical Dictionary of Switzerland.
- 1 2 3 4 5 6 7 Swiss Federal Statistical Office accessed 16 January 2014
- 1 2 Swiss Federal Statistical Office-Land Use Statistics 2009 data (German) accessed 25 March 2010
- ↑ Flags of the World.com accessed 17-January-2013
- 1 2 Statistical office of the Canton of Bern (German) accessed 4 January 2012
- 1 2 3 4 5 STAT-TAB Datenwürfel für Thema 40.3 - 2000 (German) accessed 2 February 2011
- ↑ Swiss Federal Statistical Office STAT-TAB - Datenwürfel für Thema 09.2 - Gebäude und Wohnungen (German) accessed 28 January 2011
- ↑ Swiss Federal Statistical Office STAT-TAB Bevölkerungsentwicklung nach Region, 1850-2000 (German) accessed 29 January 2011
- ↑ Swiss Federal Statistical Office 2011 Election (German) accessed 8 May 2012
- ↑ Swiss Federal Statistical Office STAT-TAB Betriebszählung: Arbeitsstätten nach Gemeinde und NOGA 2008 (Abschnitte), Sektoren 1-3 (German) accessed 28 January 2011
- 1 2 Swiss Federal Statistical Office - Statweb (German) accessed 24 June 2010
- ↑ EDK/CDIP/IDES (2010). Kantonale Schulstrukturen in der Schweiz und im Fürstentum Liechtenstein / Structures Scolaires Cantonales en Suisse et Dans la Principauté du Liechtenstein (PDF) (Report). Retrieved 24 June 2010.
- ↑ Schuljahr 2010/11 pdf document(German) accessed 4 January 2012
External links
| Wikimedia Commons has media related to Grafenried. |
- Grafenried in German, French and Italian in the online Historical Dictionary of Switzerland.