Demographics of Guinea
This article is about the demographic features of the population of Guinea, including population density, ethnicity, education level, health of the populace, economic status, religious affiliations and other aspects of the population.
Demographics of Guinea describes the condition and overview of Guinea's peoples. Demographic topics include basic education, health, and population statistics as well as identified racial and religious affiliations.
Population
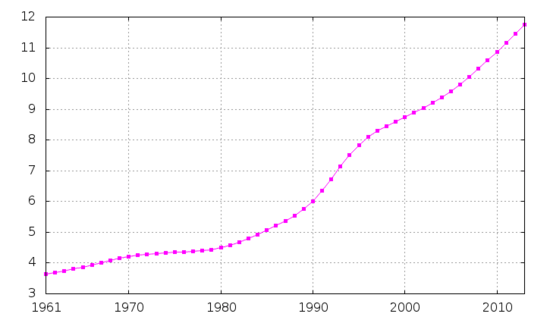
According to the 2010 revision of the World Population Prospects the total population was 9 982 000 in 2010, compared to only 3 094 000 in 1950. The proportion of children below the age of 15 in 2010 was 42.9%, 53.8% was between 15 and 65 years of age, while 3.3% was 65 years or older .[1]
| Total population (x 1000) | Population aged 0–14 (%) | Population aged 15–64 (%) | Population aged 65+ (%) | |
|---|---|---|---|---|
| 1950 | 3 094 | 37.1 | 57.6 | 5.3 |
| 1955 | 3 300 | 38.6 | 57.0 | 4.4 |
| 1960 | 3 541 | 40.0 | 56.2 | 3.8 |
| 1965 | 3 823 | 41.8 | 54.9 | 3.4 |
| 1970 | 4 154 | 42.2 | 54.6 | 3.2 |
| 1975 | 4 287 | 42.6 | 54.3 | 3.1 |
| 1980 | 4 407 | 43.3 | 53.5 | 3.2 |
| 1985 | 4 924 | 43.9 | 52.8 | 3.3 |
| 1990 | 5 759 | 44.4 | 52.3 | 3.3 |
| 1995 | 7 565 | 44.6 | 52.1 | 3.3 |
| 2000 | 8 344 | 44.2 | 52.4 | 3.3 |
| 2005 | 9 041 | 43.6 | 53.0 | 3.3 |
| 2010 | 9 982 | 42.9 | 53.8 | 3.3 |
Vital statistics
Registration of vital events is in Guinea not complete. The Population Departement of the United Nations prepared the following estimates. [1]
| Period | Live births per year | Deaths per year | Natural change per year | CBR* | CDR* | NC* | TFR* | IMR* |
|---|---|---|---|---|---|---|---|---|
| 1950-1955 | 151 000 | 110 000 | 41 000 | 47.2 | 34.3 | 12.9 | 6.00 | 218 |
| 1955-1960 | 165 000 | 115 000 | 50 000 | 48.1 | 33.5 | 14.6 | 6.24 | 214 |
| 1960-1965 | 179 000 | 119 000 | 59 000 | 48.5 | 32.4 | 16.1 | 6.51 | 210 |
| 1965-1970 | 196 000 | 126 000 | 70 000 | 49.0 | 31.5 | 17.5 | 6.80 | 206 |
| 1970-1975 | 204 000 | 123 000 | 82 000 | 48.5 | 29.1 | 19.3 | 6.85 | 191 |
| 1975-1980 | 210 000 | 115 000 | 95 000 | 48.2 | 26.5 | 21.8 | 6.91 | 174 |
| 1980-1985 | 224 000 | 113 000 | 111 000 | 48.0 | 24.2 | 23.8 | 6.95 | 159 |
| 1985-1990 | 252 000 | 117 000 | 135 000 | 47.2 | 22.0 | 25.2 | 6.86 | 145 |
| 1990-1995 | 303 000 | 132 000 | 171 000 | 45.5 | 19.8 | 25.7 | 6.58 | 131 |
| 1995-2000 | 345 000 | 144 000 | 201 000 | 43.4 | 18.1 | 25.3 | 6.19 | 119 |
| 2000-2005 | 361 000 | 136 000 | 224 000 | 41.5 | 15.7 | 25.8 | 5.80 | 104 |
| 2005-2010 | 380 000 | 132 000 | 248 000 | 39.9 | 13.9 | 26.1 | 5.45 | 93 |
| * CBR = crude birth rate (per 1000); CDR = crude death rate (per 1000); NC = natural change (per 1000); IMR = infant mortality rate per 1000 births; TFR = total fertility rate (number of children per woman) | ||||||||
Fertility and Births
Total Fertility Rate (TFR) (Wanted Fertility Rate) and Crude Birth Rate (CBR):[2]
| Year | CBR (Total) | TFR (Total) | CBR (Urban) | TFR (Urban) | CBR (Rural) | TFR (Rural) |
|---|---|---|---|---|---|---|
| 1992 | 41 | 5,67 (5,1) | 37 | 5,18 (4,5) | 42 | 5,89 (5,3) |
| 1999 | 36,9 | 5,5 (5,0) | 32,9 | 4,4 (3,8) | 38,4 | 6,1 (5,6) |
| 2005 | 38,4 | 5,7 (5,1) | 31,8 | 4,4 (3,9) | 40,8 | 6,3 (5,7) |
| 2012 | 34 | 5,1 (4,0) | 29,4 | 3,8 (2,9) | 36,1 | 5,8 (4,6) |
Ethnic groups
- Fulɓe (singular Pullo). Called Peuhl or Peul in French, Fula or Fulani in English, who are chiefly found in the mountainous region of Fouta Djallon;
- Maninka. Malinke in French, Mandingo in English, mostly inhabiting the savanna of Upper Guinea and the Forest region;
- Susus or Soussous. Susu is not a lingua franca in Guinea. Although it is commonly spoken in the coastal areas, including the capital, Conakry, it is not largely understood in the interior of the country.
- Several small groups (Gerzé or Kpelle, Toma, Kissis, etc.) in the forest region and Bagas (including Landoumas), Koniagis etc. in the coastal area.
West Africans make up the largest non-Guinean population. Non-Africans total about 30,000 (mostly French, other Europeans, and Lebanese). Seven national languages are used extensively; the major written languages are French, Pular (English: Fula; French: Peul or Peuhl), and Arabic.
Other languages have established Latin orthographies that are used somewhat, notably for Susu and Maninka. The N'Ko alphabet is increasingly used on a grassroots level for the Maninka language.
CIA World Factbook demographic statistics
The following demographic statistics are from the CIA World Factbook, unless otherwise indicated.
Population
10,601,009 (July 2011 est.)
Population growth rate
2.645% (2011 est.)
Net migration rate
0 migrant(s)/1,000 population (2006 est.)
note
as a result of conflict in neighboring countries, Guinea is host to approximately 141,500 refugees from Côte d'Ivoire, Liberia, and Sierra Leone (2006 est.)
Sex ratio
at birth
1.03 male(s)/female
under 15 years
1.02 male(s)/female
15-64 years
1 male(s)/female
65 years and over
0.78 male(s)/female
total population
1 male(s)/female (2011 est.)
Life expectancy at birth
total population
58.11 years
male
56.63 years
female
59.64 years (2011 est.)
Nationality
noun
Guinean(s)
adjective
Guinean
Ethnic groups[3]
- Fulani (Peul) 33.9%
- Malinke 31.1%
- Soussou 19.1%
- Guerze 6%
- Kissi 4.7%
- Toma 2.6%
- Other/No Answer 2.7% (2012 est.)
Religions [3]
Languages [3]
French (official), each ethnic group has its own language
Literacy
definition
age 15 and over can read and write
total population
29.5%
male
42.6%
female
18.1% (2003 est.)
References
| Wikimedia Commons has media related to Demographics of Guinea. |
- 1 2 Population Division of the Department of Economic and Social Affairs of the United Nations Secretariat, World Population Prospects: The 2010 Revision
- ↑ http://microdata.worldbank.org/index.php/catalog/dhs#_r=&collection=&country=&dtype=&from=1890&page=6&ps=&sk=&sort_by=nation&sort_order=&to=2014&topic=&view=s&vk=
- 1 2 3 "Africa :::GUINEA". CIA The World Factbook.
![]() This article incorporates public domain material from the CIA World Factbook document "2007 edition".
This article incorporates public domain material from the CIA World Factbook document "2007 edition".