Kentucky's 3rd congressional district
| Kentucky's 3rd congressional district | ||
|---|---|---|
.tif.png) | ||
| Current Representative | John Yarmuth (D–Louisville) | |
| Distribution | 98.28% urban, 1.72% rural | |
| Population (2000) | 674,032 | |
| Median income | $39,468 | |
| Ethnicity | 77.0% White, 19.3% Black, 1.4% Asian, 1.8% Hispanic, 0.2% Native American, 0.2% other | |
| Cook PVI | D+4[1] | |
Kentucky's 3rd congressional district is a congressional district in the U.S. state of Kentucky. The most regularly drawn of the Commonwealth's six congressional districts, it encompasses almost all of Louisville Metro, which, since the merger of 2003, is contiguous with Jefferson County. The far southeast reaches of Louisville Metro are part of the 4th Congressional District.
The district is currently represented by Democrat John Yarmuth.
Characteristics
This district is heavily Democratic, and is fully contained within Jefferson County, Kentucky. It has the highest percentage of African Americans in the state, who are concentrated in and near Louisville. It is a cosmopolitan, diverse district, with major businesses, health care organizations and universities.
As of September 2013, there were 518,028 registered voters: 305,121 (58.90%) Democrats, 166,271 (32.10%) Republicans, and 46,636 (9.00%) "Others". All of the "Others" included 35,209 (6.80%) unclassified Others, 10,528 (2.03%) Independents, 678 (0.13%) Libertarians, 177 (0.03%) Greens, 28 (0.0054%) Constitutionalists, 3 (0.0005%) Reforms, and 13 (0.0025%) Socialist Workers.[2][3]
Until January 1, 2006, Kentucky did not track party affiliation for registered voters who were neither Democratic nor Republican.[4] The Kentucky voter registration card does not explicitly list anything other than Democratic Party, Republican Party, or Other, with the "Other" option having a blank line and no instructions on how to register as something else.[5]
List of representatives
| Representative | Party | Years | District Residence | Note |
|---|---|---|---|---|
| District created |
March 4, 1803 | |||
 Matthew Walton Matthew Walton | March 4, 1803 – March 3, 1807 | |||
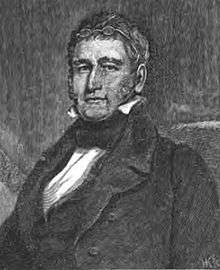 John Rowan John Rowan | March 4, 1807 – March 3, 1809 | |||
 Henry Crist Henry Crist | March 4, 1809 – March 3, 1811 | |||
 Stephen Ormsby Stephen Ormsby | March 4, 1811 – March 3, 1813 | |||
 Richard M. Johnson Richard M. Johnson | March 4, 1813 – March 3, 1819 | Redistricted from the 4th district | ||
 William Brown William Brown | March 4, 1819 – March 3, 1821 | |||
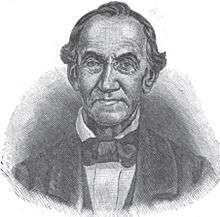 John T. Johnson John T. Johnson | March 4, 1821 – March 3, 1823 | Redistricted to the 5th district | ||
 Henry Clay Henry Clay | March 3, 1823 – March 3, 1825 | |||
| March 4, 1825 – March 6, 1825 | Resigned after being appointed United States Secretary of State | |||
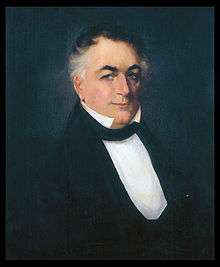 James Clark James Clark | August 1, 1825 – March 3, 1829 | |||
| March 4, 1829 – March 4, 1831 | ||||
 Chilton Allan Chilton Allan | March 4, 1831 – March 3, 1833 | Redistricted to the 10th district | ||
 Christopher Tompkins Christopher Tompkins | March 4, 1833 – March 3, 1835 | Redistricted from the 10th district | ||
 Joseph R. Underwood Joseph R. Underwood | March 4, 1835 – March 3, 1837 | |||
| March 4, 1837 – March 3, 1843 | ||||
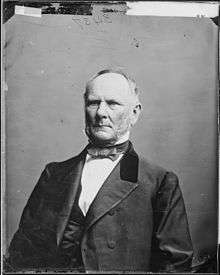 Henry Grider Henry Grider | March 4, 1843 – March 3, 1847 | |||
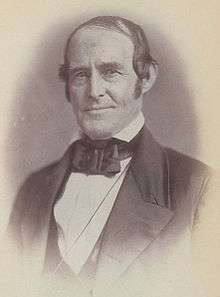 Samuel Peyton Samuel Peyton | March 4, 1847 – March 3, 1849 | |||
 Finis McLean Finis McLean | March 4, 1849 – March 3, 1851 | |||
 Presley Ewing Presley Ewing | March 4, 1851 – September 27, 1854 | Died | ||
 Francis Bristow Francis Bristow | December 4, 1854 – March 3, 1855 | |||
 Warner Underwood Warner Underwood | March 4, 1855 – March 3, 1859 | |||
 Francis Bristow Francis Bristow | March 4, 1859 – March 3, 1861 | |||
 Henry Grider Henry Grider | March 4, 1861 – March 3, 1865 | |||
| March 4, 1865 – September 7, 1866 | Died | |||
 Elijah Hise Elijah Hise | December 3, 1866 – May 8, 1867 | Died | ||
 Jacob Golladay Jacob Golladay | December 5, 1867 – February 28, 1870 | Resigned | ||
 Joseph H. Lewis Joseph H. Lewis | May 10, 1870 – March 3, 1873 | |||
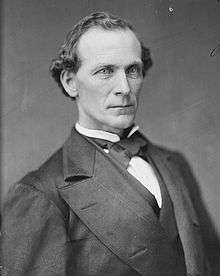 Charles W. Milliken Charles W. Milliken | March 4, 1873 – March 3, 1877 | |||
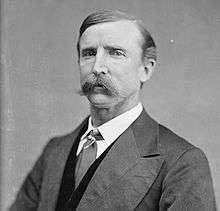 John W. Caldwell John W. Caldwell | March 4, 1877 – March 3, 1883 | |||
 John E. Halsell John E. Halsell | March 4, 1883 – March 3, 1887 | |||
 W. Godfrey Hunter W. Godfrey Hunter | March 4, 1887 – March 3, 1889 | |||
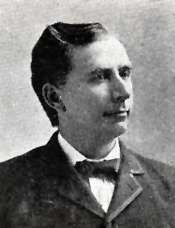 Isaac Goodnight Isaac Goodnight | March 4, 1889 – March 3, 1895 | |||
 W. Godfrey Hunter W. Godfrey Hunter | March 4, 1895 – March 3, 1897 | |||
 John S. Rhea John S. Rhea | March 4, 1897 – March 25, 1902 | Lost contested election | ||
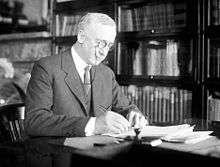 J. McKenzie Moss J. McKenzie Moss | March 25, 1902 – March 3, 1903 | Won contested election | ||
 John S. Rhea John S. Rhea | March 4, 1903 – March 3, 1905 | |||
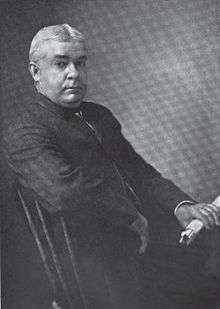 James M. Richardson James M. Richardson | March 4, 1905 – March 3, 1907 | |||
 Addison James Addison James | March 4, 1907 – March 3, 1909 | |||
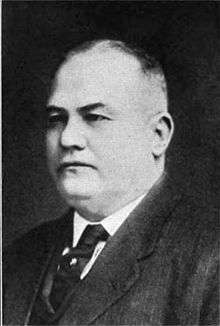 Robert Y. Thomas, Jr. Robert Y. Thomas, Jr. | March 4, 1909 – September 3, 1925 | Died | ||
 John W. Moore John W. Moore | December 26, 1925 – March 3, 1929 | |||
 Charles W. Roark Charles W. Roark | March 4, 1929 – April 5, 1929 | Died | ||
 John W. Moore John W. Moore | June 1, 1929 – March 3, 1933 | |||
| District redistricted to at-large district | March 4, 1933 | |||
| District re-established from at-large district | January 3, 1935 | |||
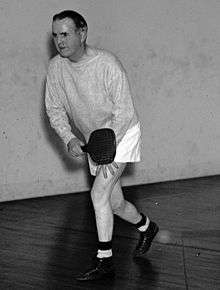 Emmet O'Neal Emmet O'Neal | January 3, 1935 – January 3, 1947 | |||
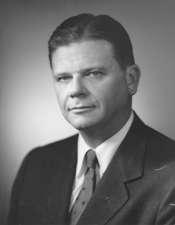 Thruston B. Morton Thruston B. Morton | January 3, 1947 – January 3, 1953 | |||
 John M. Robsion, Jr. John M. Robsion, Jr. | January 3, 1953 – January 3, 1959 | |||
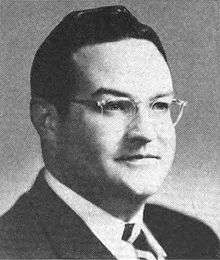 Frank W. Burke Frank W. Burke | January 3, 1959 – January 3, 1963 | |||
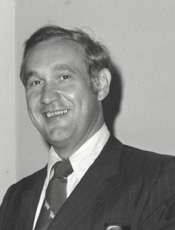 Gene Snyder Gene Snyder | January 3, 1963 – January 3, 1965 | |||
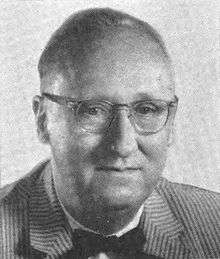 Charles R. Farnsley Charles R. Farnsley | January 3, 1965 – January 3, 1967 | |||
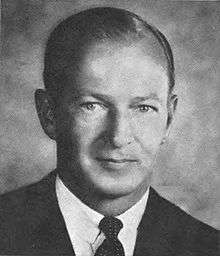 William O. Cowger William O. Cowger | January 3, 1967 – January 3, 1971 | |||
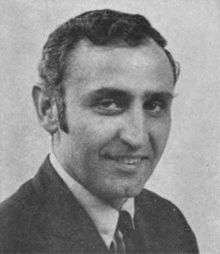 Romano L. Mazzoli Romano L. Mazzoli | January 3, 1971 – January 3, 1995 | |||
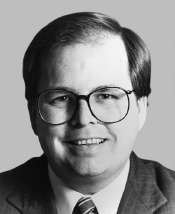 Mike Ward Mike Ward | January 3, 1995 – January 3, 1997 | |||
 Anne Northup Anne Northup | January 3, 1997 – January 3, 2007 | |||
 John Yarmuth John Yarmuth | January 3, 2007 – Present | |||
Recent election results
2002
| Party | Candidate | Votes | % | |
|---|---|---|---|---|
| Republican | Anne Northup* | 118,228 | 51.61 | |
| Democratic | Jack Conway | 110,846 | 48.39 | |
| Total votes | 229,074 | 100.00 | ||
| Voter turnout | % | |||
| Republican hold | ||||
2004
| Party | Candidate | Votes | % | |
|---|---|---|---|---|
| Republican | Anne Northup* | 197,736 | 60.26 | |
| Democratic | Tony Miller | 124,040 | 37.80 | |
| Libertarian | George C. Dick | 6,363 | 1.94 | |
| Total votes | 328,139 | 100.00 | ||
| Voter turnout | % | |||
| Republican hold | ||||
2006
| Party | Candidate | Votes | % | |||
|---|---|---|---|---|---|---|
| Democratic | John Yarmuth | 122,471 | 50.62 | |||
| Republican | Anne Northup | 116,555 | 48.18 | |||
| Libertarian | Donna Walker Mancini | 2,134 | 0.88 | |||
| Constitution | W. Ed Parker | 774 | 0.32 | |||
| Total votes | 241,934 | 100.00 | ||||
| Voter turnout | % | |||||
| Democratic gain from Republican | ||||||
2008
| Party | Candidate | Votes | % | |
|---|---|---|---|---|
| Democratic | John Yarmuth* | 203,843 | 59.37 | |
| Republican | Anne Northup | 139,527 | 40.64 | |
| Libertarian | Ed Martin | Republican sued; votes not counted | 0.00 | |
| Total votes | 343,370 | 100.00 | ||
| Voter turnout | % | |||
| Democratic hold | ||||
2010
| Party | Candidate | Votes | % | |
|---|---|---|---|---|
| Democratic | John Yarmuth* | 139,940 | 54.68 | |
| Republican | Todd Lally | 112,627 | 44.01 | |
| Libertarian | Ed Martin | 2,029 | 0.79 | |
| Independent | Michael Hansen | 1,334 | 0.52 | |
| Total votes | 255,930 | 100.00 | ||
| Voter turnout | % | |||
| Democratic hold | ||||
2012
| Party | Candidate | Votes | % | |
|---|---|---|---|---|
| Democratic | John Yarmuth* | 206,385 | 63.96 | |
| Republican | Brooks Wicker | 111,452 | 34.54 | |
| Independent | Robert L. DeVore, Jr. | 4.819 | 1.49 | |
| Total votes | 322,656 | 100.0 | ||
| Voter turnout | % | |||
| Democratic hold | ||||
2014
| Party | Candidate | Votes | % | |
|---|---|---|---|---|
| Democratic | John Yarmuth (Incumbent) | 157,056 | 63.5 | |
| Republican | Michael MacFarlane | 87,981 | 35.6 | |
| Independent | Gregory Peter Puccetti | 2,318 | 0.9 | |
| Total votes | 247,355 | 100 | ||
| Democratic hold | ||||
Historical district boundaries

See also
References
- Specific
- ↑ "Partisan Voting Index Districts of the 113th Congress: 2004 & 2008" (PDF). The Cook Political Report. 2012. Retrieved 2013-01-10.
- ↑ "Registration Statistics: By Congression District". Kentucky State Board of Elections. September 2013. Retrieved 2014-02-06.
- ↑ "Registration Statistics: Other Political Organizations and Groups". Kentucky State Board of Elections. September 2013. Retrieved 2014-02-06.
- ↑ "Kentucky Administrative Regulations 31KAR4:150". Kentucky Legislative Research Commission. November 2005. Retrieved 2014-02-06.
- ↑ "Register To Vote". Kentucky State Board of Elections. August 2003. Retrieved 2014-02-06.
- ↑ "General Elections Results" (PDF). Kentucky Secretary of State. 2014-11-04. Retrieved 2014-12-19.
- General
- Martis, Kenneth C. (1989). The Historical Atlas of Political Parties in the United States Congress. New York: Macmillan Publishing Company.
- Martis, Kenneth C. (1982). The Historical Atlas of United States Congressional Districts. New York: Macmillan Publishing Company.
- Congressional Biographical Directory of the United States 1774–present
See also
Coordinates: 38°15′N 85°45′W / 38.250°N 85.750°W