Leitrim County Council election, 2004
Leitrim County Council election, 2004

|
|
|
|
|

|
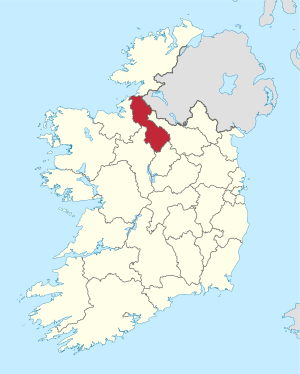
| Map showing the area of Leitrim County Council |
|
Council control after election
TBD
|
|
|
An election to Leitrim County Council took place on 11 June 2004 as part of that year's Irish local elections. 22 councillors were elected from four electoral divisions by PR-STV voting for a five-year term of office.
Results by party
Results by Electoral Area
Ballinamore
| Ballinamore - 6 seats |
| Party | Candidate | % 1st Pref | Count 1 | Count 2 | Count 3 | Count 4 |
|
Sinn Féin |
Martin Kenny* |
17.71 |
860 |
|
|
|
|
Fianna Fáil |
Paddy O'Rourke |
15.63 |
759 |
|
|
|
|
Fine Gael |
Damien Brennan* |
15.24 |
740 |
|
|
|
|
Fianna Fáil |
Caillian Ellis* |
14.33 |
696 |
|
|
|
|
Fianna Fáil |
J.J. Shortt* |
13.06 |
634 |
690 |
723 |
|
|
Fine Gael |
Gordon Hughes |
12.77 |
620 |
679 |
683 |
707 |
|
Fine Gael |
John McCartin |
5.36 |
547 |
598 |
626 |
648 |
| Electorate: 6,421 Valid: 4,856 (75.63%) Spoilt: 44 Quota: 694 Turnout: 4,900 (76.31%) |
Carrick-on-Shannon
| Carrick-on-Shannon - 6 seats |
| Party | Candidate | % 1st Pref | Count 1 | Count 2 | Count 3 | Count 4 | Count 5 | Count 6 | Count 7 | Count 8 |
|
Fianna Fáil |
Seán McGowan* |
16.02 |
770 |
|
|
|
|
|
|
|
|
Independent |
Enda Stenson* |
15.69 |
754 |
|
|
|
|
|
|
|
|
Fine Gael |
Gerry Reynolds* |
14.08 |
677 |
687 |
|
|
|
|
|
|
|
Fine Gael |
Thomas Mulligan* |
12.09 |
581 |
601 |
651 |
674 |
739 |
|
|
|
|
Fianna Fáil |
Sinead Guckian* |
11.28 |
542 |
564 |
576 |
589 |
644 |
654 |
807 |
|
|
Fianna Fáil |
Gerry McGee* |
8.32 |
400 |
416 |
432 |
441 |
465 |
479 |
492 |
504 |
|
Fianna Fáil |
Liam McElgunn* |
7.97 |
383 |
386 |
386 |
393 |
415 |
416 |
519 |
591 |
|
Fine Gael |
Percy French |
7.26 |
349 |
353 |
360 |
370 |
384 |
393 |
|
|
|
Sinn Féin |
Maura Mulvey |
4.66 |
224 |
229 |
257 |
262 |
|
|
|
|
|
Independent |
John McCrann |
2.64 |
127 |
130 |
|
|
|
|
|
|
| Electorate: 6,902 Valid: 4,807 (69.65%) Spoilt: 36 Quota: 687 Turnout: 4,843 (70.17%) |
Dromahaire
| Dromahaire - 5 seats |
| Party | Candidate | % 1st Pref | Count 1 | Count 2 | Count 3 | Count 4 | Count 5 | Count 6 |
|
Fine Gael |
John McTernan* |
16.66 |
722 |
|
|
|
|
|
|
Fianna Fáil |
Francis Gilmartin* |
13.66 |
592 |
602 |
620 |
646 |
754 |
|
|
Fine Gael |
Carmel McPadden* |
11.70 |
507 |
518 |
536 |
578 |
596 |
601 |
|
Independent |
Gerry Dolan* |
11.65 |
505 |
529 |
617 |
667 |
767 |
|
|
Fine Gael |
Enda McGloin |
11.07 |
480 |
484 |
499 |
504 |
686 |
714 |
|
Fianna Fáil |
Mary Bohan* |
11.65 |
456 |
461 |
495 |
612 |
657 |
668 |
|
Fianna Fáil |
Sean Nolan |
8.68 |
429 |
430 |
450 |
475 |
|
|
|
Fianna Fáil |
Eugene O'Neill |
8.68 |
295 |
301 |
318 |
|
|
|
|
Sinn Féin |
John McCauley |
8.68 |
241 |
260 |
|
|
|
|
|
Green Party |
Johnny Gogan |
8.68 |
108 |
|
|
|
|
|
| Electorate: 5,788 Valid: 4,335 (74.90%) Spoilt: 50 Quota: 723 Turnout: 4,385 (75.66%) |
Manorhamilton
| Manorhamilton - 5 seats |
| Party | Candidate | % 1st Pref | Count 1 | Count 2 | Count 3 | Count 4 |
|
Fianna Fáil |
Tony Ferguson* |
19.28 |
732 |
|
|
|
|
Sinn Féin |
Michael Colreavy* |
17.44 |
662 |
|
|
|
|
Fine Gael |
Séan McDermott |
16.10 |
611 |
617 |
622 |
714 |
|
Fine Gael |
Frank Dolan* |
15.38 |
584 |
588 |
594 |
684 |
|
Fianna Fáil |
Aodh Flynn* |
11.91 |
452 |
487 |
493 |
603 |
|
Labour Party |
Gabriel McSharry |
10.19 |
387 |
394 |
402 |
|
|
Fine Gael |
Siobhán McGloin* |
7.66 |
368 |
415 |
419 |
469 |
| Electorate: 5,452 Valid: 3,796 (69.63%) Spoilt: 55 Quota: 633 Turnout: 3,851 (70.63%) |
External links
