South Dublin County Council election, 2004
South Dublin County Council election, 2004

|
|
|
|
|
|
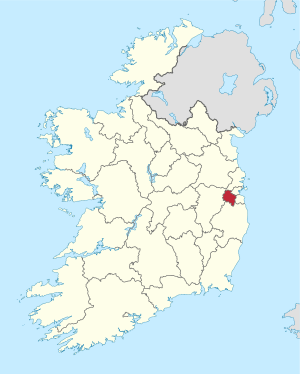
| Map showing the area of South Dublin County Council |
|
Council control after election
TBD
|
|
|
An election to South Dublin County Council took place on 11 June 2004 as part of that year's Irish local elections. 26 councillors were elected from five electoral divisions using the Single transferable vote system for a five-year term of office.
Results by party
Results by Electoral Area
Clondalkin
| Clondalkin - 5 seats |
| Party | Candidate | % 1st Pref | Count 1 | Count 2 | Count 3 | Count 4 | Count 5 | Count 6 | Count 7 | Count 8 | Count 9 |
|
Sinn Féin |
Shane O'Connor |
17.07 |
2,421 |
|
|
|
|
|
|
|
|
|
Labour Party |
Robert Dowds* |
14.06 |
1,994 |
2,007 |
2,013 |
2,053 |
2,375 |
|
|
|
|
|
Fine Gael |
Therese Ridge* |
12.08 |
1,714 |
1,723 |
1,729 |
1,771 |
1,847 |
1,936 |
2,051 |
2,247 |
2,503 |
|
Progressive Democrats |
Colm Tyndall* |
11.47 |
1,627 |
1,636 |
1,640 |
1,768 |
1,791 |
1,912 |
2,099 |
2,285 |
2,627 |
|
Socialist Workers |
Gino Kenny |
7.36 |
1,044 |
1,068 |
1,083 |
1,092 |
1,164 |
1,183 |
1,203 |
1,336 |
1,451 |
|
Fianna Fáil |
Trevor Gilligan |
6.47 |
918 |
927 |
930 |
988 |
1,038 |
1,214 |
1,574 |
1,716 |
1,875 |
|
Green Party |
Dorothy Corrigan |
6.35 |
900 |
912 |
920 |
930 |
975 |
1,008 |
1,059 |
|
|
|
Independent |
Colm McGrath* |
6.07 |
861 |
905 |
911 |
947 |
968 |
1,013 |
1,103 |
1,238 |
|
|
Labour Party |
Marie Grogan |
4.84 |
686 |
691 |
696 |
700 |
|
|
|
|
|
|
Fianna Fáil |
Sheila O'Brien* |
4.77 |
677 |
680 |
681 |
783 |
801 |
969 |
|
|
|
|
Fianna Fáil |
Neil O'Neill |
4.21 |
597 |
604 |
606 |
728 |
741 |
|
|
|
|
|
Fianna Fáil |
Ray Verso |
4.18 |
593 |
593 |
594 |
|
|
|
|
|
|
|
Independent |
Noel Kelly |
1.06 |
151 |
|
|
|
|
|
|
|
|
| Electorate: 30,462 Valid: 14,183 (46.56%) Spoilt: 344 Quota: 2,364 Turnout: 14,527 (47.69%) |
Lucan
| Lucan - 4 seats |
| Party | Candidate | % 1st Pref | Count 1 | Count 2 | Count 3 | Count 4 | Count 5 | Count 6 | Count 7 | Count 8 |
|
Independent |
Derek Keating* |
21.75 |
3,680 |
|
|
|
|
|
|
|
|
Green Party |
Fintan McCarthy* |
14.40 |
2,440 |
2,547 |
2,691 |
2,923 |
3,036 |
3,454 |
|
|
|
Labour Party |
Eamon Tuffy* |
10.48 |
1,774 |
1,807 |
1,873 |
2,019 |
2,095 |
2,338 |
2,363 |
3,110 |
|
Independent |
Guss O'Connell |
9.98 |
1,688 |
1,720 |
1,742 |
1,820 |
2,192 |
2,542 |
2,574 |
2,879 |
|
Sinn Féin |
Feilim MacCriosta |
9.11 |
1,542 |
1,552 |
1,580 |
1,640 |
1,755 |
|
|
|
|
Fine Gael |
Peter Brady |
8.10 |
1,370 |
1,405 |
1,664 |
1,923 |
2,013 |
2,134 |
2,142 |
|
|
Fianna Fáil |
Des Kelly |
7.42 |
1,255 |
1,274 |
1,399 |
1,588 |
2,066 |
2,175 |
2,179 |
2,607 |
|
Fianna Fáil |
Deirdre Doherty-Ryan* |
7.20 |
1,218 |
1,227 |
1,302 |
1,431 |
|
|
|
|
|
Progressive Democrats |
Jeff Aherne |
6.49 |
1,098 |
1,127 |
1,233 |
|
|
|
|
|
|
Fianna Fáil |
Ed O'Brien |
2.84 |
480 |
493 |
|
|
|
|
|
|
|
Fine Gael |
Joe MacEnri |
2.22 |
376 |
384 |
|
|
|
|
|
|
| Electorate: 32,269 Valid: 16,921 (52.44%) Spoilt: 311 Quota: 3,385 Turnout: 17,232 (53.40%) |
Tallaght Central
| Tallaght Central - 5 seats |
| Party | Candidate | % 1st Pref | Count 1 | Count 2 | Count 3 | Count 4 | Count 5 | Count 6 | Count 7 | Count 8 | Count 9 |
|
Socialist Party |
Mick Murphy |
16.10 |
2,505 |
2,552 |
2,654 |
|
|
|
|
|
|
|
Sinn Féin |
Mark Daly* |
13.74 |
2,138 |
1,308 |
1,360 |
1,404 |
1,440 |
1,501 |
1,504 |
1,506 |
|
|
Fine Gael |
Karen Warren |
10.44 |
1,624 |
1,702 |
1,808 |
1,863 |
1,898 |
1,933 |
2,052 |
2,415 |
2,423 |
|
Labour Party |
Eamonn Maloney* |
9.99 |
1,554 |
1,572 |
1,634 |
1,672 |
1,691 |
1,735 |
1,810 |
2,220 |
2,243 |
|
Labour Party |
Don Tipping* |
8.50 |
1,322 |
1,352 |
1,422 |
1,454 |
1,495 |
1,558 |
1,628 |
|
|
|
Fianna Fáil |
Joe Neville |
8.37 |
1,302 |
1,396 |
1,421 |
1,741 |
1,784 |
1,828 |
2,437 |
2,561 |
2,567 |
|
Labour Party |
Denis Mackin* |
7.78 |
1,210 |
1,233 |
1,329 |
1,385 |
1,477 |
1,616 |
1,691 |
2,192 |
2,216 |
|
Sinn Féin |
Seán O Cadhla |
6.47 |
1,007 |
1,027 |
1,066 |
1,092 |
|
|
|
|
|
|
Fianna Fáil |
Roderick Smyth* |
6.35 |
988 |
1,067 |
1,088 |
1,191 |
1,223 |
1,249 |
|
|
|
|
Fianna Fáil |
Margaret Farrell |
4.52 |
703 |
735 |
760 |
|
|
|
|
|
|
|
Green Party |
Shauna Hutchinson-Edgar |
4.17 |
648 |
710 |
|
|
|
|
|
|
|
|
Progressive Democrats |
Paula McCormack |
3.57 |
556 |
|
|
|
|
|
|
|
|
| Electorate: 29,520 Valid: 15,557 (52.70%) Spoilt: 500 Quota: 2,593 Turnout: 16,057 (54.39%) |
Tallaght South
| Tallaght South - 5 seats |
| Party | Candidate | % 1st Pref | Count 1 | Count 2 | Count 3 | Count 4 | Count 5 | Count 6 | Count 7 | Count 8 | Count 9 | Count 10 |
|
Fianna Fáil |
John Hannon* |
14.63 |
2,221 |
2,226 |
2,314 |
2,406 |
2,494 |
2,731 |
|
|
|
|
|
Sinn Féin |
Cathal King* |
11.74 |
1,782 |
1,812 |
1,901 |
1,908 |
1,957 |
2,026 |
2,030 |
3,234 |
|
|
|
Fianna Fáil |
Jim Daly* |
10.59 |
1,607 |
1,610 |
1,642 |
1,804 |
1,853 |
1,924 |
1,976 |
2,017 |
2,093 |
2,108 |
|
Labour Party |
Marie Corr |
9.77 |
1,483 |
1,500 |
1,538 |
1,587 |
1,793 |
2,055 |
2,101 |
2,204 |
2,433 |
2,565 |
|
Fianna Fáil |
Mick Billane* |
9.73 |
1,477 |
1,487 |
1,631 |
1,663 |
1,713 |
1,786 |
1,822 |
1,891 |
2,007 |
2,018 |
|
Sinn Féin |
Brendan Ferron |
9.68 |
1,469 |
1,484 |
1,520 |
1,532 |
1,624 |
1,716 |
1,721 |
|
|
|
|
Labour Party |
Caitriona Jones |
9.45 |
1,435 |
1,454 |
1,479 |
1,542 |
1,814 |
2,324 |
2,361 |
2,489 |
2,693 |
|
|
Fine Gael |
Paul Ringland* |
8.80 |
1,336 |
1,345 |
1,361 |
1,442 |
1,548 |
|
|
|
|
|
|
Green Party |
Elizabeth Davidson |
6.59 |
1,000 |
1,041 |
1,063 |
1,125 |
|
|
|
|
|
|
|
Progressive Democrats |
Rita Hayes |
3.91 |
594 |
599 |
609 |
|
|
|
|
|
|
|
|
Fianna Fáil |
Ambrose Sheilds |
3.69 |
560 |
579 |
|
|
|
|
|
|
|
|
|
Independent |
Mark Luttrell |
1.43 |
217 |
|
|
|
|
|
|
|
|
|
| Electorate: 34,251 Valid: 15,181 (44.32%) Spoilt: 538 Quota: 2,531 Turnout: 15,719 (45.89%) |
Terenure-Rathfarnam
| Terenure-Rathfarnam - 7 seats |
| Party | Candidate | % 1st Pref | Count 1 | Count 2 | Count 3 | Count 4 | Count 5 | Count 6 | Count 7 | Count 8 | Count 9 |
|
Fianna Fáil |
John Lahart* |
13.14 |
3,828 |
|
|
|
|
|
|
|
|
|
Progressive Democrats |
Cáit Keane* |
9.66 |
2,814 |
2,965 |
2,987 |
3,089 |
3,204 |
3,491 |
3,612 |
3,845 |
|
|
Fine Gael |
Stanley Laing* |
8.55 |
2,490 |
2,559 |
2,568 |
2,676 |
3,139 |
3,263 |
3,340 |
3,534 |
3,588 |
|
Independent |
Pat Dunne |
7.57 |
2,207 |
2,250 |
2,252 |
2,308 |
2,323 |
2,362 |
2,718 |
|
|
|
Fianna Fáil |
Máire Ardagh* |
7.42 |
2,161 |
2,607 |
2,650 |
2,694 |
2,723 |
3,333 |
3,490 |
3,703 |
|
|
Labour Party |
Alex White |
7.24 |
2,109 |
2,143 |
2,149 |
2,413 |
2,507 |
2,617 |
2,773 |
2,994 |
3,011 |
|
Green Party |
Tony McDermott |
7.02 |
2,045 |
2,076 |
2,086 |
2,245 |
2,334 |
2,582 |
3,033 |
3,515 |
3,572 |
|
Fine Gael |
Michael McLoughlin |
6.68 |
1,947 |
1,964 |
1,977 |
2,054 |
2,667 |
2,747 |
2,807 |
2,876 |
2,889 |
|
Sinn Féin |
Sorcha Nic Cormaic |
6.44 |
1,876 |
1,913 |
1,919 |
1,989 |
2,010 |
2,082 |
|
|
|
|
Labour Party |
Eamonn Walsh* |
6.19 |
1,803 |
1,853 |
1,855 |
2,303 |
2,375 |
2,429 |
2,734 |
3,455 |
3,496 |
|
Fianna Fáil |
Vincent Kenny* |
5.44 |
1,585 |
1,818 |
1,869 |
1,911 |
1,973 |
|
|
|
|
|
Labour Party |
Paddy Cosgrave |
5.00 |
1,456 |
1,476 |
1,485 |
|
|
|
|
|
|
|
Fianna Fáil |
Alan Foran |
4.17 |
1,215 |
|
|
|
|
|
|
|
|
| Electorate: 53,201 Valid: 29,139 (54.77%) Spoilt: 727 Quota: 3,643 Turnout: 29,866 (56.14%) |
External links