List of countries by number of Internet users
Further information: Global Internet usage
 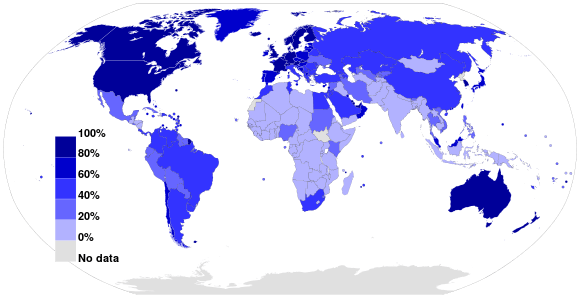 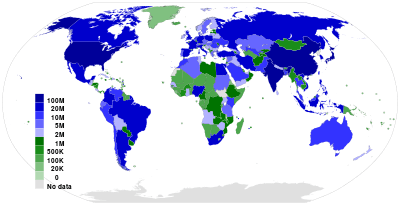  |
Below is a sortable list of countries by number of Internet users as of 2015. Internet users are defined as persons who accessed the Internet in the last 12 months from any device, including mobile phones.[Note 1] Percentage is the percentage of a country's population that are Internet users. Estimates are derived from either household surveys or from Internet subscription data.[5]
Non-countries and disputed areas are shown in italics. All United Nations member states are included, except North Korea. Taiwan is listed as a sovereign country.
| ||||||||||||||||||||||||||||||||
| ||||||||||||||||||||||||||||||||
List
| Country or area | Internet users |
Rank | Percentage | Rank |
|---|---|---|---|---|
| |
692,152,618 | 1 | 50.30% | 90 |
| |
340,873,137 | 2 | 26.00% | 127 |
| |
239,882,242 | 3 | 74.55% | 40 |
| |
122,796,320 | 4 | 59.08% | 71 |
| |
118,131,030 | 5 | 93.33% | 9 |
| |
105,311,724 | 6 | 73.41% | 43 |
| |
86,436,611 | 7 | 47.44% | 95 |
| |
72,945,992 | 8 | 57.43% | 85 |
| |
70,675,097 | 9 | 87.59% | 16 |
| |
59,538,545 | 10 | 92.00% | 27 |
| |
56,612,527 | 11 | 21.98% | 127 |
| |
54,536,418 | 12 | 84.69% | 14 |
| |
49,265,575 | 13 | 52.72% | 104 |
| |
45,213,802 | 14 | 89.90% | 22 |
| |
42,275,017 | 15 | 53.74% | 94 |
| |
40,984,654 | 16 | 40.70% | 121 |
| |
39,209,342 | 17 | 65.57% | 73 |
| |
36,293,165 | 18 | 78.69% | 23 |
| |
34,871,367 | 19 | 44.08% | 130 |
| |
34,006,477 | 20 | 18.00% | 147 |
| |
32,851,402 | 21 | 35.90% | 89 |
| |
31,796,053 | 22 | 88.47% | 20 |
| |
30,131,228 | 23 | 69.40% | 68 |
| |
28,291,419 | 24 | 51.92% | 90 |
| |
26,959,845 | 25 | 55.90% | 84 |
| |
26,721,620 | 26 | 39.32% | 132 |
| |
26,256,020 | 27 | 68.00% | 63 |
| |
23,183,372 | 28 | 14.40% | 112 |
| |
22,080,187 | 29 | 49.26% | 65 |
| |
21,958,407 | 30 | 69.62% | 66 |
| |
21,553,214 | 31 | 71.06% | 51 |
| |
21,008,148 | 32 | 45.62% | 113 |
| |
20,268,164 | 33 | 84.56% | 24 |
| |
19,622,683 | 34 | 57.08% | 76 |
| |
19,246,571 | 35 | 61.87% | 77 |
| |
18,639,773 | 36 | 80.00% year 2013 | 29 |
| |
15,757,109 | 37 | 93.10% | 7 |
| |
15,152,610 | 38 | 38.20% | 149 |
| |
12,843,502 | 39 | 72.87% | 80 |
| |
12,833,058 | 40 | 40.90% | 112 |
| |
12,794,413 | 41 | 42.80% | 115 |
| |
11,749,580 | 42 | 21.80% | 205 |
| |
11,538,860 | 43 | 64.29% | 53 |
| |
11,529,327 | 44 | 11.60% | 199 |
| |
10,879,514 | 45 | 55.76% | 88 |
| |
10,706,502 | 46 | 26.61% | 140 |
| |
9,609,963 | 47 | 85.05% | 26 |
| |
8,861,138 | 48 | 90.61% | 4 |
| |
8,571,610 | 49 | 81.30% | 37 |
| |
8,354,813 | 50 | 91.24% | 17 |
| |
7,901,051 | 51 | 48.94% | 110 |
| |
7,510,555 | 52 | 77.00% | 72 |
| |
7,502,024 | 53 | 19.22% | 152 |
| |
7,322,066 | 54 | 66.84% | 69 |
| |
7,300,334 | 55 | 87.97% | 19 |
| |
7,177,413 | 56 | 72.83% | 42 |
| |
7,171,471 | 57 | 83.93% | 28 |
| |
7,103,070 | 58 | 68.63% | 64 |
| |
6,734,886 | 59 | 25.10% | 143 |
| |
6,435,843 | 60 | 23.48% | 164 |
| |
6,361,718 | 61 | 78.89% | 47 |
| |
6,272,109 | 62 | 17.22% | 172 |
| |
6,212,431 | 63 | 29.99% | 141 |
| |
6,191,142 | 64 | 84.95% | 36 |
| |
5,909,252 | 65 | 62.23% | 79 |
| |
5,781,457 | 66 | 65.32% | 45 |
| |
5,547,023 | 67 | 29.98% | 134 |
| |
5,467,393 | 68 | 51.93% | 97 |
| |
5,461,026 | 69 | 96.33% | 5 |
| |
5,460,224 | 70 | 48.52% | 105 |
| |
5,098,953 | 71 | 92.65% | 10 |
| |
5,044,737 | 72 | 96.81% | 3 |
| |
5,012,708 | 73 | 17.58% | 62 |
| |
4,836,842 | 74 | 45.10% | 111 |
| |
4,827,576 | 75 | 20.68% | 180 |
| |
4,767,327 | 76 | 21.00% | 194 |
| |
4,613,404 | 77 | 85.02% | 32 |
| |
4,600,670 | 78 | 82.10% | 40 |
| |
4,428,925 | 79 | 27.10% | 144 |
| |
4,329,550 | 80 | 74.00% | 48 |
| |
4,055,488 | 81 | 53.40% | 99 |
| |
4,051,069 | 82 | 56.66% | 81 |
| |
3,995,066 | 83 | 88.22% | 25 |
| |
3,756,398 | 84 | 80.12% | 31 |
| |
3,543,293 | 85 | 31.11% | 135 |
| |
3,404,471 | 86 | 21.00% | 156 |
| |
3,330,634 | 87 | 74.17% | 54 |
| |
3,281,539 | 88 | 21.69% | 142| |
| |
3,194,648 | 89 | 82.08% | 33 |
| |
3,102,725 | 90 | 12.40% | 145 |
| |
2,959,801 | 91 | 19.00% | 182 |
| |
2,959,741 | 92 | 69.80% | 52 |
| |
2,946,443 | 93 | 44.38% | 123 |
| |
2,936,139 | 94 | 3.80% | 197 |
| |
2,927,069 | 95 | 79.47% | 39 |
| |
2,873,171 | 96 | 59.76% | 96 |
| |
2,866,014 | 97 | 5.36% | 190 |
| |
2,686,694 | 98 | 8.26% | 183 |
| |
2,680,633 | 99 | 57.42% | 92 |
| |
2,552,610 | 100 | 16.36% | 146 |
| |
2,518,008 | 101 | 9.00% | 184 |
| |
2,479,437 | 102 | 65.07% | 43 |
| |
2,216,784 | 103 | 64.60% | 74 |
| |
2,212,528 | 104 | 17.93% | 11 |
| |
2,089,740 | 105 | 18.00% | 174 |
| |
2,076,198 | 106 | 92.88% | 21 |
| |
2,062,224 | 107 | 11.39% | 190 |
| |
2,054,605 | 108 | 71.38% | 50 |
| |
2,027,938 | 109 | 49.84% | 91 |
| |
2,012,113 | 110 | 51.21% | 108 |
| |
1,819,808 | 111 | 10.34% | 195 |
| |
1,806,315 | 112 | 45.16% | 107 |
| |
1,796,838 | 113 | 30.25% | 137 |
| |
1,757,817 | 114 | 58.25% | 93 |
| |
1,740,904 | 115 | 60.10% | 67 |
| |
1,649,276 | 116 | 26.92% | 138 |
| |
1,644,082 | 117 | 20.36% | 148 |
| |
1,609,856 | 118 | 18.98% | 153 |
| |
1,601,017 | 119 | 9.30% | 184 |
| |
1,560,638 | 120 | 79.20% | 34 |
| |
1,511,361 | 121 | 73.10% | 41 |
| |
1,462,815 | 122 | 70.38% | 65 |
| |
1,306,750 | 123 | 12.20% | 169 |
| |
1,287,441 | 124 | 93.48% | 12 |
| |
1,237,968 | 125 | 18.20% | 163 |
| |
1,206,162 | 126 | 43.18% | 117 |
| |
1,198,160 | 127 | 19.70% | 155 |
| |
1,194,159 | 128 | 19.02% | 149 |
| |
1,160,432 | 129 | 88.41% | 29 |
| |
1,010,616 | 130 | 4.17% | 197 |
| |
941,181 | 131 | 69.20% | 61 |
| |
835,753 | 132 | 71.72% | 57 |
| |
806,025 | 133 | 15.00% | 170 |
| |
738,740 | 134 | 6.79% | 187 |
| |
638,388 | 135 | 50.14% | 113 |
| |
634,438 | 136 | 21.44% | 149 |
| |
622,183 | 137 | 27.50% | 159 |
| |
618,270 | 138 | 15.20% | 181 |
| |
601,926 | 139 | 7.90% | 177 |
| |
592,604 | 140 | 4.70% | 202 |
| |
551,968 | 141 | 97.33% | 9 |
| |
548,565 | 142 | 22.31% | 161 |
| |
544,413 | 143 | 4.87% | 204 |
| |
520,086 | 144 | 7.12% | 189 |
| |
455,982 | 145 | 77.60% | 56 |
| |
441,760 | 146 | 2.22% | 200 |
| |
413,331 | 147 | 46.33% | 120 |
| |
405,443 | 148 | 23.50% | 172 |
| |
404,004 | 149 | 64.56% | 75 |
| |
390,981 | 150 | 30.38% | 136 |
| |
379,011 | 151 | 2.70% | 195 |
| |
352,069 | 152 | 7.62% | 176 |
| |
343,098 | 153 | 16.07% | 186 |
| |
340,846 | 154 | 17.12% | 160 |
| |
323,495 | 155 | 98.20% | 1 |
| |
318,943 | 156 | 76.18% | 49 |
| |
308,382 | 157 | 39.80% | 131 |
| |
302,654 | 158 | 78.00% | 44 |
| |
301,310 | 159 | 71.20% | 60 |
| |
293,026 | 160 | 38.20% | 127 |
| |
265,703 | 161 | 5.90% | 188 |
| |
232,176 | 162 | 42.76% | 119 |
| |
223,920 | 163 | 43.02% | 118 |
| |
223,452 | 164 | 4.56% | 192 |
| |
216,316 | 165 | 76.11% | 35 |
| |
198,048 | 166 | 54.46% | 100 |
| |
194,707 | 167 | 74.00% | 55 |
| |
189,853 | 168 | 1.76% | 203 |
| |
182,552 | 169 | 64.56% | 75 |
| |
180,166 | 170 | 21.32% | 151 |
| |
161,330 | 171 | 2.50% | 200 |
| |
158,758 | 172 | 13.40% | 206 |
| |
149,427 | 173 | 41.59% | 50 |
| |
124,254 | 174 | 73.14% | 58 |
| |
105,833 | 175 | 11.92% | 171 |
| |
96,847 | 176 | 52.35% | 124 |
| |
92,108 | 177 | 88.66% | 30 |
| |
68,295 | 178 | 96.91% | 6 |
| |
65,289 | 179 | 3.54% | 193 |
| |
60,962 | 180 | 98.32% | 2 |
| |
59,865 | 181 | 65.20% | 62 |
| |
59,150 | 182 | 22.35% | 167 |
| |
58,820 | 183 | 7.46% | 177 |
| |
58,359 | 184 | 10.00% | 175 |
| |
58,279 | 185 | 54.83% | 128 |
| |
57,482 | 186 | 53.81% | 125 |
| |
56,668 | 187 | 51.77% | 83 |
| |
56,460 | 188 | 1.08% | 207 |
| |
56,068 | 189 | 58.12% | 87 |
| |
49,147 | 190 | 25.82% | 139 |
| |
49,132 | 191 | 67.60% | 70 |
| |
49,099 | 192 | 25.41% | 157 |
| |
47,776 | 193 | 45.00% | 125 |
| |
46,174 | 194 | 77.00% | 38 |
| |
45,403 | 195 | 94.20% | 12 |
| |
42,068 | 196 | 75.70% | 29 |
| |
38,958 | - | 41.03% year 2012 | - |
| |
37,982 | 197 | 67.60% | 56 |
| |
36,270 | 198 | 96.64% | 8 |
| |
35,226 | 199 | 93.36% | 11 |
| |
32,905 | 200 | 31.50% | 133 |
| |
18,878 | - | 65.02% year 2012 | - |
| |
16,484 | 201 | 54.21% year 2009. | 86 |
| |
14,615 | 202 | 13.00% | 166 |
| |
14,456 | 203 | 37.60% year 2012 | 98 |
| |
10,217 | 204 | 19.28% | 165 |
| |
10,209 | 205 | 64.80% year 2013 | 59 |
| |
4,234 | 206 | 42.70% | 121 |
| |
2,906 | - | 37.6% year 2012 | - |
| |
2,842 | - | 96.9% year 2013 | - |
| |
2,833 | 207 | 54.60% year 2013 | 78 |
| |
1,383 | - | 8.95% year 2012 | - |
| |
1,034 | 208 | 86.90% year 2013 | 18 |
| |
361 | - | 41.0% year 2012 | - |
See also
- List of countries by Internet connection speeds
- National broadband plans from around the world
- Global digital divide
- Project Loon, a Google research and development project to provide Internet access to rural and remote areas
- List of social networking websites
- List of cable Internet providers
- List of countries by number of broadband Internet subscriptions
- List of countries by number of telephone lines in use
- List of countries by smartphone penetration
- List of mobile network operators
- List of multiple-system operators
- List of telephone operating companies
Notes
- ↑ Please note that the data for the number of Internet users is based on multiplying an estimate for the percentage of people using the Internet in a given country from one source (usually the ITU) by the population from another source (usually the U.S. Census Bureau). There are not enough significant figures in the percentage estimate for the precise Internet user counts found in the table to be meaningful. As a result, they should not be treated as precise figures or even precise estimates.
References
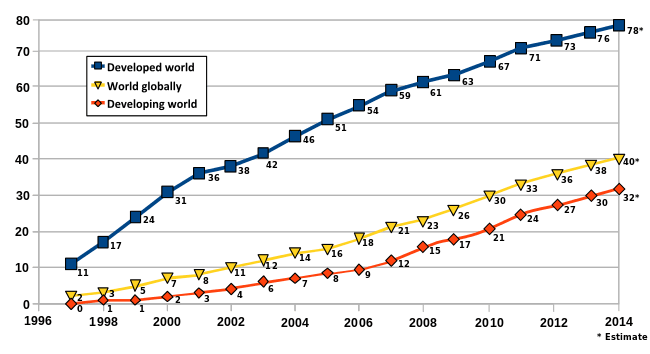
- ↑ "Individuals using the Internet 2005 to 2014", Key ICT indicators for developed and developing countries and the world (totals and percentage rates), International Telecommunication Union (ITU). Retrieved 25 May 2015.
- ↑ "Internet users per 100 inhabitants 1997 to 2007", ICT Data and Statistics (IDS), International Telecommunication Union (ITU). Retrieved 25 May 2015.
- 1 2 "Percentage of Individuals using the Internet 2000-2012", International Telecommunications Union (Geneva), June 2013, retrieved 22 June 2013
- ↑ "Internet users (per 100 people) - Data".
- ↑ "Definitions of World Telecommunication/ICT Indicators, March 2010" (PDF). International Telecommunication Union (Geneva). March 2010. Archived from the original (PDF) on 20 December 2014. Retrieved 28 October 2015 – via Internet Archive.
- ↑ "Total Midyear Population for the World: 1950-2050", International Programs Center for Demographic and Economic Studies, U.S. Census Bureau. Retrieved 24 May 2014.
- 1 2 ICT Facts and Figures 2005, 2010, 2014, Telecommunication Development Bureau, International Telecommunication Union (ITU). Retrieved 24 May 2015.
External links
- "Internet Monitor", a research project of the Berkman Center for Internet & Society at Harvard University to evaluate, describe, and summarize the means, mechanisms, and extent of Internet access, content controls and activity around the world.
- Number Of Internet Users Worldwide (Live-Counter)
- "Dominican Republic Internet Users". www.internetlivestats.com. Retrieved 2016-10-28.
Internet in the Americas | ||
|---|---|---|
| ||
| Sovereign states |
| .svg.png) |
| ||
This article is issued from Wikipedia - version of the 11/30/2016. The text is available under the Creative Commons Attribution/Share Alike but additional terms may apply for the media files.