Malaysian general election, 1986
Malaysian general election, 1986
|
|
|
|
All 177 seats to the Dewan Rakyat
89 seats needed for a majority |
| Registered |
6,791,446 |
| Turnout |
4,752,004 (74.39%) |
| |
First party |
Second party |
Third party |
| |
 |
 |
PAS |
| Leader |
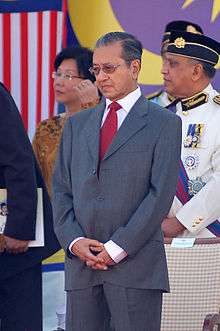
Mahathir Mohamad |
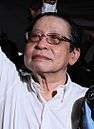
Lim Kit Siang |
Yusof Rawa |
| Party |
Barisan Nasional |
DAP |
PAS |
| Leader since |
16 July 1981 |
October 1969 |
1982 |
| Leader's seat |
Kubang Pasu |
Tanjong |
No seat |
| Last election |
132 seats, 60.5% |
9 seats, 19.6% |
5 seats, 14.5% |
| Seats won |
148 |
24 |
1 |
| Seat change |
 16 16 |
15 |
 4 4 |
| Popular vote |
2,649,238 |
975,544 |
716,952 |
| Percentage |
57.3% |
21.1% |
15.5% |
| Swing |
3.2% |
1.5% |
1.0% |
|
|
|
A general election was held between Saturday, 2 August and Sunday, 3 August 1986 for members of the 7th Parliament of Malaysia.[1] Voting took place in all 177 parliamentary constituencies of Malaysia, each electing one Member of Parliament to the Dewan Rakyat, the dominant house of Parliament. State elections also took place in 351 state constituencies in 11 (out of 13, except Sabah and Sarawak) states of Malaysia on the same day.
Results
Dewan Rakyat
Summary of the 2 – 3 August 1986 Malaysian Dewan Rakyat election results
| Party |
Vote |
Seats |
| Votes |
% |
Won |
% |
+/– |
|
National Front[lower-alpha 1] | BN | 2,649,238 | 57.28 | 148 | 83.62 | +16 |
|
|
United Malays National Organisation | UMNO | 1,474,063 | 31.06 | 83 | 46.89 | +13 |
|
Malaysian Chinese Association | MCA | 589,289 | 12.42 | 17 | 9.60 | -7 |
|
Malaysian People's Movement Party | Gerakan | 149,644 | 3.15 | 5 | 2.82 | 0 |
|
Malaysian Indian Congress | MIC | 104,701 | 2.21 | 6 | 3.39 | +2 |
| |
Sarawak United People's Party | SUPP | 93,018 | 1.96 | 4 | 2.26 | -1 |
|
United Sabah Party | PBS | 73,786 | 1.55 | 10 | 5.65 | New |
| |
United Traditional Bumiputera Party | PBB | 48,367 | 1.02 | 8 | 4.52 | 0 |
|
Sarawak National Party | SNAP | 34,221 | 0.72 | 4 | 2.26 | -2 |
| |
Muslim People's Party of Malaysia | HAMIM | 29,943 | 0.63 | 1 | 0.56 | New |
|
United Sabah National Organisation | USNO | 27,409 | 0.58 | 5 | 2.82 | +5 |
| |
Sarawak Native People's Party | PBDS | 24,822 | 0.52 | 5 | 2.82 | New |
|
People's Progressive Party | PPP | | | 0 | 0.00 | 0 |
|
Democratic Action Party | DAP | 975,544 | 21.09 | 24 | 13.56 | +15 |
|
Pan-Malaysian Islamic Party | PAS | 716,952 | 15.50 | 1 | 0.56 | -4 |
|
Malaysian People's Socialist Party | PSRM | | | 0 | 0.00 | 0 |
|
Social Democratic Party | SDP | | | 0 | 0.00 | 0 |
|
Nationalist Party of Malaysia | NASMA | | | 0 | 0.00 | New |
|
Sabah People's United Front | BERJAYA | | | 0 | 0.00 | 0 |
|
Sabah National Momogun Party | MOMOGUN | | | 0 | 0.00 | New |
|
Sarawak United Labour Party | PLUS | | | 0 | 0.00 | New |
|
Other parties | | 136,635 | 2.95 | 0 | 0.00 | 0 |
|
Independents | IND | 146,903 | 3.18 | 4 | 2.26 | -4 |
| Valid votes | 4,625,272 | |
| Invalid/blank votes | 126,732 |
| Total (turnout: 74.39%) | 4,752,004 | 100.00 | 177 | 100.00 | +23 |
| Did not vote | 2,039,442 | |
| Registered voters | 6,791,446 |
| Voting age population (aged 21 years and above) | 7,893,900 |
| Malaysian population | 16,110,000 |
| Source: Nohlen et al. |
- ↑ Contested using dacing election symbol on the ballot papers.
Results by state
| Summary of the 2 – 3 August 1986 Malaysian Dewan Rakyat election results by state |
|---|
- ↑ Contested using dacing election symbol on the ballot papers.
Summary of the 3 August 1986 Malaysian Dewan Rakyat election results in Kedah
| Party |
Candidates |
Vote |
Seats |
| Votes |
% |
Won |
% |
+/– |
|
National Front[lower-alpha 1] | BN | 14 | 256,690 | 60.20 | 14 | 100.00 | +2 |
|
|
United Malays National Organisation | UMNO | 12 | 220,797 | 51.78 | 12 | 85.71 | +2 |
| |
Malaysian Chinese Association | MCA | 2 | 35,893 | 8.44 | 2 | 14.29 | 0 |
|
Pan-Malaysian Islamic Party | PAS | 14 | 152,063 | 35.66 | 0 | 0.00 | -1 |
|
Democratic Action Party | DAP | 2 | 17,422 | 4.09 | 0 | 0.00 | 0 |
|
Social Democratic Party | SDP | 1 | 249 | 0.06 | 0 | 0.00 | 0 |
| Valid votes | 426,424 | |
| Invalid/blank votes | 10,536 |
| Total votes (voter turnout: 73.00%) | 436,960 | 100.00 | 14 | 100.00 | +1 |
| Did not vote | 161,634 | |
| Registered voters | 598,594 |
| Voting age population (aged 21 years and above) | ' |
| Kedah's population | ' |
|
Source: |
- ↑ Contested using dacing election symbol on the ballot papers.
- ↑ Contested using dacing election symbol on the ballot papers.
- ↑ Contested using dacing election symbol on the ballot papers.
Summary of the 3 August 1986 Malaysian Dewan Rakyat election results in Penang
| Party |
Candidates |
Vote |
Seats |
| Votes |
% |
Won |
% |
+/– |
|
National Front[lower-alpha 1] | BN | 11 | 183,724 | 49.44 | 5 | 45.45 | -2 |
|
|
United Malays National Organisation | UMNO | 4 | 66,746 | 17.96 | 4 | 36.36 | +1 |
|
Malaysian People's Movement Party | Gerakan | 4 | 62,799 | 16.90 | 1 | 9.09 | -1 |
| |
Malaysian Chinese Association | MCA | 3 | 54,179 | 14.58 | 0 | 0.00 | -2 |
|
Democratic Action Party | DAP | 7 | 147,641 | 39.73 | 6 | 54.55 | +4 |
|
Pan-Malaysian Islamic Party | PAS | 4 | 24,053 | 6.47 | 0 | 0.00 | 0 |
|
Malaysian People's Socialist Party | PSRM | 1 | 13,901 | 3.74 | 0 | 0.00 | 0 |
|
Nationalist Party of Malaysia | NASMA | 1 | 1,219 | 0.33 | 0 | 0.00 | New |
|
Social Democratic Party | SDP | 1 | 1,075 | 0.29 | 0 | 0.00 | New |
| Valid votes | 371,613 | |
| Invalid/blank votes | 9,503 |
| Total votes (voter turnout: 72.98%) | 381,116 | 100.00 | 11 | 100.00 | +2 |
| Did not vote | 141,078 | |
| Registered voters | 522,194 |
| Voting age population (aged 21 years and above) | ' |
| Penang's population | ' |
|
Source: |
- ↑ Contested using dacing election symbol on the ballot papers.
- ↑ Contested using dacing election symbol on the ballot papers.
- ↑ Contested using dacing election symbol on the ballot papers.
- ↑ Contested using dacing election symbol on the ballot papers.
Template:Malaysian general election, 1986 (Kuala Lumpur)
- ↑ Contested using dacing election symbol on the ballot papers.
- ↑ Contested using dacing election symbol on the ballot papers.
- ↑ Contested using dacing election symbol on the ballot papers.
Template:Malaysian general election, 1986 (Labuan)
- ↑ Contested using dacing election symbol on the ballot papers.
- ↑ Contested using dacing election symbol on the ballot papers.
|
State Assemblies
References
- ↑ Dieter Nohlen, Florian Grotz & Christof Hartmann (2001) Elections in Asia: A data handbook, Volume II, p152 ISBN 0-19-924959-8